Drought Conditions Improved This Fall, But Some Drought Issues Remain.
Report your Drought Impacts through Condition Monitoring Observer Reports (CMOR).
Key Points
- Precipitation this fall provided much-needed drought relief to many areas across the Upper Midwest, primarily in Minnesota, which hit record-high drought categories this summer. However, drought remains and currently covers 52% of the state, with 27% in severe drought (D2) and 3% in extreme drought (D3).
- In contrast, some portions of the Midwest have not received necessary fall precipitation, and drought conditions have worsened, particularly in Wisconsin. Drought of various levels has persisted since April in an area covering southern Wisconsin and northern Illinois.
- Drought impacts are minimal and less severe this time of year. The concern with the current impacts of low streamflow and reduced soil moisture is the potential for moisture deficits across portions of the region heading into the next growing season.
- Although short-term precipitation may begin to replenish near-surface water supply, it can take much longer to percolate into deeper soils and groundwater. It will be important to monitor winter precipitation to fully understand soil moisture conditions heading into next year’s growing season.
- The winter outlook (December 2021–February 2022) shows a slightly higher chance for above-normal precipitation and above-normal temperatures across much of the Midwest region; however, in the most drought-affected area of Minnesota, there are equal chances for below-, near-, or above-normal precipitation.
Current U.S. Drought Monitor map for the Midwest as of November 30, 2021.
The U.S. Drought Monitor is updated each Thursday to show the location and intensity of drought across the country. Drought categories show experts’ assessments of conditions related to dryness and drought including observations of how much water is available in streams, lakes, and soils compared to usual for the same time of year.
U.S. Drought Monitor Categories
Current U.S. Drought Monitor map for the Midwest as of November 30, 2021.
The U.S. Drought Monitor is updated each Thursday to show the location and intensity of drought across the country. Drought categories show experts’ assessments of conditions related to dryness and drought including observations of how much water is available in streams, lakes, and soils compared to usual for the same time of year.
Current Conditions
- Precipitation this fall provided much-needed drought relief to many areas across the Upper Midwest, primarily in Minnesota, which hit record-high drought categories this summer. However, drought remains and currently covers 49% of the state, with 27% in severe drought (D2) and 1.4% in extreme drought (D3). Portions of Iowa, southern Wisconsin, northern Illinois, central Indiana, and the Upper Peninsula of Michigan also saw some improvement (Figure 1).
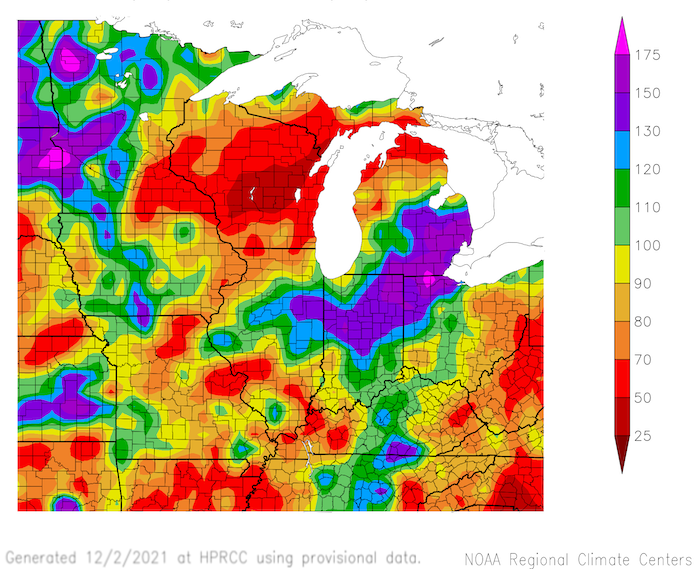
- In contrast, some portions of the Midwest have not been as fortunate with fall precipitation, allowing drought conditions to worsen. Moderate drought (D1) has expanded across northern and central Wisconsin and the southern part of the Upper Peninsula of Michigan over the last three months and currently covers 47% of Wisconsin, with 2% of the state in severe drought (D2). In these areas, precipitation since early September has only been 25%–70% of normal (Figure 2).
- One area of persistent drought for the last several months is across southern Wisconsin and northern Illinois. Drought conditions began in April 2021 in this area, with conditions peaking with extreme drought (D3) from mid-June to mid-July and again in September. While conditions have improved, drought persists with significant long-term precipitation departures (10–15 inches below normal over the last 12 months).
Figure 1. 12-Week Change Map for the U.S. Drought Monitor (Since September 7, 2021)
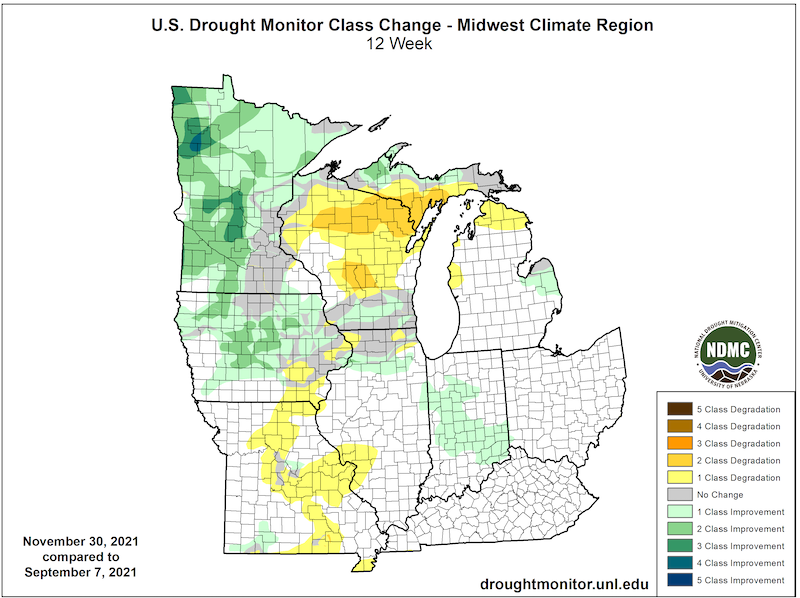
Figure 2. 90-Day Percent of Normal Precipitation (September 3–December 1, 2021)
Impacts
- Surface streamflow is below to much-below normal in portions of the Upper Midwest that are experiencing drought, primarily around northern Illinois, northern Minnesota, and the Upper Peninsula of Michigan (Figure 3).
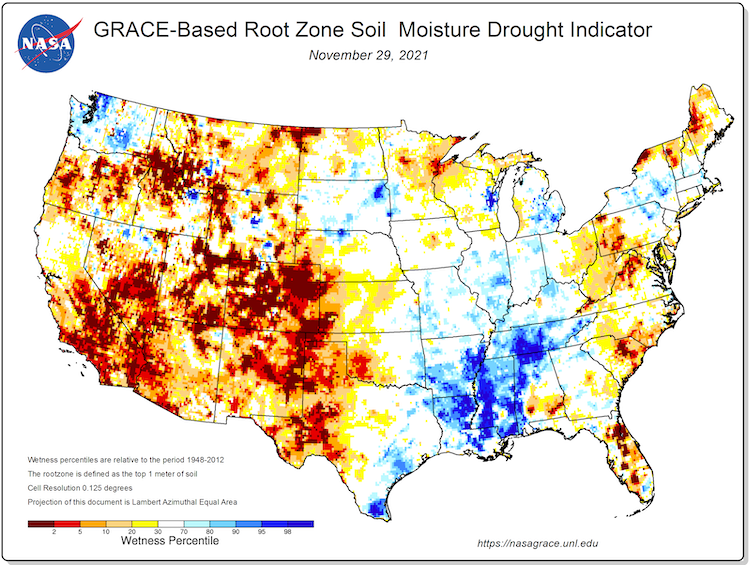
- There are only a few pockets of below-normal soil moisture in the Upper Midwest around western Lake Superior, central Iowa, southern Wisconsin, and western Michigan (Figure 4). In northern Illinois, in situ (observed) soil moisture from the state’s mesonet shows some stations’ soil moisture (4 inches) is below normal, with a decreasing trend in deep soil moisture (20 inches) as well. The recent warmth and lack of rain has helped to dry soil surfaces across larger areas, adding to the complication of soil moisture conditions across the region.
- Outside of the growing season, drought impacts tend to be less apparent and less severe. Some current impacts include potential health issues due to leaf blowers kicking up dust from dry soils, dry small ponds and wetlands, and less food or water available for wildlife. Also, with prescribed burns still happening in some areas, dry soil and windy conditions increase the risk for the development of uncontrolled fires.
- The concern with the current impacts of low streamflow and reduced soil moisture in some areas is the potential for issues next growing season. If winter does not bring enough precipitation to recharge the streams and soils, portions of the region could begin the next growing season with moisture deficits. When the ground is frozen, the amount of precipitation that can soak into the soils is limited. When the ground is frozen, the amount of precipitation that can soak into the soils is limited.
Report your Drought Impacts through Condition Monitoring Observer Reports (CMOR):
Figure 3. U.S. Geological Survey Streamflow Percentiles
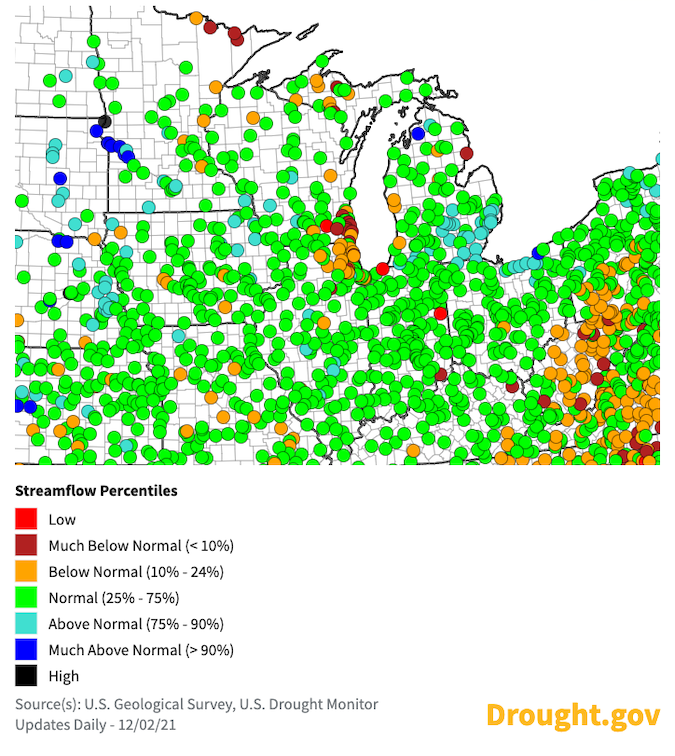
Figure 4. NASA-GRACE Root-Zone Soil Moisture Drought Indicator
Outlook and Potential Impacts
- The NOAA Climate Prediction Center (CPC) outlook for December 2021 shows slightly higher chances for above-normal precipitation around the Great Lakes basin, with equal chances for below-, near-, or above-normal precipitation elsewhere in the region.
- As a result, the U.S. Monthly Drought Outlook from CPC expects drought to persist across northern Minnesota, Iowa, and southern Wisconsin/northern Illinois, with potential drought removal in northern Wisconsin and the Upper Peninsula of Michigan (Figure 5).
- Looking at the entire winter season, the outlook for December 2021 to February 2022 from CPC shows a slightly higher chance for above-normal precipitation and above-normal temperatures across much of the Midwest region, which could help alleviate remaining drought issues. However, the outlooks show equal chances for below-, near-, or above-normal precipitation and temperature across much of Minnesota, which is currently the most drought-affected area in the region (Figure 6).
- Although short-term precipitation may begin to replenish near-surface water supply, it can take much longer to percolate into deeper soils and groundwater. It will be important to monitor winter precipitation to fully understand soil moisture conditions heading into next year’s growing season.
Figure 5. U.S. Monthly Drought Outlook (Valid December 2021)
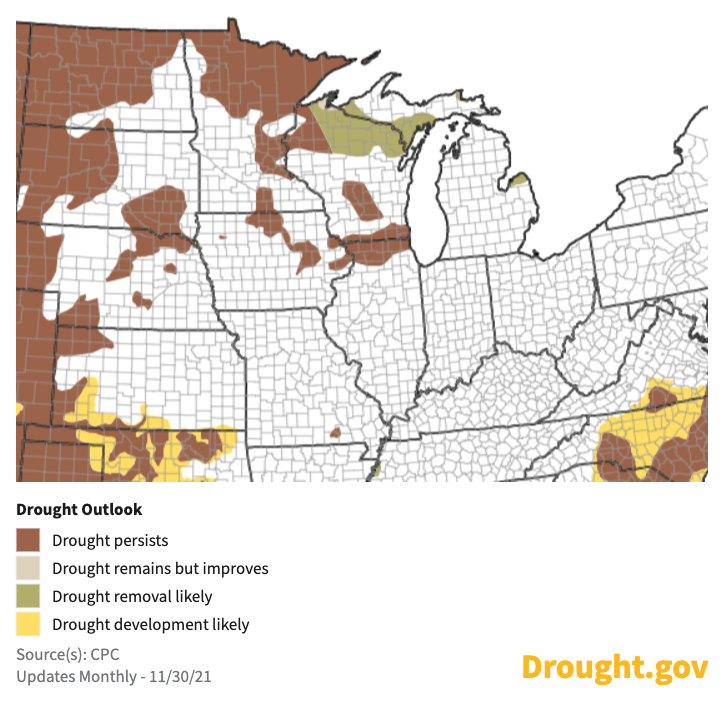
Figure 6: U.S. Precipitation Outlook for December 2021-February 2022
For More Information
- NIDIS and its partners will issue future updates as conditions evolve.
- More local information is available from the following resources:
- The upcoming North Central U.S. Climate and Drought Summary & Outlook Webinar on December 16, 2021 will offer updated information about conditions, impacts, and outlooks.
- NOAA and partners recently released a La Niña Impacts and Outlook report for the Midwest region, which provides information on the typical La Niña winter pattern, the La Niña outlook, potential impacts, and comparisons of conditions during previous La Niña years for the Midwest U.S.
Prepared By
Molly Woloszyn
NOAA/National Integrated Drought Information System (NIDIS)
Dennis Todey & Laurie Nowatzke
USDA Midwest Climate Hub
Doug Kluck
NOAA/National Centers for Environmental Information
Melissa Widhalm
Midwestern Regional Climate Center/Purdue University
Ray Wolf & Audra Bruschi
NOAA/National Weather Service
This drought status update is issued in partnership between the National Oceanic and Atmospheric Administration (NOAA) and the U.S. Department of Agriculture (USDA) to communicate a potential area of concern for drought expansion and/or development within the Midwest U.S. based on recent conditions and the upcoming forecast. NIDIS and its partners will issue future drought status updates as conditions evolve.

