Dry Conditions Forecasted to Persist: Potential Impacts in the Intermountain West.
Key Points
- Despite recent precipitation, exceptional drought conditions persist over areas of the Intermountain West, U.S. (Arizona, Colorado, New Mexico, Utah, Wyoming).
- The regional average annual precipitation for 2020 was the second lowest on record and lowest since 1956.
- Snow water equivalent so far this season has been low.
- Dry conditions are expected to continue for the Southwest.
Current U.S. Drought Monitor map for the Intermountain West Drought Early Warning System (DEWS) region with data valid for January 5, 2021. The U.S. Drought Monitor (USDM) is updated each Thursday to show the location and intensity of drought across the country.
Extreme (D3) to Exceptional (D4) Drought persists across much of the Intermountain West:
- Arizona (94% of the state)
- Colorado (76%)
- New Mexico (82%)
- Utah (90%)
- Wyoming (26%).
Extreme (D3) drought conditions have been in place in this region since May 2020.
U.S. Drought Monitor Categories
Current U.S. Drought Monitor map for the Intermountain West Drought Early Warning System (DEWS) region with data valid for January 5, 2021. The U.S. Drought Monitor (USDM) is updated each Thursday to show the location and intensity of drought across the country.
Extreme (D3) to Exceptional (D4) Drought persists across much of the Intermountain West:
- Arizona (94% of the state)
- Colorado (76%)
- New Mexico (82%)
- Utah (90%)
- Wyoming (26%).
Extreme (D3) drought conditions have been in place in this region since May 2020.
2020 Recap
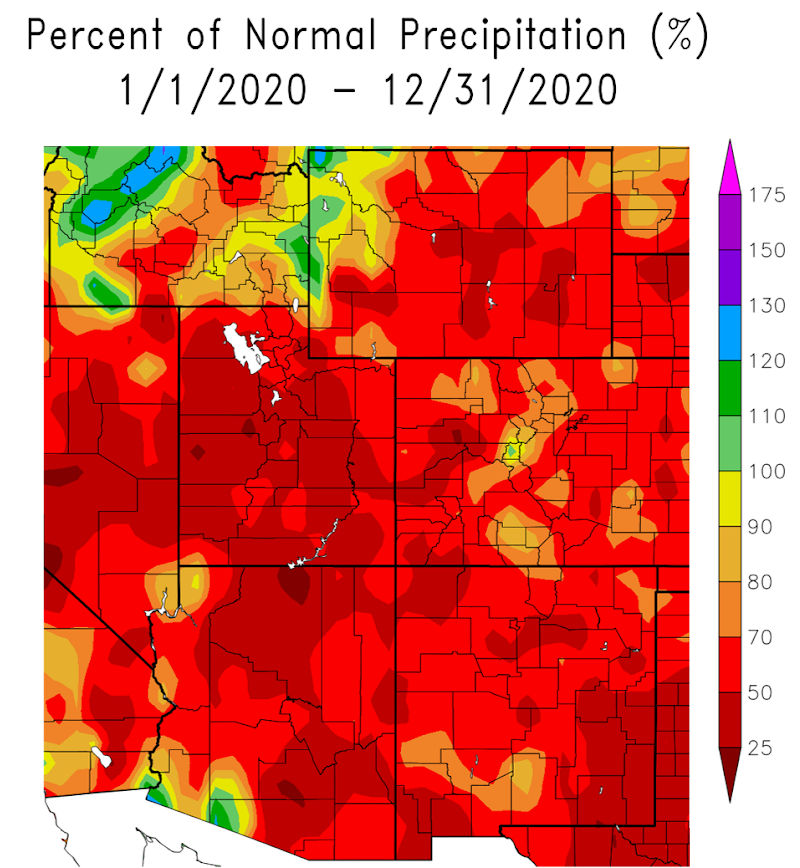
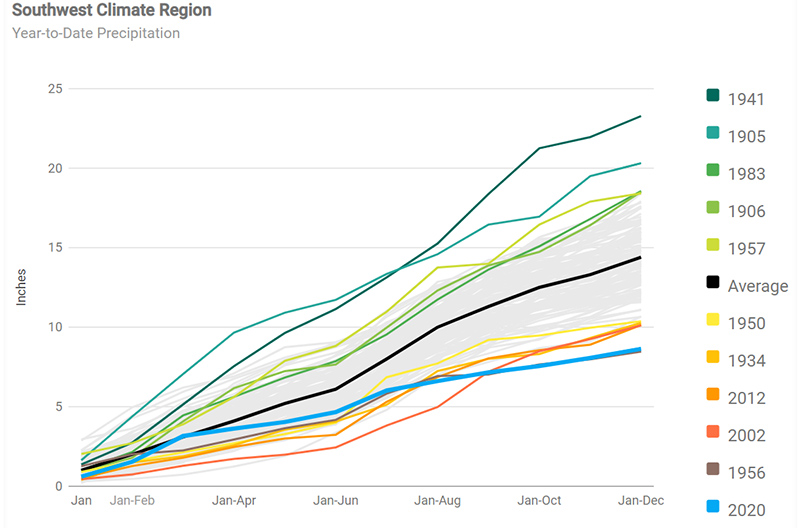
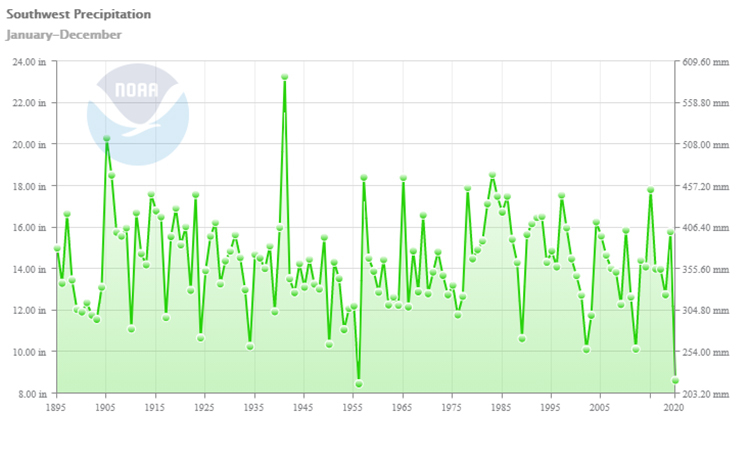
2020 Rainfall for the Intermountain West Region
Rainfall across the Intermountain West region was the second lowest on record and the lowest since 1956.
Annual state-wide average rainfall:
- Arizona: 6.63 inches, 5.99 inches below average, second driest
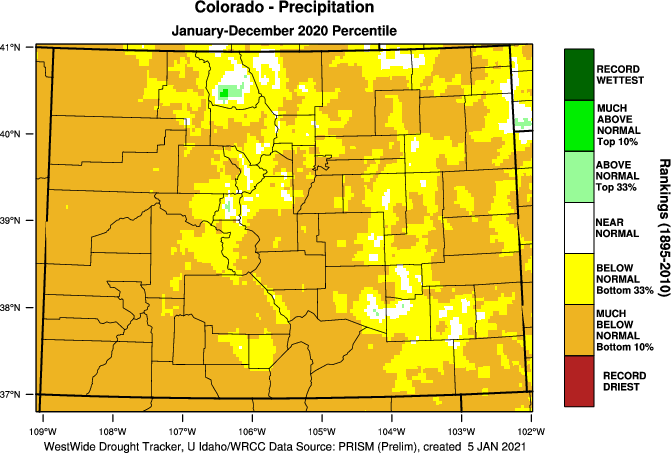
- Colorado: 12.22 inches, 5.90 inches below average, second driest
- New Mexico: 8.42 inches, 5.57 inches below average, fourth driest
- Utah: 7.23 inches, 5.88 inches below average, driest on record
- Wyoming: 11.67 inches, 4.27 inches below average, fifth driest
The combined area average total rainfall was 8.64 inches, or 5.91 inches below average.
Current Conditions
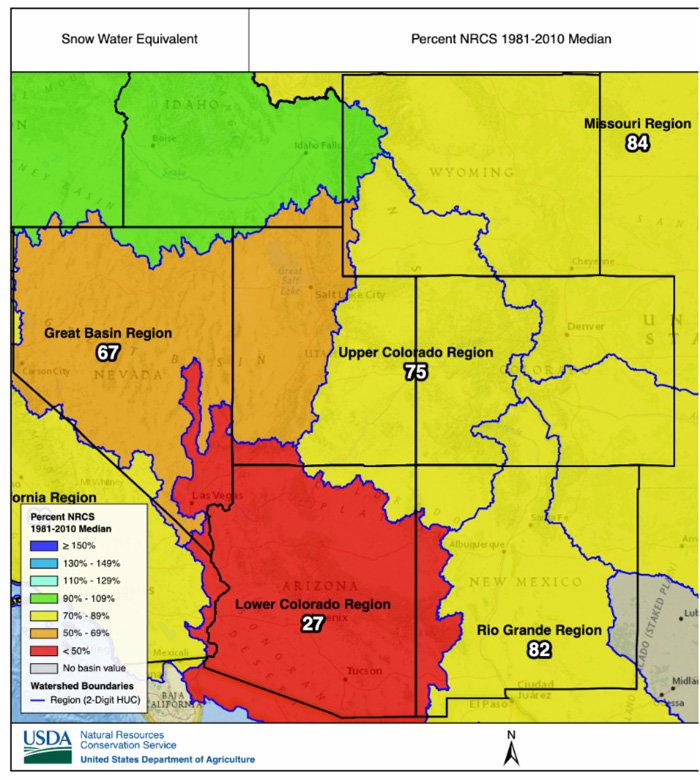
Current Snow Water Equivalent (SWE)
Most of the Intermountain West has experienced low SWE for this winter, so far. Of note, the upper Colorado River basin catchments are currently at 74% of the Natural Resources Conservation Service (NRCS) 1981–2010 median.
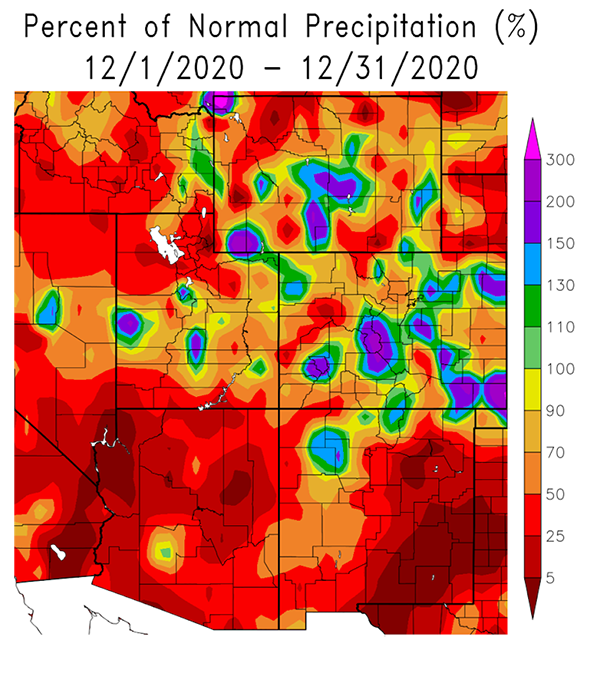
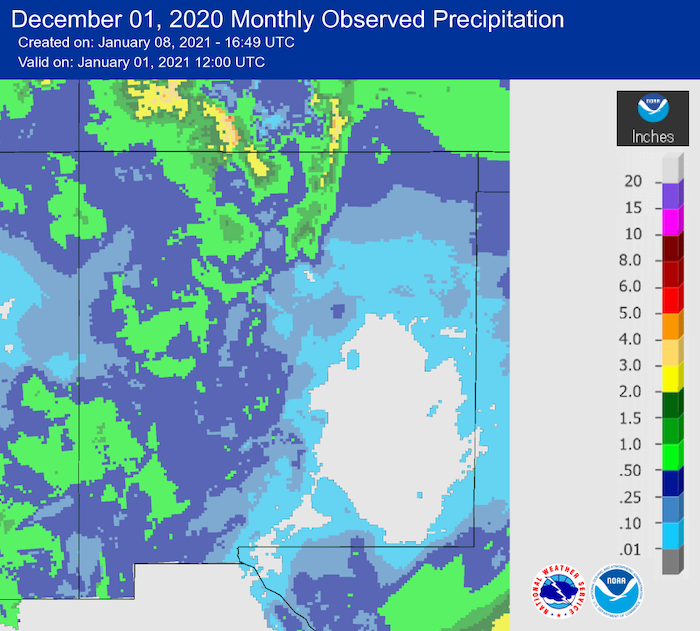
December Precipitation
- A few small snow storms crossed Utah and Colorado in December.
- With a few small exceptions in Colorado and the central Utah mountains, the Intermountain West experienced precipitation in December that was less than 50% of the long-term average.
- December precipitation is usually low for most of the region, and a small amount of precipitation can represent a large percentage of normal precipitation.
- This is especially true for eastern Colorado, where the mean December precipitation is 0.3–0.8 inches.
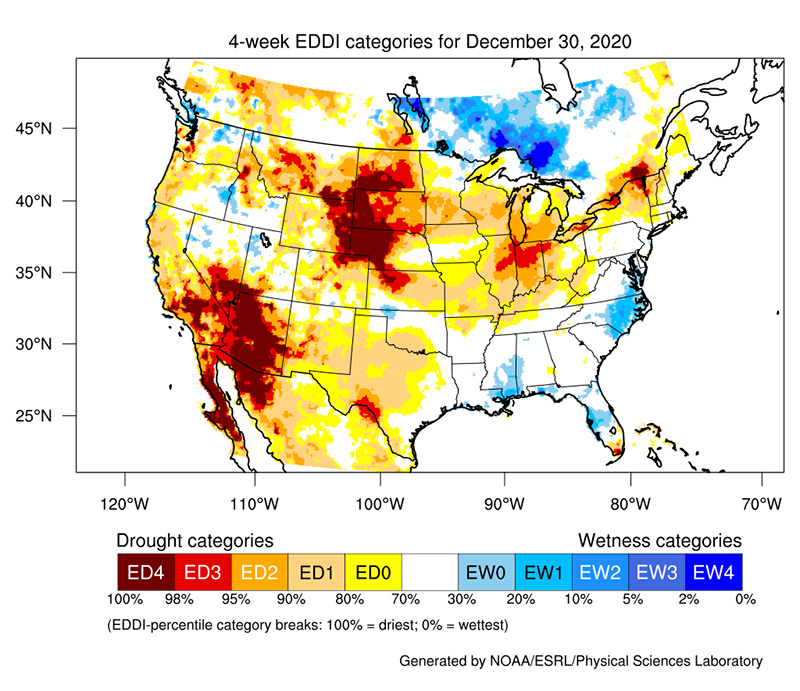
Evaporative Drought Demand Index (EDDI)
4-Week EDDI for December 30, 2020
Increased heat, wind, low humidity, and ample sun recently have greatly increased atmospheric demand over western Arizona.
Seasonal Outlooks
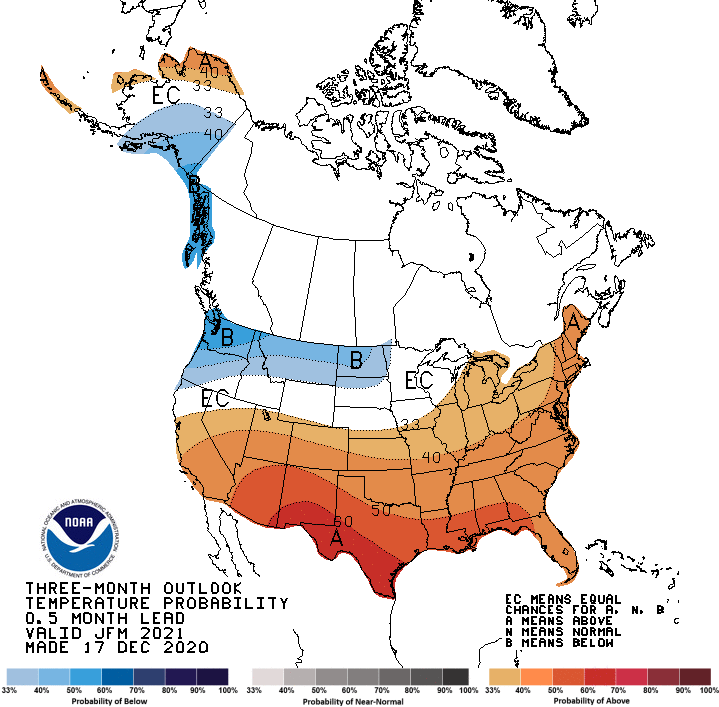
Temperature Outlook
There is a greater chance for above-normal temperatures across the Intermountain West for the months January through March, with the highest probabilities in southern New Mexico.
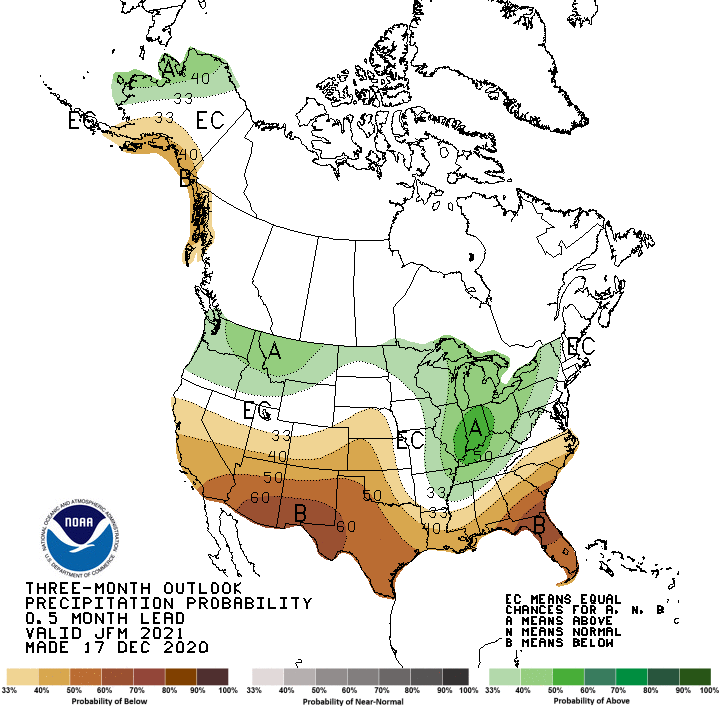
Precipitation Outlook
The precipitation outlook shows that below-average rainfall is the most likely outcome for January–March across the Southwest, including Arizona, New Mexico, and the southern parts of Utah and Colorado. This pattern is typical of strong La Niña patterns.
State-Based Conditions and Impacts
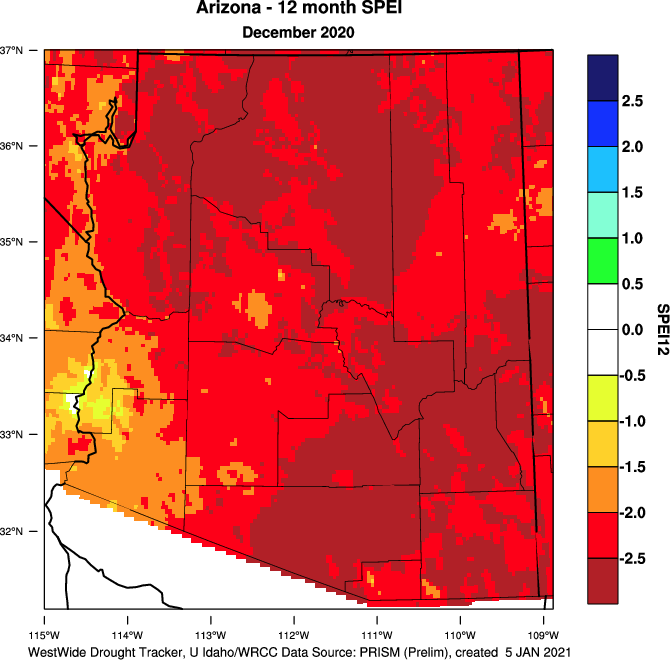
Arizona
- Wildfire danger continued through summer and into winter.
- Soils are extremely dry, so even if we have a reasonable snowpack, runoff will likely be very low in spring.
- Combination of the dry conditions (driest summer on record for most of the state) and exceptional heat (hottest summer on record for most of the state) led to exceptional SPEI.
Colorado
- After a lack of monsoons and a warm and dry fall, winter precipitation has started off slow.
- Southern mountains have gotten some decent snowpack so far, but the rest of the high elevations are below average.
- Widespread drought still impacts the entire state, with extreme, long-term drought covering more than half of the state.
New Mexico
- 2020 was fourth driest year on record for New Mexico and the driest year since 2012.
- The summer months, including the monsoon period (May–September) in 2020, were the driest on record for New Mexico.
- December is usually dry in southeast New Mexico (mean ~0.5 inches). December 2020 was especially dry with most locations getting between 0.0–0.05 inches.
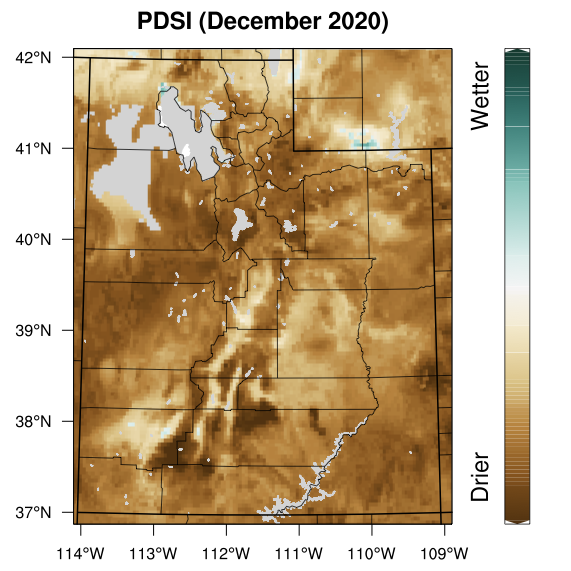
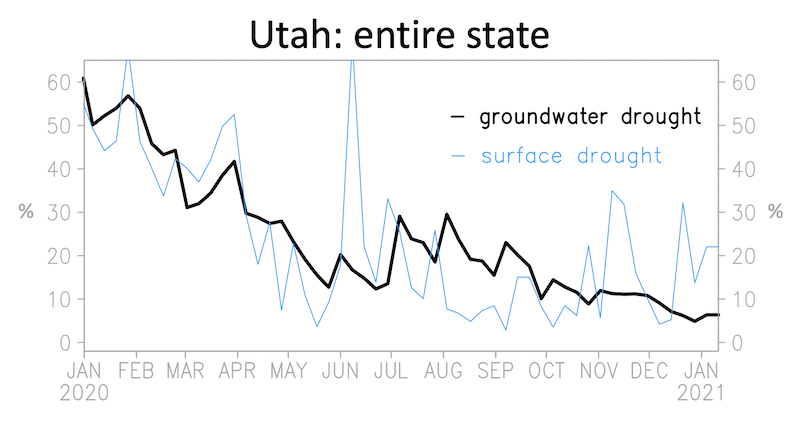
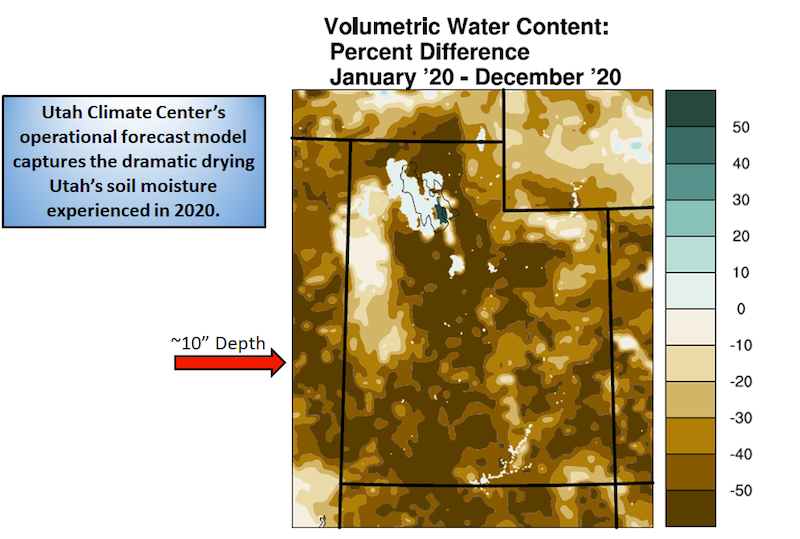
Utah
- Utah has seen a steady decline in the Palmer Drought Severity Index (PDSI) since March 2020.
- Soil moisture and groundwater in Utah experienced a steady decline through 2020.
For More Information
More local information is available from the following resources:
Prepared By
Joel Lisonbee
NOAA/National Integrated Drought Information System (NIDIS)
Simon Wang, Hongping Gu, Jon Meyer
Utah Climate Center
Nancy J. Selover
Arizona State Climatologist
Russ Schumacher, Becky Bolinger
Colorado Climate Center
This Drought Early Warning Update is issued in partnership between the National Oceanic and Atmospheric Administration, the U.S. Department of Agriculture, and the offices of the state climatologist for Arizona, Colorado, New Mexico, and Utah. The purpose of the update is to communicate a potential area of concern for drought expansion and/or development within the Intermountain West based on recent conditions and the upcoming forecast. NIDIS and its partners will issue future Drought Updates as conditions evolve.
