As Summer Heats Up, the Monsoon Is on the Horizon
Key Points
- Severe (D2) to exceptional (D4) drought persists across the Intermountain West.
- The seasonal outlook hints at a wet Southwest Monsoon season.
- Floods replace drought in northwestern Wyoming.
Current U.S. Drought Monitor map for the Intermountain West Drought Early Warning System (DEWS) region with data valid for June 14, 2022. The U.S. Drought Monitor is updated each Thursday to show the location and intensity of drought across the country.
38% of the Intermountain West DEWS region is experiencing extreme to exceptional drought (D3–D4).
U.S. Drought Monitor Categories
Current U.S. Drought Monitor map for the Intermountain West Drought Early Warning System (DEWS) region with data valid for June 14, 2022. The U.S. Drought Monitor is updated each Thursday to show the location and intensity of drought across the country.
38% of the Intermountain West DEWS region is experiencing extreme to exceptional drought (D3–D4).
Current Drought Conditions and Outlook
U.S. Drought Monitor Conditions
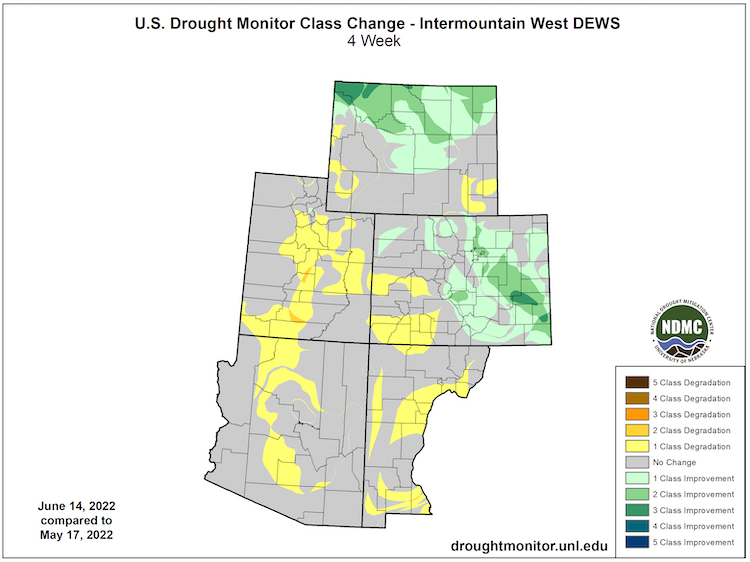
- There has been little change in drought conditions across the Intermountain West.
- Exceptional (D4) drought exists in the region in northeastern and southern New Mexico, central Utah, southeastern Colorado, and has recently expanded into western Arizona.
- 38% of the region is experiencing extreme (D3) drought or worse.
- Extreme (D3) drought conditions have been in place in this region since May 2020.
- Moderate (D1) or worse drought has been in the region since August 2009.
U.S. Drought Monitor 4-Week Change Map
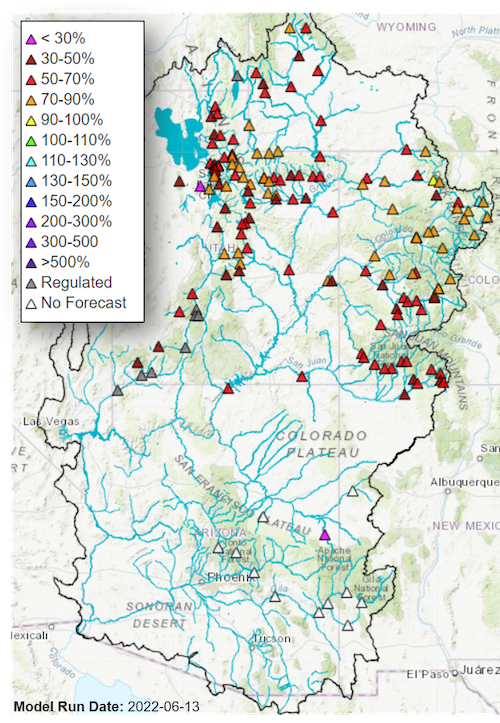
Water Availability Forecast
With the seasonal snowmelt almost complete, Upper Colorado River Basin water supply forecasts generally range between 35%–95% of the 1991–2020 historical April–July average. Great Basin water supply forecasts are 35%–85% of average.
April–July Runoff Volume Guidance
Forecasts and Seasonal Outlooks
July 2022
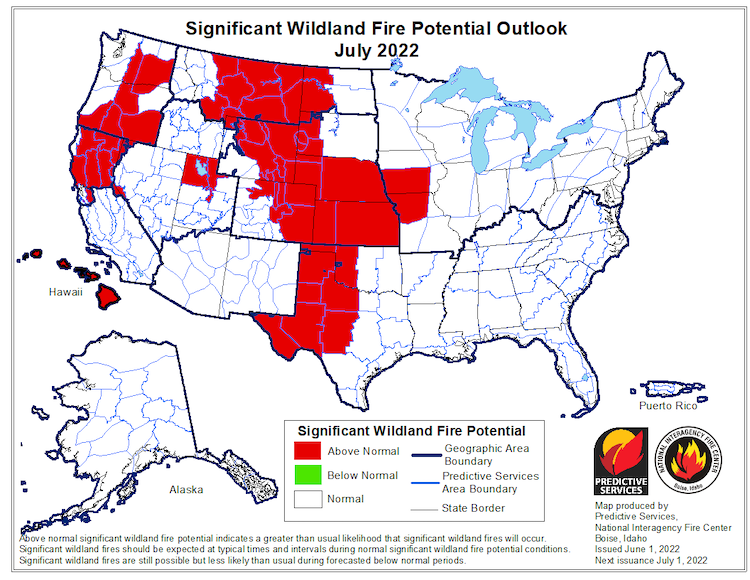
Fire risk is elevated for drought-stricken areas of the Intermountain West:
- The Southwest Monsoon onset is expected to reduce significant wildland fire potential over the Southwest.
- Significant wildland fire potential remains elevated over northern Utah and eastern Colorado and Wyoming.
Significant Wildland Fire Potential Outlook: July 2022
According to the Climate Prediction Center's monthly outlook for July:
- Increased temperatures are likely across the whole Intermountain West region with the highest odds over northeastern New Mexico and southern Colorado.
- The Southwest Monsoon is likely to see a wet start to the season, with above-normal precipitation likely for most of Arizona and some of western New Mexico.
- Odds favor below-normal monthly precipitation for the plains of eastern Colorado and eastern New Mexico.
July 2022 Temperature Outlook
July 2022 Precipitation Outlook
3-Month Outlook for July–September 2022
Seasonal forecasts show a hotter-than-normal season ahead for the Intermountain West, but hint at an active Southwest Monsoon season:
- Odds favor increased temperatures through the remainder of summer 2022 for the Intermountain West region.
- Normal to above-normal precipitation is likely for the Southwest Monsoon season, which usually runs from June 15 through September 30. Monsoonal rainfall is highly variable throughout the season.
- Keep track of the monsoon using the Monsoon Tracker.
- Lower-than-normal precipitation is more likely than not for Wyoming and eastern Colorado, and odds slightly favor a drier-than-average season in eastern New Mexico.
Three-Month Temperature Outlook: July–September 2022
Three-Month Precipitation Outlook: July–September 2022
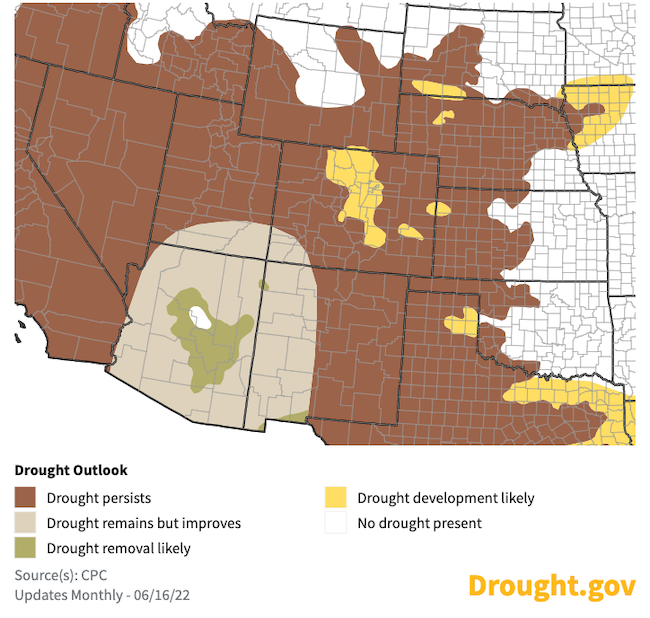
Seasonal Drought Outlook
- With the precipitation outlook leaning toward a wet monsoon season, some short-term drought improvement is likely for the Southwest. However, similar to what happened in summer 2021, a robust monsoon season will not eliminate long-term drought in the region.
- June, July, and August are typically the driest months of the year for northern Utah and northern Colorado, and it would be unusual for drought to be removed in these regions in summer.
June 16–September 30 Drought Outlook
La Niña Persists and May Impact Winter Weather
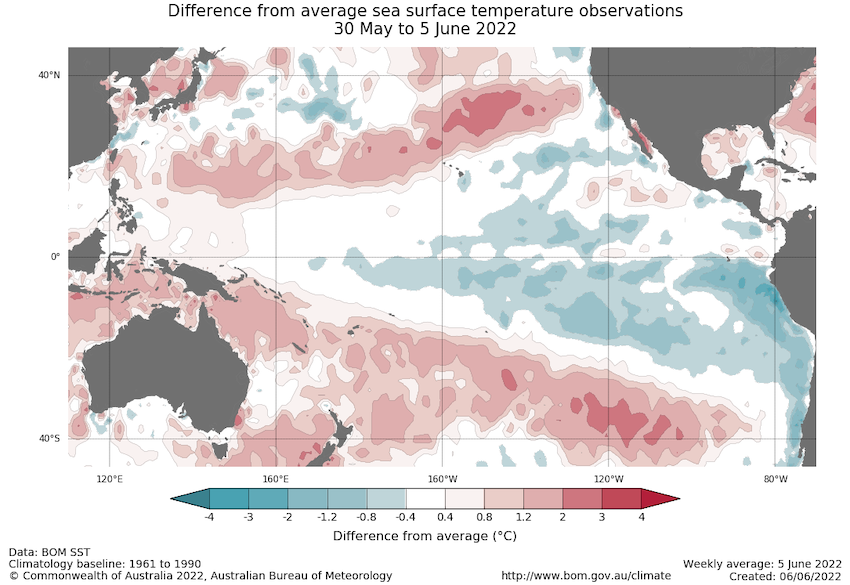
- One of the primary drivers of drought across the Southwest through winter and spring was a La Niña pattern in the Pacific.
- The June 5 weekly NINO3.4 value was −0.5 °C, indicating an expected seasonal decline in a persistent La Niña pattern in the central Pacific.
- La Niña patterns do not usually persist into northern-hemisphere summer months, but the few historical events that have persisted experienced increased precipitation in southern Arizona and decreased precipitation in northern Utah and Wyoming (learn more). No two La Niña patterns are the same.
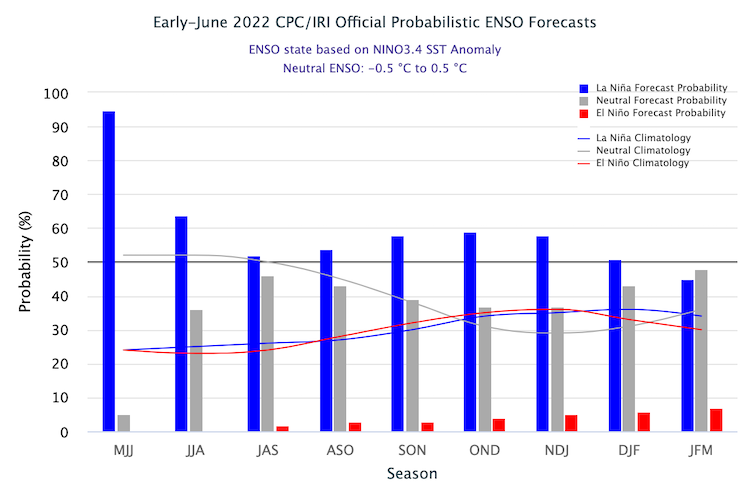
- The latest forecasts for winter 2022–23 indicate that another La Niña is slightly more likely to occur than a neutral pattern this winter, and an El Niño is unlikely. This means another dry winter is possible for the Southwest.
- For more information, please check out the NOAA El Niño–Southern Oscillation (ENSO) blog.
Sea Surface Temperature Anomalies (°C) for May 30–June 5, 2022
Probability of El Niño, La Niña, or Neutral Conditions
State-Based Conditions and Impacts
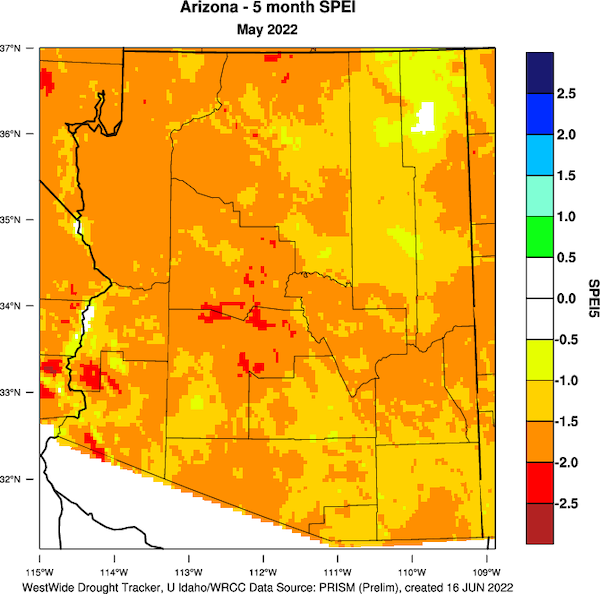
Arizona
- As of June 14, the majority of Arizona (75%) moved to extreme (D3) or severe (D2) drought, while 3% of western Arizona remained in exceptional (D4) drought. Central Arizona retained moderate (D1) drought, with abnormally dry (D0) conditions along the higher elevations of the Mogollon Rim.
- The past two months ranked as the driest April–May on record, with no measurable precipitation anywhere in the state during May and only an isolated amount in April.
- Arizona has experienced a total of three Type 1 wildland fires to date this year (Pipeline, Haywire, and Tunnel), all located largely in the grasslands in central Coconino County. Thousands of household evacuations were ordered.
- The calendar year to date ranks as the 3rd driest and 14th warmest on record.
5-Month Standardized Precipitation Evapotranspiration Index (SPEI)
Colorado
- Colorado experienced near-normal temperature and precipitation conditions over the month of May. By and large, this did lead to some improvements. May is part of the wet season for much of Colorado, so in many ways, an average May is a relief.
- Conditions were quite mixed across the state. The northwest and southeast quadrants of the state received above-average moisture. The southwest corner was dry, and snow melted early.
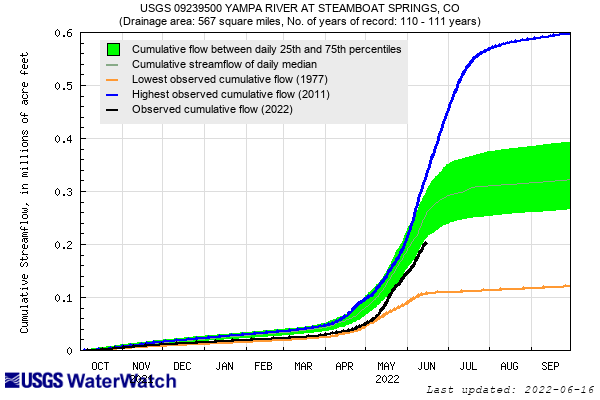
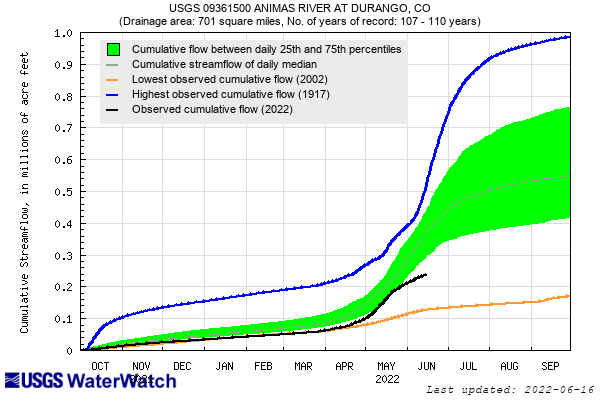
- Streamflows peaked in mid-May, which is earlier than normal. Flows were then slowed by a cold snap. Streamflows rebounded to near peak levels following the cold snap. Cumulative flows are looking better than the last two years for northern Colorado. The Colorado Headwaters and Yampa River Basins are running near 30th percentile historical values. With a dry spring, streamflow conditions in southern Colorado are straying well into the below-normal range.
Water Year Cumulative Streamflow
New Mexico
- Statewide, spring (March-April-May) 2022 was the 6th driest spring on record for New Mexico with 0.76 inches of precipitation.
- The Hermits Peak/Calf Canyon Fire Complex and the Black Fire are the first and second largest fires in modern records for the state of New Mexico.
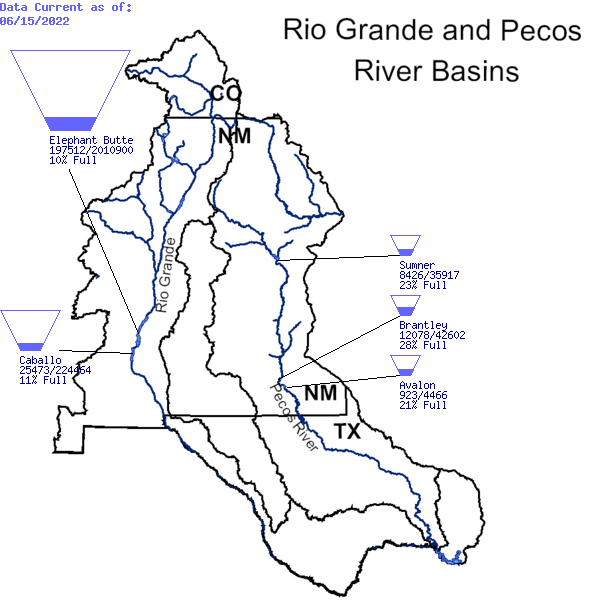
- As of June 15, reservoir storage along the Rio Grande and Pecos River Basins is very low. Along the Rio Grande, Elephant Butte is at 10% full, and Caballo is at 11% full. On the Pecos River, Sumner is at 23%, Brantley is at 28%, and Avalon is at 21%.
- A new state-wide Drought Severity and Coverage Index (DSCI) record for New Mexico occurred on June 14, 2022 with a score of 440.03. This is the most intense drought in New Mexico since June 25, 2013.
Reservoir Storage: Rio Grande and Pecos Rivers
Utah
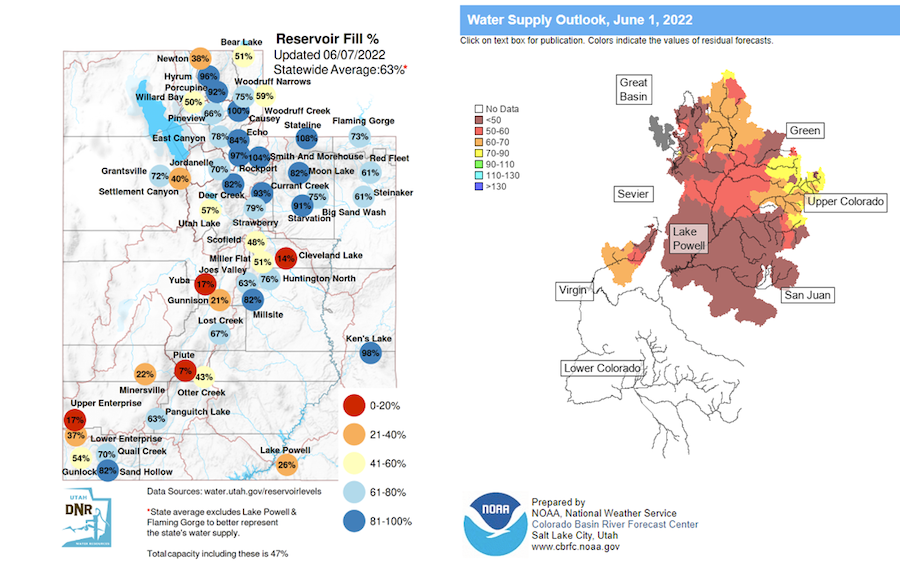
- Extreme drought (D3) has expanded, and exceptional drought (D4) has been introduced across southern Utah due to limited to no late-spring precipitation, combined with high evaporative demand from unseasonably warm temperatures and frequent strong wind events.
- Spring runoff has not sufficiently recharged the major reservoirs of the state, leading to year-over-year declines and scaled-back water supply forecasts by river forecast centers.
- The Great Salt Lake will enter historically low water levels once again this summer, and is now expected to experience significant ecological damage to local biology due to rising salinity levels. The exposed lake bed also contains high levels of arsenic and mercury, causing concern for toxic dust lofted into local populations during wind events.
June Reservoir Fill Percentage and Water Supply Forecast
Wyoming
- Precipitation/Snowpack:
- The snowpack melt out continued into June.
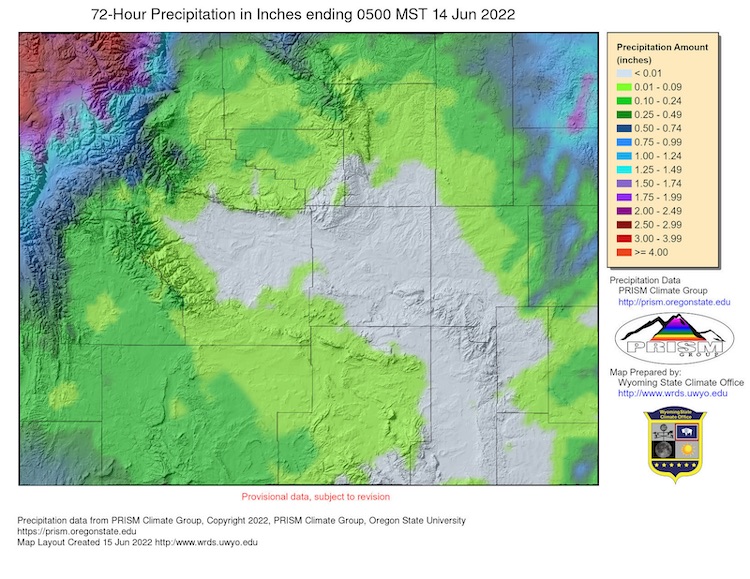
- Rapid melt out, with soil moisture levels above median, coupled with a heavy precipitation event on June 11–13 that produced rainfall totals up to 4 inches, pushed streams to overflowing. This caused extensive damage in the Yellowstone area and the closure of the park.
- Precipitation in the last few weeks, especially in the north even prior to the June 11–13 event, lessened drought conditions across much of the northern tier of the state.
- Soil Moisture:
- Soil moisture continued to improve in the northern part of the state but deteriorated in the south.
- Temperatures:
- Slightly cooler than average temperatures prevailed across Wyoming in the last 30 days with most of the state being less than 3ºF below average.
- Small pockets of the southeast saw mean temperatures over this period that were up to 3ºF above average.
72-Hour Precipitation Totals through June 14
For More Information
More local information is available from the following resources:
- Your state climatologist
- Your local National Weather Service office
- Western Water Assessment: Intermountain West Climate Dashboard
- Climate Assessment for the Southwest: Southwest Climate Outlook
In Case You Missed It
Upcoming Events
- July 21, 2022: 2022 Western Drought and Heat Webinar
Prepared By
Joel Lisonbee
NOAA/National Integrated Drought Information System (NIDIS)
Erin Saffell
Arizona State Climatologist/Arizona State University
Peter Goble
Colorado Climate Center/Colorado State University
Jon Meyer
Utah Climate Center/Utah State University
Tony Bergantino
Water Resources Data System – Wyoming State Climate Office
This drought status update is issued in partnership between the National Oceanic and Atmospheric Administration (NOAA), and the offices of the state climatologist for Arizona, Colorado, New Mexico, Utah and Wyoming. The purpose of the update is to communicate a potential area of concern for drought expansion and/or development within the Intermountain West based on recent conditions and the upcoming forecast. NIDIS and its partners will issue future drought status updates as conditions evolve.