




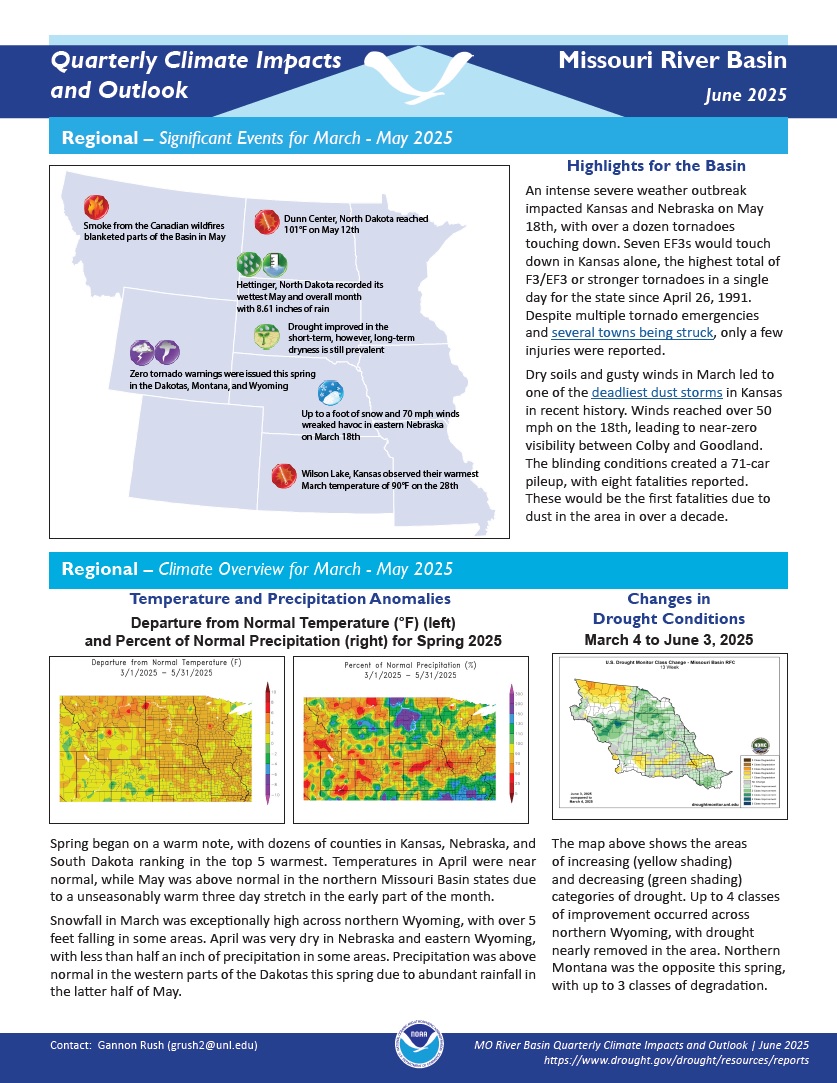
Quarterly Climate Impacts and Outlook for the Missouri River Basin for March–May 2025. Dated June 2025.
Spring began on a warm note, with dozens of counties in Kansas, Nebraska, and South Dakota ranking in the top 5 warmest. Precipitation was above normal in the western parts of the Dakotas this spring due to abundant rainfall in the latter half of May.
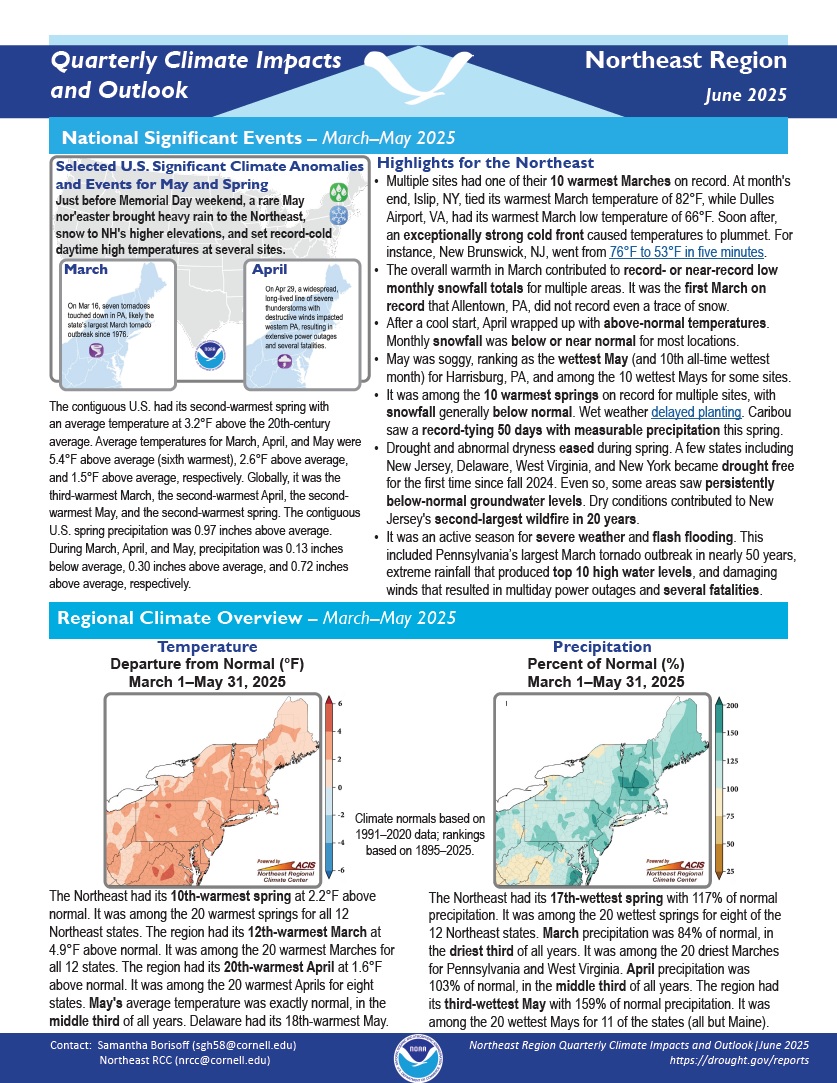
Quarterly Climate Impacts and Outlook for the Northeast Region for March–May 2025. Dated June 2025.
The Northeast had its 10th warmest spring on record at 2.2°F above normal. It was among the 20 warmest springs for all 12 Northeast states. The Northeast as a whole had its 17th wettest spring with 117% of normal precipitation. It was among the 20 wettest springs for 8 of the 12 Northeast states.
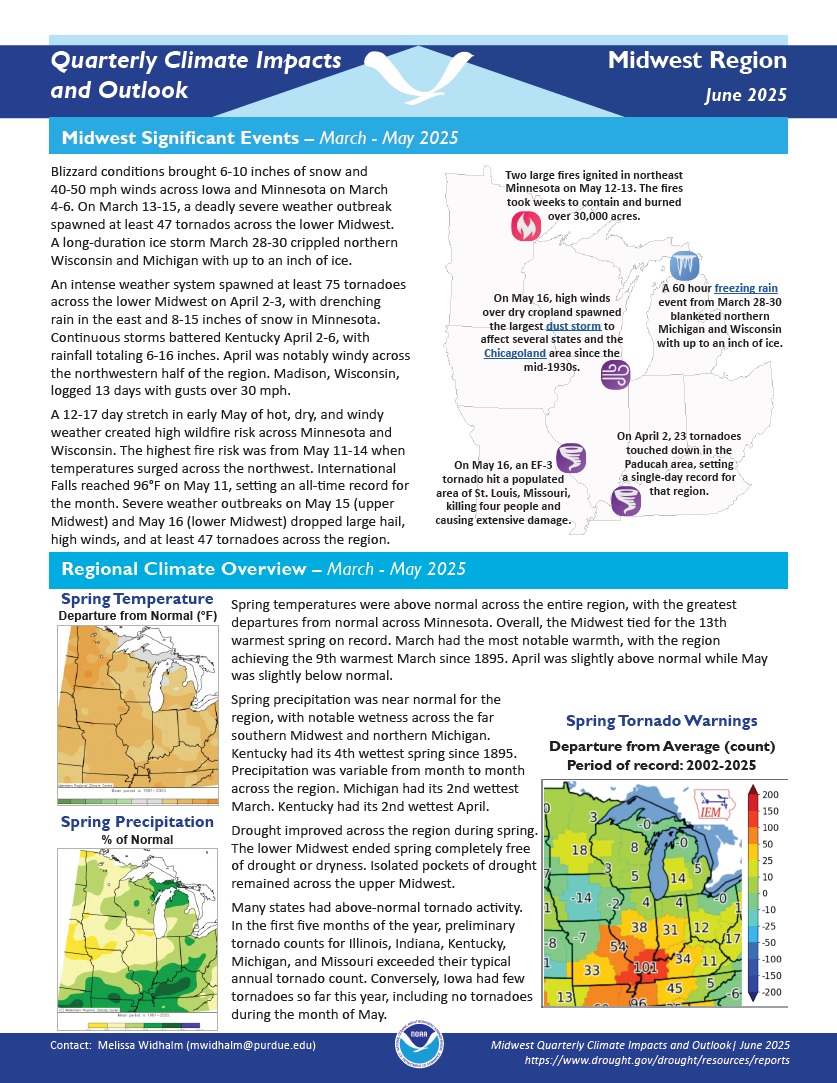
Quarterly Climate Impacts and Outlook for the Midwest Region for March–May 2025. Dated June 2025.
Spring temperatures were above normal across the entire region, with the greatest departures from normal across Minnesota. Overall, the Midwest tied for the 13th warmest spring on record. Spring precipitation was near normal for the region, with notable wetness across the far southern Midwest and northern Michigan. Kentucky had its 4th wettest spring since 1895.
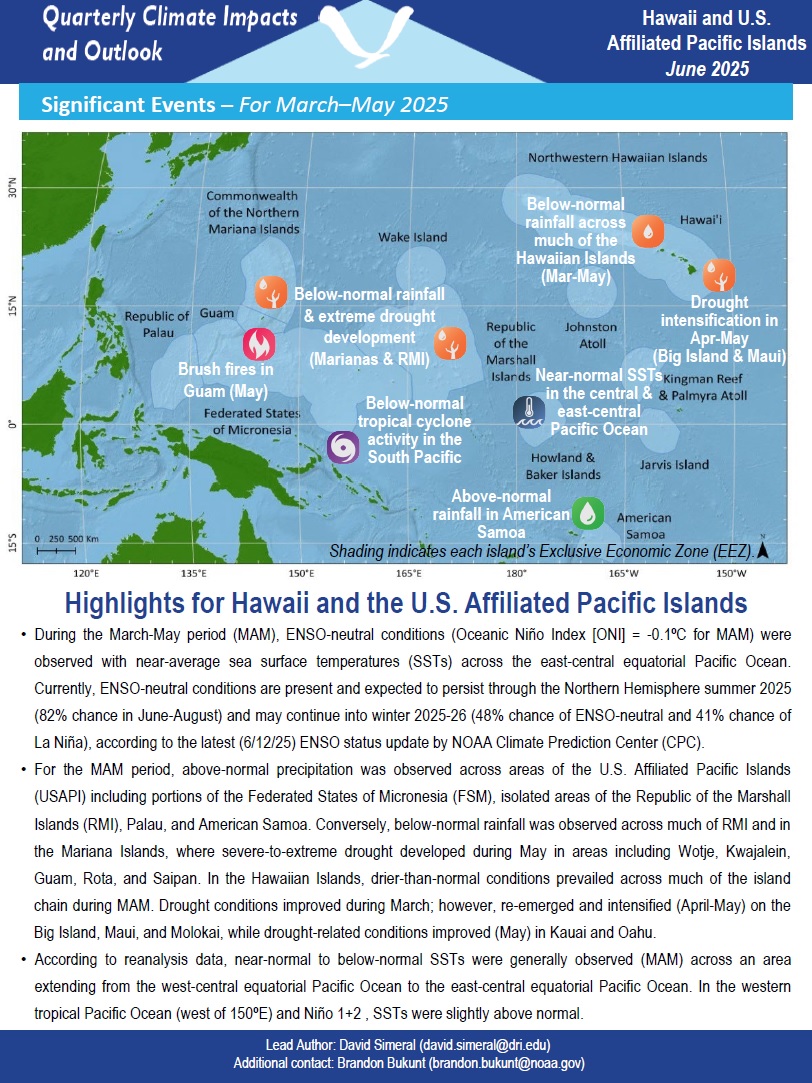
Quarterly Climate Impacts and Outlook for the Pacific Region for March–May 2025. Dated June 2025.
For the March-May period, above-normal precipitation was observed across areas of the U.S. Affiliated Pacific Islands (USAPI) including portions of the Federated States of Micronesia (FSM), isolated areas of the Republic of the Marshall Islands (RMI), Palau, and American Samoa. Conversely, below-normal rainfall was observed across much of RMI and in the Mariana Islands. In the Hawaiian Islands, drier-than-normal conditions prevailed across much of the island chain.
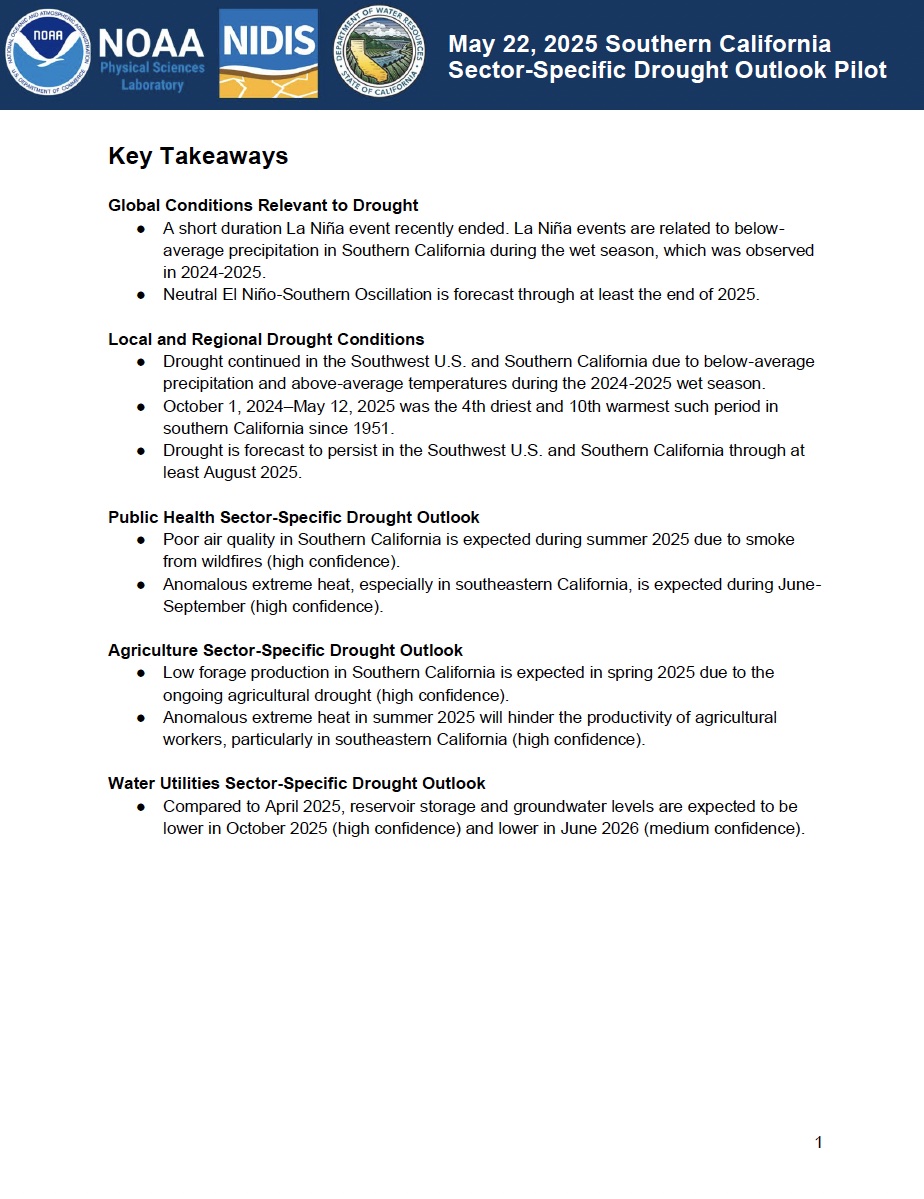
NOAA’s National Integrated Drought Information System (NIDIS) and Physical Sciences Laboratory are partnering with the California State Climatologist/California Department of Water Resources, NOAA’s National Weather Service and National Centers for Environmental Information, and the California-Nevada Adaptation Program (a NOAA CAP team) on the Sector-Specific Drought Early Warning Outlook – Southern California Pilot.
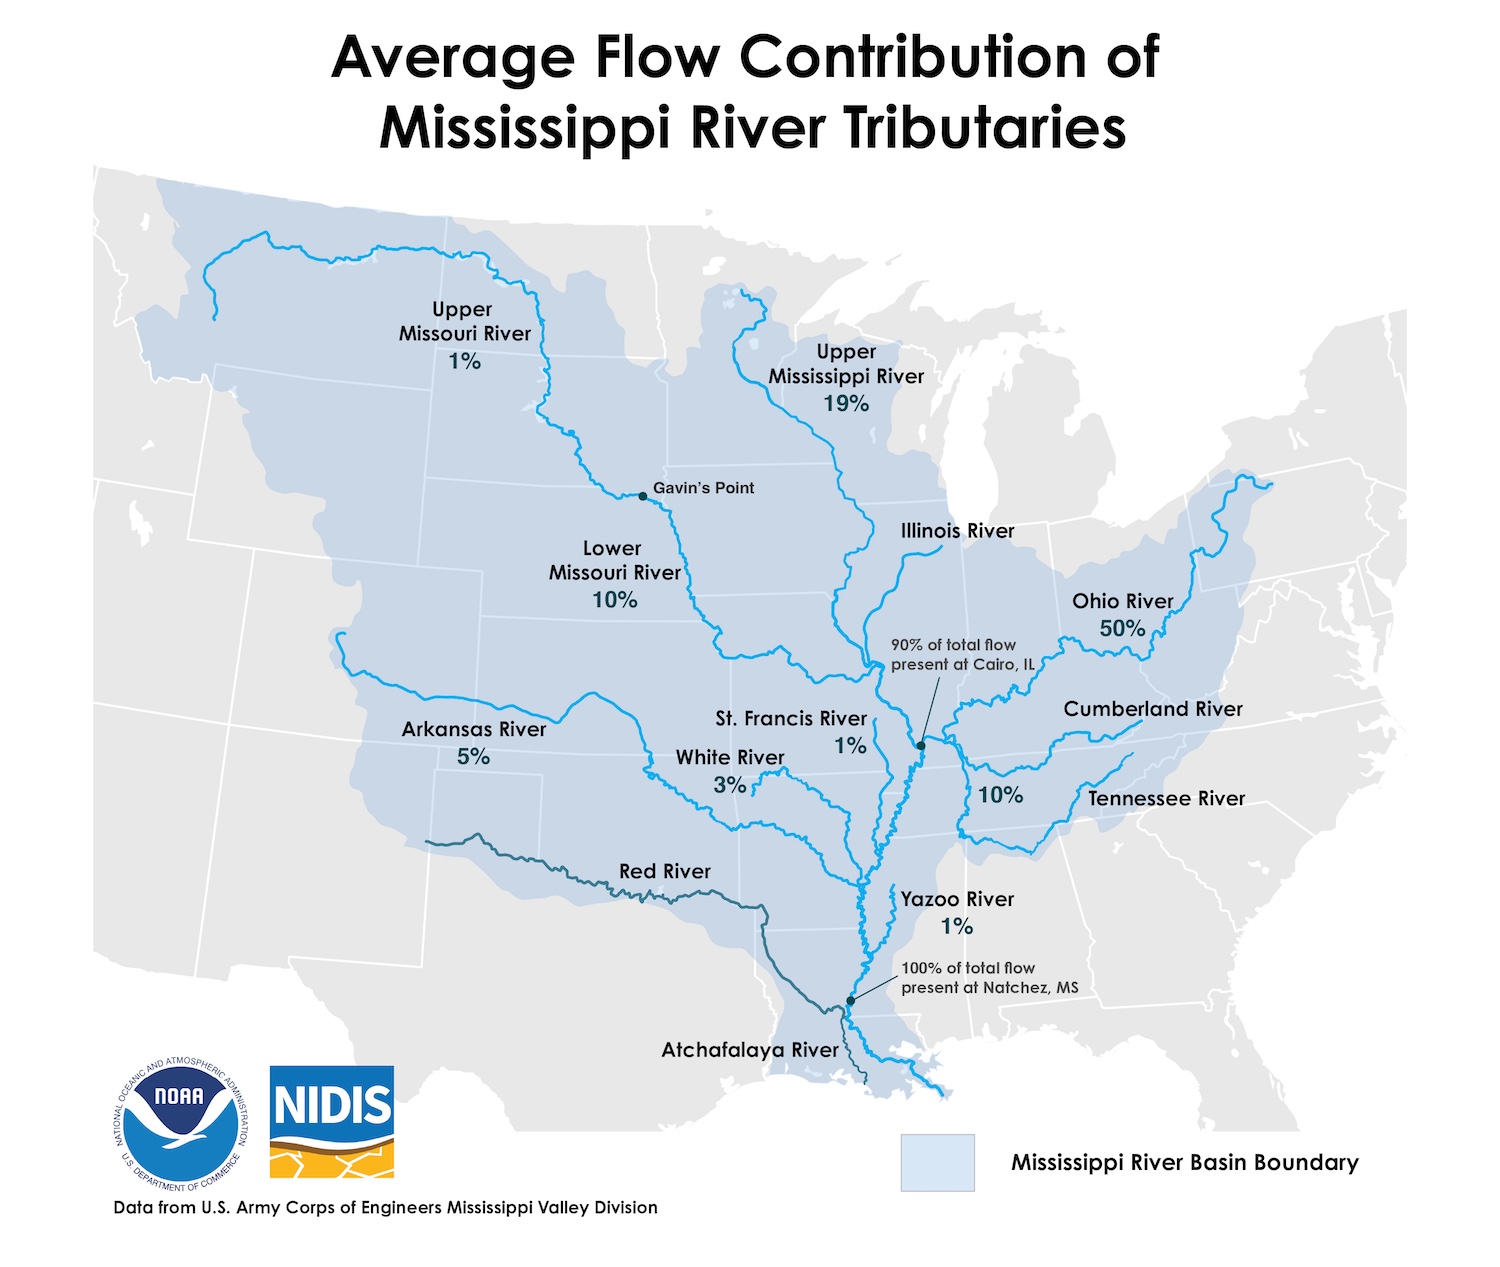
This graphic shows flow distribution across the Mississippi River Basin using data from the U.S. Army Corps of Engineers.
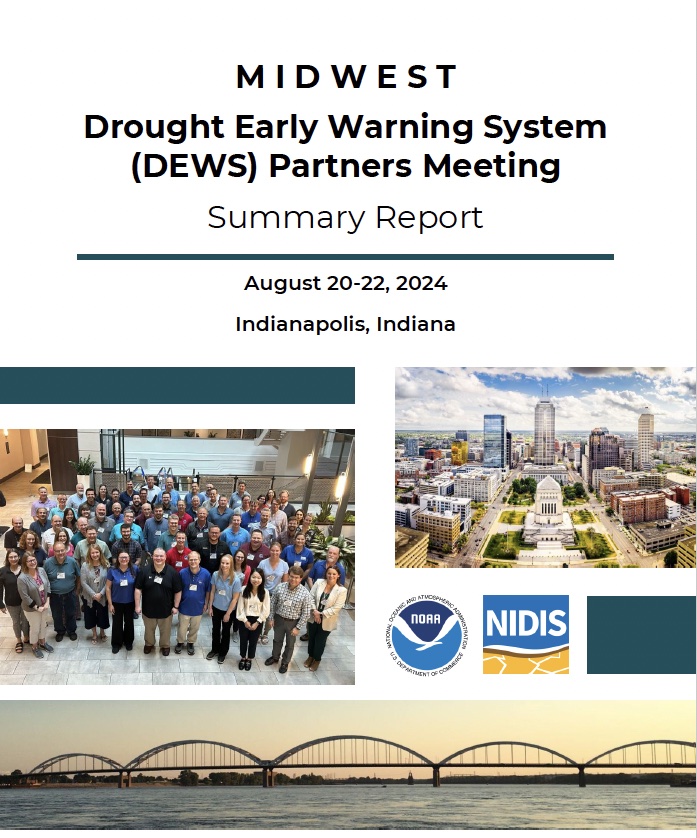
This report summarizes the ideas and thoughtful participation of speakers and attendees of the 2024 Midwest Drought Early Warning System (DEWS) Partners Meeting, held in Indianapolis, Indiana on August 20-22, 2024.
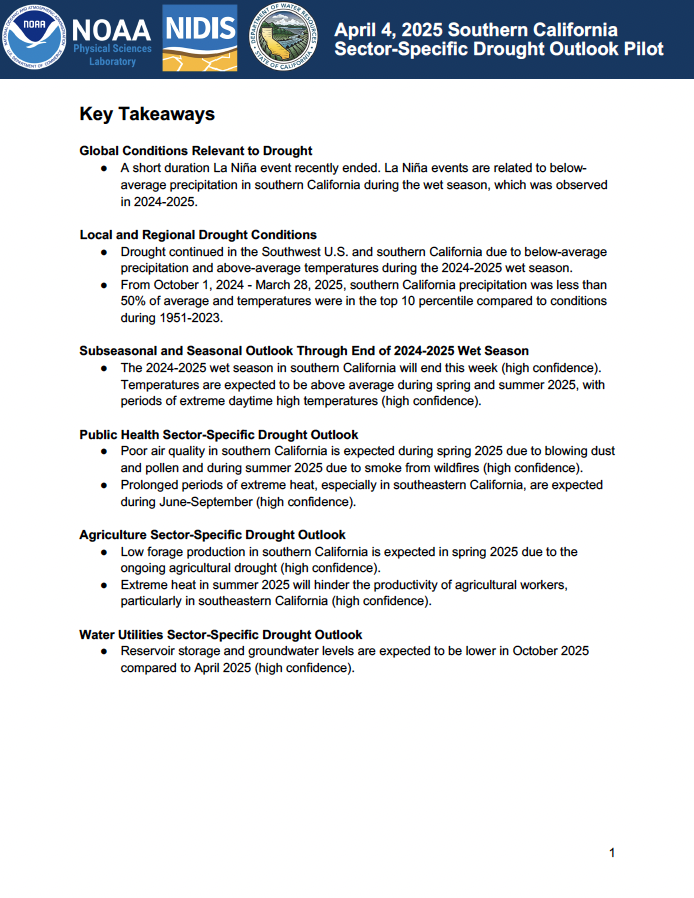
NOAA’s National Integrated Drought Information System (NIDIS) and Physical Sciences Laboratory are partnering with the California State Climatologist/California Department of Water Resources, NOAA’s National Weather Service and National Centers for Environmental Information, and the California-Nevada Adaptation Program (a NOAA CAP team) on the Sector-Specific Drought Early Warning Outlook – Southern California Pilot.
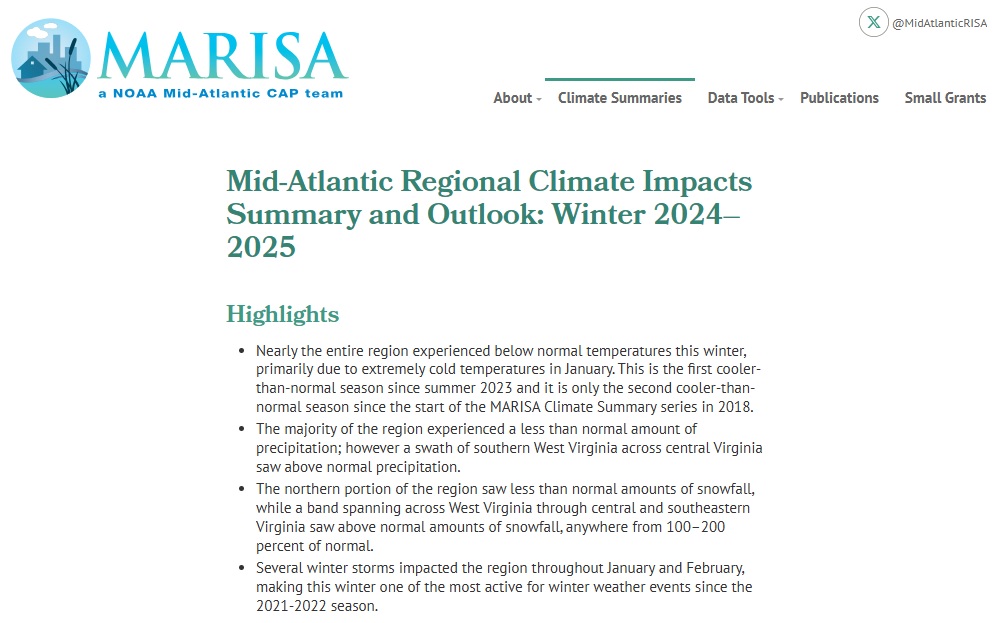
Quarterly Climate Impacts and Outlook for the Mid-Atlantic Region for December 2024–February 2025. Dated March 2025.
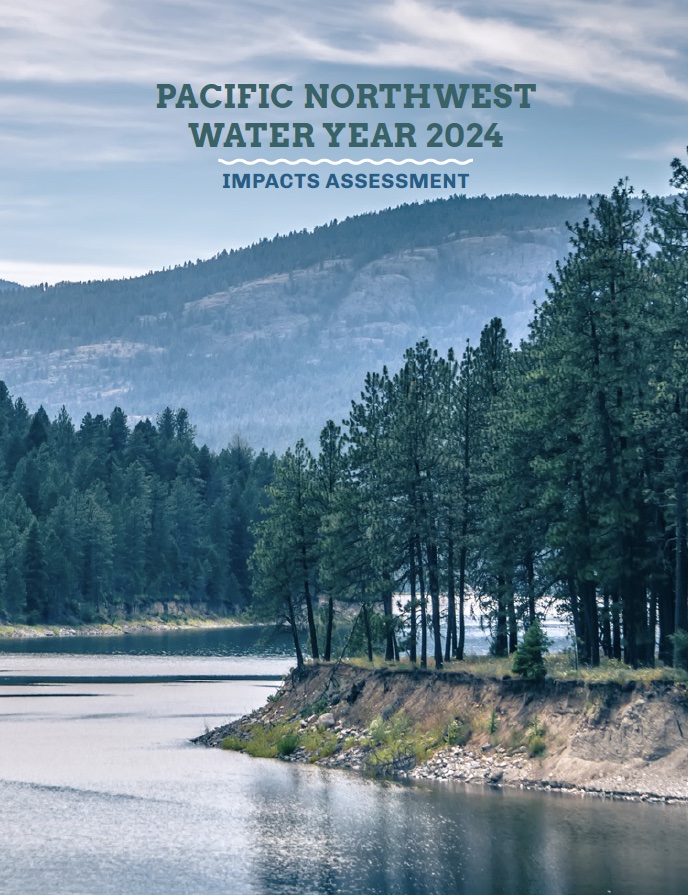
The purpose of the Pacific Northwest Water Year 2024 Impacts Assessment is to connect the water year conditions to sector-specific impacts to inform planning, response actions, and technical and scientific information needs. Ultimately, the assessment can be used as a resource for future management of drought and other climate extremes.