Year in Review: A Look Back at Drought across the United States in 2018
Drought is a normal part of our climate cycle. Often underestimated due to its slow onset, drought stands as the second most costly hazard in the United States. According to the U.S. Billion-Dollar Weather and Climate Disasters, generated at NOAA’s National Centers for Environmental Information (NCEI), 26 drought events between 1980 and 2018 caused specific losses over $1.0 Billion, resulting in $244.3 Billion in direct damages from those events alone. This does not include numerous drought events with losses under $1 Billion as well as indirect impact of drought to the economy. Second only to tropical cyclones, drought affects agriculture, water supply, energy, wildlife, public health, and has many other economic, environmental, and social impacts.
Based on preliminary analysis within the National Climate Report - Annual 2018, produced by NCEI, 2018 ranks as the 14th warmest and 3rd wettest year on record (1895-2018). Even with the above-average precipitation observed, much of the nation, primarily in the Southwest and Southern Plains, experienced persistent and severe drought conditions. Using data from the 52 weekly U.S. Drought Monitor (USDM) maps published during 2018, NCEI generated annual maps to provide a snapshot of drought in the U.S. during the year.
The USDM is a weekly map jointly produced by the National Oceanic and Atmospheric Administration, the United States Department of Agriculture, and the National Drought Mitigation Center. The weekly maps are based on measurements of climatic, hydrologic and soil conditions as well as reported impacts and observations from more than 350 contributors around the U.S.
2018 Summary Maps
The following three graphics each provide a snapshot of U.S. drought during 2018, from three slightly different perspectives. These maps can also be found in the Annual 2018 Report.
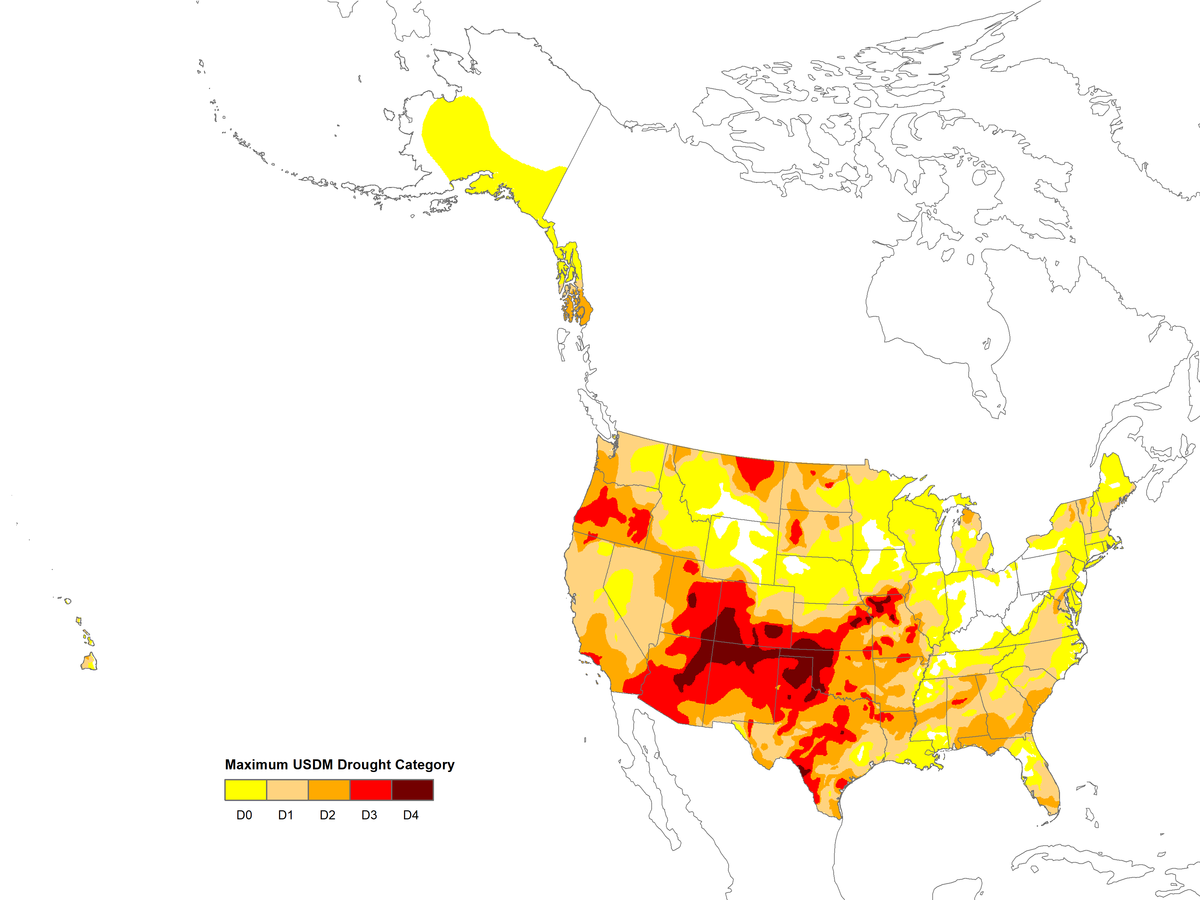
2018 Most Intense Drought
This map displays the most intense weekly USDM classification for locations across the United States, regardless of when the designation occurred.
2018 Weeks in Drought
This map shows the number of weeks, throughout the year, a location experienced drought, defined as USDM category “D1 – Moderate Drought” or greater, across the United States.
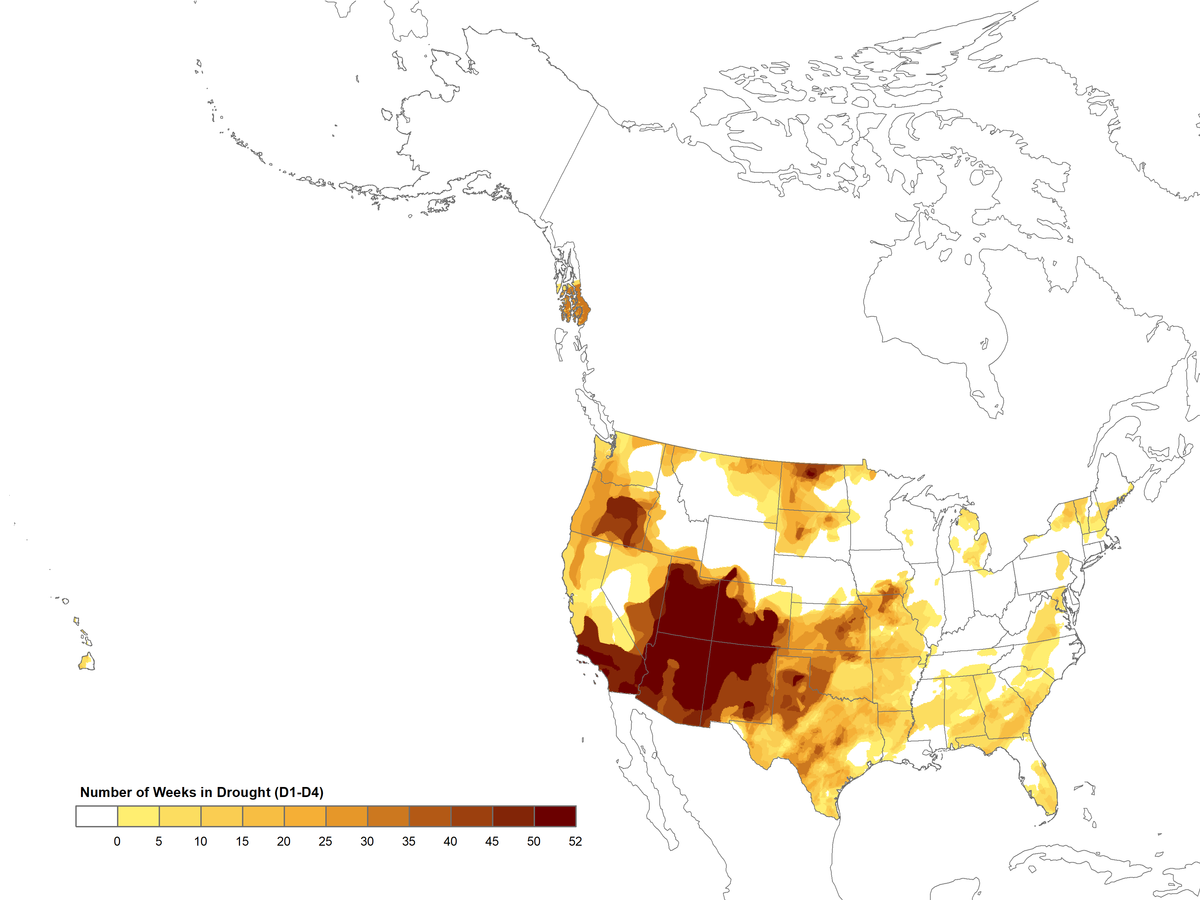
Fig 2. Map displays the number of weeks during 2018 the U.S. experienced USDM Category D1 or greater
2018 Cumulative Drought Intensity
This map combines the intensity and duration of drought, tabulated over the course of the year. It is calculated by multiplying the USDM category (D0=0, D1=1, D2=2, D3=3, & D4=4) by the number of weeks designated in that category. For example, a location in D2 drought for 20 weeks and D1 drought for 5 weeks equals a cumulative intensity of 45 (20x2 plus 5x1). The maximum value possible is 208 (52x4). Note: this is not an official or widely-adopted product
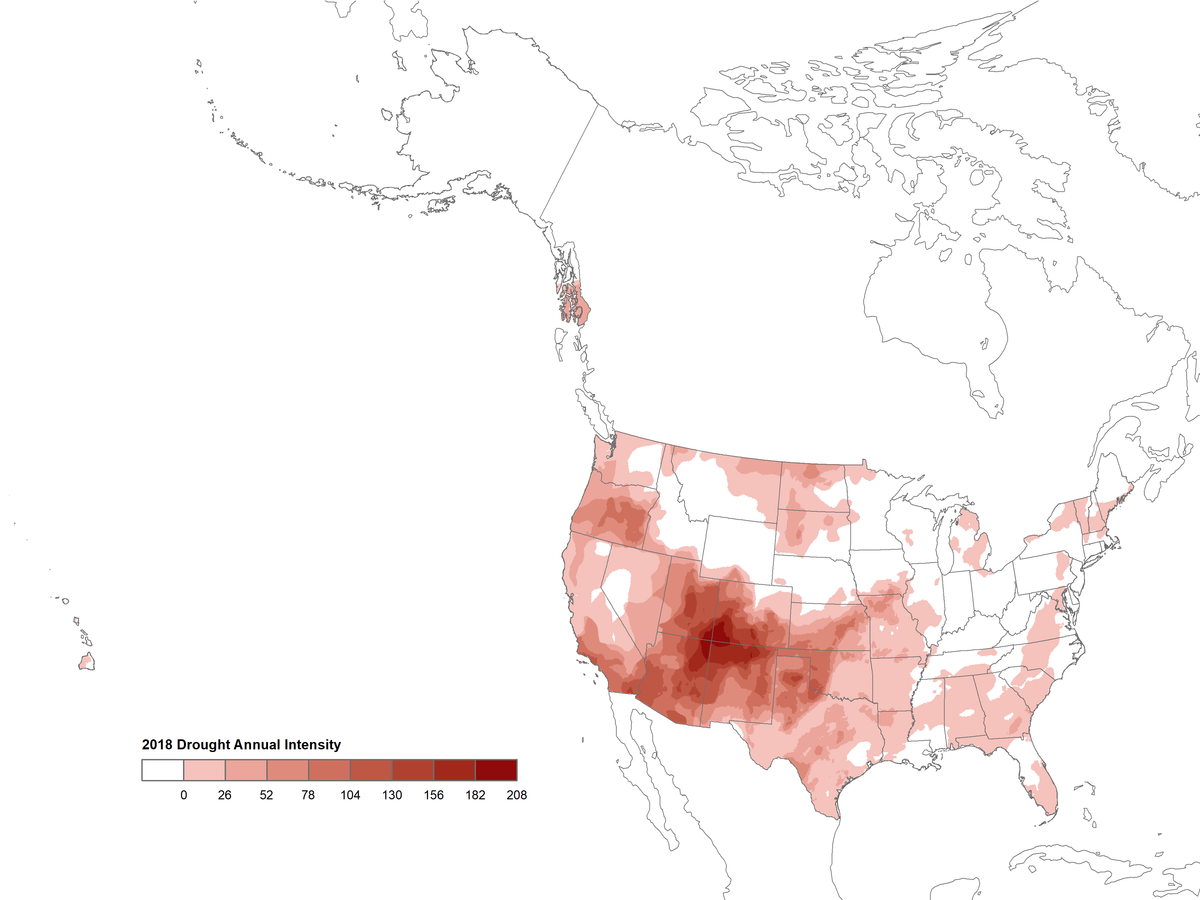
Fig 3. Map displays the cumulative drought intensity, a combination of drought intensity and duration, during 2018
*Note: 2018 Cumulative Drought Intensity product uses a similar methodology to the Cumulative Drought Severity Index (CDSI), however the input data source is the USDM instead of the Palmer Drought Severity Index, please see citations below:
- Peters, M. P., L. R. Iverson and S. N. Matthews (2015). Long-term droughtiness and drought tolerance of eastern US forests over five decades. Forest Ecology and Management 345: 56-64.
- Clark, J. S., L. Iverson and C. W. Woodall (2016). Impacts of Increasing Drought on Forest Dynamics, Structure, Diversity, and Management. In: Vose, J. M. C., J.S.; Luce, C.H.; Patel-Weynand, T., eds, eds. Jan. Effects of drought on forests and rangelands in the United States: a comprehensive science synthesis. Gen. Tech. Rep. WO-93b. Washington, DC: U.S. Department of Agriculture, Forest Service, Washington Office. 59-96 p
- Clark, J. S., L. Iverson, C. W. Woodall, C. D. Allen, D. M. Bell, et al. (2016). The impacts of increasing drought on forest dynamics, structure, and biodiversity in the United States. Global Change Biology 22(7): 2329-2352.
- Matthews, S. N., L. R. Iverson, M. P. Peters and A. Prasad (2018). Assessing potential climate change pressures across the conterminous United States: mapping plant hardiness zones, heat zones, growing degree days, and cumulative drought severity throughout this century. Res. Map NRS-9. Newtown Square, PA: U.S. Department of Agriculture, Forest Service, Northern Research Station. 31 p. doi: 10.2737/NRS-RMAP-9