ERA5: Drought Indices
Copernicus Climate Change Service (C3S) at European Centre for Medium-Range Weather Forecasts (ECMWF)
ERA5 is the fifth generation ECMWF atmospheric reanalysis of the global climate covering the period from January 1940 to present. ERA5 is produced by the Copernicus Climate Change Service (C3S) at ECMWF.
SPI
The Standardized Precipitation Index, or SPI, is a drought index that captures how observed precipitation deviates from the climatological average over a given time period. This global SPI is derived from the ECMWF ERA5 dataset, using the Climate Engine tool, and includes timescales of 1, 2, 3, 6, 9 and 12 months.
SPEI
The Standardized Precipitation Evapotranspiration Index (SPEI) is derived from the ECMWF ERA5 dataset, using the Climate Engine tool, and includes timescales of 1, 2, 3, 6, 9, and 12 months.
EDDI
The Evaporative Demand Drought Index (EDDI) is an experimental tool that examines how anomalous the atmospheric evaporative demand (E0; also known as "the thirst of the atmosphere") is for a given location and across a time period of interest. This global EDDI is derived from the ECMWF ERA5 dataset, using the Climate Engine tool, a 1991–2020 reference period, nonparametric distribution, and Penman-Monteith PET (potential evapotranspiration). The timescales included are 1 and 2 weeks, as well as 1, 2, 3, 6, 9, and 12 months.
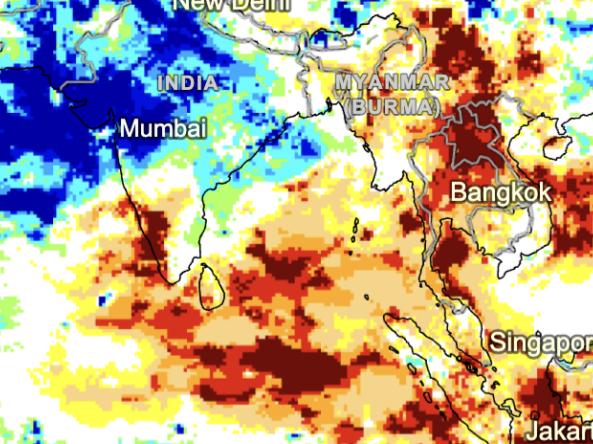
ERA5 SPEI
Dry Conditions
D4 (-2.0 or less)
The Standardized Precipitation Evapotranspiration Index (SPEI) value for this location is -2.0 or less, indicating exceptional drought (D4) conditions.
D3 (-1.9 to -1.6)
The Standardized Precipitation Evapotranspiration Index (SPEI) value for this location is between -1.9 to -1.6, indicating extreme drought (D3) conditions.
D2 (-1.5 to -1.3)
The Standardized Precipitation Evapotranspiration Index (SPEI) value for this location is between -1.5 to -1.3, indicating severe drought (D2) conditions.
D1 (-1.2 to -0.8)
The Standardized Precipitation Evapotranspiration Index (SPEI) value for this location is between -1.2 to -0.8, indicating moderate drought (D1) conditions.
D0 (-0.7 to -0.5)
The Standardized Precipitation Evapotranspiration Index (SPEI) value for this location is between -0.7 to -0.5, indicating abnormally dry (D0) conditions.
Wet Conditions
W0 (0.5 to 0.7)
The Standardized Precipitation Evapotranspiration Index (SPEI) value for this location is between 0.5 to 0.7, indicating abnormally wet (W0) conditions.
W1 (0.8 to 1.2)
The Standardized Precipitation Evapotranspiration Index (SPEI) value for this location is between 0.8 to 1.2, indicating moderate wet (W1) conditions.
W2 (1.3 to 1.5)
The Standardized Precipitation Evapotranspiration Index (SPEI) value for this location is between 1.3 to 1.5, indicating severe wet (W2) conditions.
W3 (1.6 to 1.9)
The Standardized Precipitation Evapotranspiration Index (SPEI) value for this location is between 1.6 to 1.9, indicating extreme wet (W3) conditions.
W4 (2.0 or more)
The Standardized Precipitation Evapotranspiration Index (SPEI) value for this location is 2.0 or greater, indicating exceptional wet (W4) conditions.
The Standardized Precipitation Evapotranspiration Index (SPEI) uses the basis of SPI but includes a temperature component, allowing the index to account for the effect of temperature on drought development through a basic water balance calculation.
The Drought.gov team produces this EDDI product with the Climate Engine tool and the ERA5 dataset, using a 1991-2020 reference period, nonparametric distribution and Hargreaves PET.
ERA5 is the fifth generation ECMWF atmospheric reanalysis of the global climate. Reanalysis combines model data with observations from across the world into a globally complete and consistent dataset.
The Standardized Precipitation Evapotranspiration Index (SPEI) uses the basis of SPI but includes a temperature component, allowing the index to account for the effect of temperature on drought development through a basic water balance calculation.
The Drought.gov team produces this SPEI product with the Climate Engine tool and the ERA5-Land dataset, using a 1991-2020 reference period, nonparametric distribution and Hargreaves PET.
ERA5 is the fifth generation ECMWF atmospheric reanalysis of the global climate. Reanalysis combines model data with observations from across the world into a globally complete and consistent dataset.
This map updates daily with data from Google Earth Engine's (ERA5-Land Daily Aggregated) dataset.
This map updates daily with data from Google Earth Engine's (ERA5-Land Daily Aggregated) dataset.
This map updates daily with data from Google Earth Engine's (ERA5-Land Daily Aggregated) dataset.
This map updates daily with data from Google Earth Engine's (ERA5-Land Daily Aggregated) dataset.
This map updates daily with data from Google Earth Engine's (ERA5-Land Daily Aggregated) dataset.
This map updates daily with data from Google Earth Engine's (ERA5-Land Daily Aggregated) dataset.
Access
- ECWMF ERA5 Website
- Data Download
- ERA5 on Climate Engine
- Google Earth Engine Catalog: ERA5 Info (ECMWF/ERA5/DAILY)
Documentation
- ERA5 Data Documentation
- Hersbach, et al. 2020. The ERA5 global reanalysis, Quarterly Journal of the Royal Meteorological Society 146(730), 1999–2049. https://doi.org/10.1002/qj.3803
- Bell, et al. 2021. The ERA5 global reanalysis: Preliminary extension to 1950, Quarterly Journal of the Royal Meteorological Society 147(741), 4186–4227. https://doi.org/10.1002/qj.4174
- Copernicus Climate Change Service (C3S). 2017. ERA5: Fifth generation of ECMWF atmospheric reanalyses of the global climate. Copernicus Climate Change Service Climate Data Store (CDS), https://cds.climate.copernicus.eu/cdsapp#!/home