Multi-Indicator Drought Index (MIDI)
University of California, Merced and the Desert Research Institute
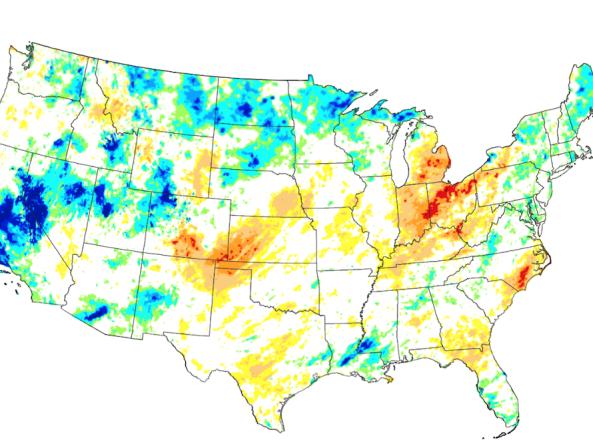
The Multi-Indicator Drought Index (MIDI) estimates current drought conditions across the U.S. by integrating several key drought monitoring indices into a single objective, computer-generated map. This experimental drought map is based on the methodology developed at the NOAA National Weather Service's Climate Prediction Center.
The short-term MIDI combines short-term indicators of drought—the Palmer Drought Severity Index (PDSI), Z-Index, 1-month Standardized Precipitation Index (SPI), and 3-month SPI—to approximate current drought impacts from changes in precipitation and moisture.
The long-term MIDI combines longer-term indicators of drought—PDSI, Z-Index, and 6-month, 1-year, 2-year, and 5-year SPI—to approximate current drought impacts from changes in precipitation and moisture.
The short- and long-term MIDI products are created using the Climate Engine tool, and apply the Climate Prediction Center's weighting ratios to the high-resolution gridMET gridded dataset (with a reference period of 1979–present). The data are updated every 5 days, with a delay of 4 to 5 days to allow for data collection and quality control.
The Multi-Indicator Drought Index is the result of NIDIS-funded research.
Access
Drought.gov Current Conditions: View the short- and long-term MIDI on the U.S. Drought Portal.
Climate Engine: Access the short- and long-term MIDI within Climate Engine.
Download Map Tiles from Drought.gov:
- Long-Term MIDI, Pentad - XYZ tiles
- Short-Term MIDI, Pentad - XYZ tiles
- To download map tiles from the public endpoint in Google Cloud Storage, replace 'https://www.ncei.noaa.gov/pub/data/nidis/tile/' with 'https://storage.googleapis.com/noaa-nidis-drought-gov-data/current-conditions/tile/v1/' in the specific file download URL.
How To
To access the short-term and long-term Multi-Indicator Drought Index (MIDI) in Climate Engine:
- In the "Type" dropdown, select "Climate and Hydrology"
- In the "Dataset" dropdown, select "gridMET Drought"
- In the "Variable" dropdown, select either "Short-Term Drought Blend" or "Long-Term Drought Blend"
- Select the end date for the time period you'd like to view
- Click "Get Map Layer"
Documentation
A blend of different drought indices for short- and long-term time scales can be useful to understand short- and long-term drought for a region. The experimental short- and long-term objective blends produced by the National Weather Service's Climate Prediction Center (CPC) are an example of blends being produced as a weighting of percentiles for different drought metrics from past data where the weights are based on expert judgment from drought experts.
The Multi-Indicator Drought Index (MIDI) products are instead produced through Climate Engine as a weighting of standardized indices for the same drought metrics.
The metrics that go into the experimental CPC blend are:
- Palmer-Z Index (Z)
- Palmer Drought Severity Index (PDSI)
- Standardized Precipitation Index (SPI): 30-day, 90-day, 180-day, 1-year, 2-year, and 5-year
- Palmer Hydrological Drought Index (PDHI)
- Soil Moisture from NOAH (SM-NOAH)
The MIDI uses a weighting of the standardized indices coming from drought indices calculated from the gridMET data product (also in Climate Engine and based on a reference period of 1979–present). The weightings are based on the experimental CPC blends with some differences:
- The weightings for SM-NOAH (soil moisture from NOAH) and PHDI (Palmer Hydrological Drought Index) are added in with the weights for PDSI. Only PDSI is used in the MIDI construction to represent soil moisture.
- In the MIDI, the Palmer drought indices (i.e., Z and PDSI) are divided by two to put them on roughly the same scale as the standardized indices.
- The colors and bins used to visualize the MIDI will be the U.S. Drought monitor colors with non-linear standardized index bins.
Here are the precise details of the construction of the Multi-Indicator Drought Index products:
Short-Term MIDI= 0.2 *(PDSI/2) + 0.2 * SPI30d + 0.25 * SPI90d + 0.35 * (Z/2)
where
- PDSI = Palmer Drought Severity Index
- Z = Palmer's Z-Index
- SPI30d = 30-day Standardized Precipitation Index (SPI)
- SPI90d = 90-day Standardized Precipitation Index (SPI)
Long-Term MIDI= 0.35 *(PDSI/2) + 0.15 * SPI180d + 0.2 * SPI1y + 0.2 *SPI2y + 0.1 * SPI5y
where
- PDSI = Palmer Drought Severity Index
- SPI180d = 180-day Standardized Precipitation Index (SPI)
- SPI1y = 1-year Standardized Precipitation Index (SPI)
- SPI2y = 2-year Standardized Precipitation Index (SPI)
- SPI5y = 5-year Standardized Precipitation Index (SPI)
Related Products and Research
The Multi-Indicator Drought Index (MIDI) is one of several efforts in the drought science community to combine multiple indices into an objective blended dataset, and showcase a unique methodology in utilizing the cloud to efficiently and flexibly generate blended products.
The Climate Prediction Center has produced their experimental blends product based on CPC Climate Division data for over 10 years.
The National Drought Mitigation Center has developed a new generation of objective blends using Principle Component Analysis to determine the weighting factors.
NIDIS is also funding research by NASA to determine the weighting factors through the use of machine learning analysis trained on the U.S. Drought Monitor as an automated method to reproduce the weights typically given by the U.S. Drought Monitor authors through their convergence of evidence approach.
These approaches are not meant to replace the U.S. Drought Monitor, but rather to develop enhanced information for the authors to use in their weekly analysis, as well as developing a framework to explore other types of blends optimized for various sectors and types of drought.