Widespread severe drought at the end of the water year leaves challenges ahead.
Register here for the September 27 California–Nevada Drought and Climate Outlook Webinar.
Key Points
- After 2 water years of dry conditions, both California and Nevada remain 100% in moderate-to-exceptional drought.
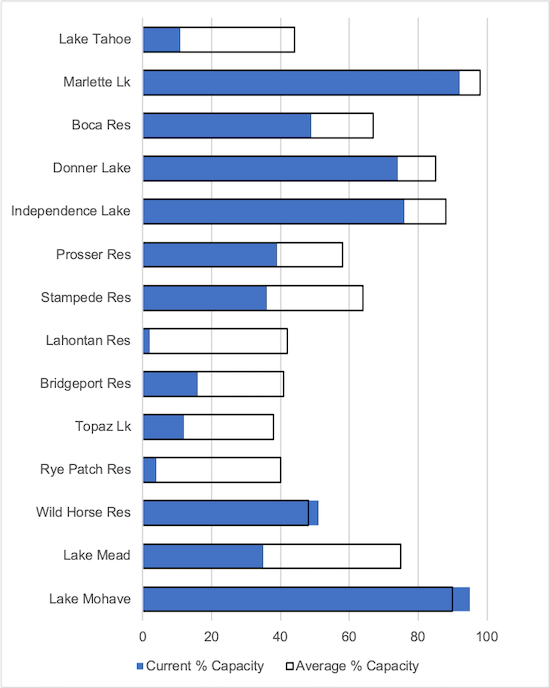
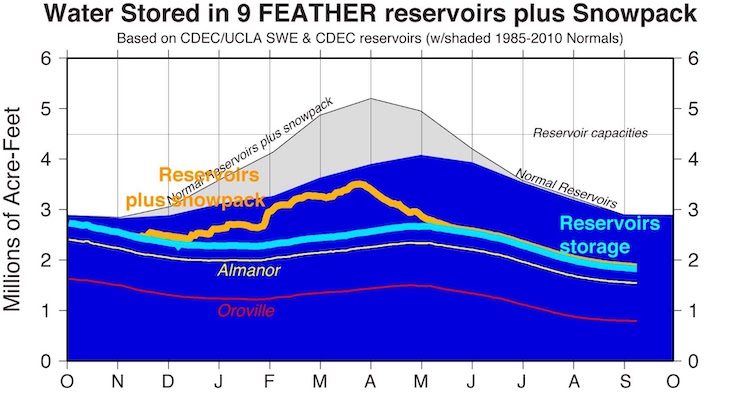
- Reservoirs throughout California and Nevada remain low, though the total combined reservoir storage is not as low as during the peak of the 2012-2016 California drought.
- Evaporative demand during this water year has been the highest in much of the region since 1980, increasing drying and wildfire risk. Most of the region experienced record temperatures this summer.
- Forecasts increasingly reflect the potential for La Niña development in the fall and into the winter. Historically, La Niña is associated with dry to normal conditions in the southern part of California and Nevada.
- Drought impacts (e.g., pasture conditions, ecosystem health, water supply, recreation, fire potential) have intensified and expanded given back-to-back dry years. Drought preparedness is key.
The U.S. Drought Monitor (USDM) is updated each Thursday to show the location and intensity of drought across the country. Drought categories show experts’ assessments of conditions related to dryness and drought including observations of how much water is available in streams, lakes, and soils compared to usual for the same time of year.
California/Nevada conditions as of September 14, 2021:
- 100% of California is experiencing Moderate (D1) to Exceptional (D4) Drought (42.28% in D3, 45.66% in D4)
- California population in drought: 37,253,956
- 100% of Nevada is experiencing Moderate (D1) to Exceptional (D4) Drought (41.67% in D3, 25.93% in D4)
- Nevada population in drought: 2,700,551
U.S. Drought Monitor Categories
The U.S. Drought Monitor (USDM) is updated each Thursday to show the location and intensity of drought across the country. Drought categories show experts’ assessments of conditions related to dryness and drought including observations of how much water is available in streams, lakes, and soils compared to usual for the same time of year.
California/Nevada conditions as of September 14, 2021:
- 100% of California is experiencing Moderate (D1) to Exceptional (D4) Drought (42.28% in D3, 45.66% in D4)
- California population in drought: 37,253,956
- 100% of Nevada is experiencing Moderate (D1) to Exceptional (D4) Drought (41.67% in D3, 25.93% in D4)
- Nevada population in drought: 2,700,551
Current Conditions
- According to the U.S. Drought Monitor, over the last 4 weeks drought conditions continued with some minor improvement in parts of far southern California and Nevada. The region continues to be 100% in drought, compared to ~80% this time last year.
- Reservoirs throughout California and Nevada remain low. Much of California-Nevada experienced record June through August temperatures, compounding high soil moisture deficits and vegetation stress.
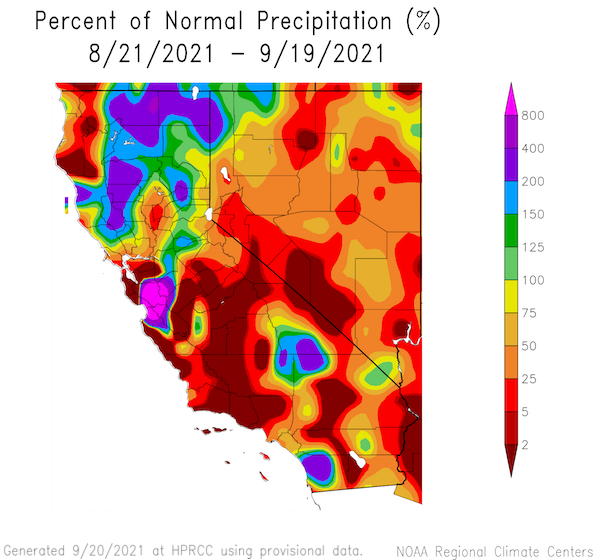
- Northern California and Nevada recently received some light rain from an atmospheric river that made landfall in Oregon. Northern California received the highest rainfall totals of ~2 inches.
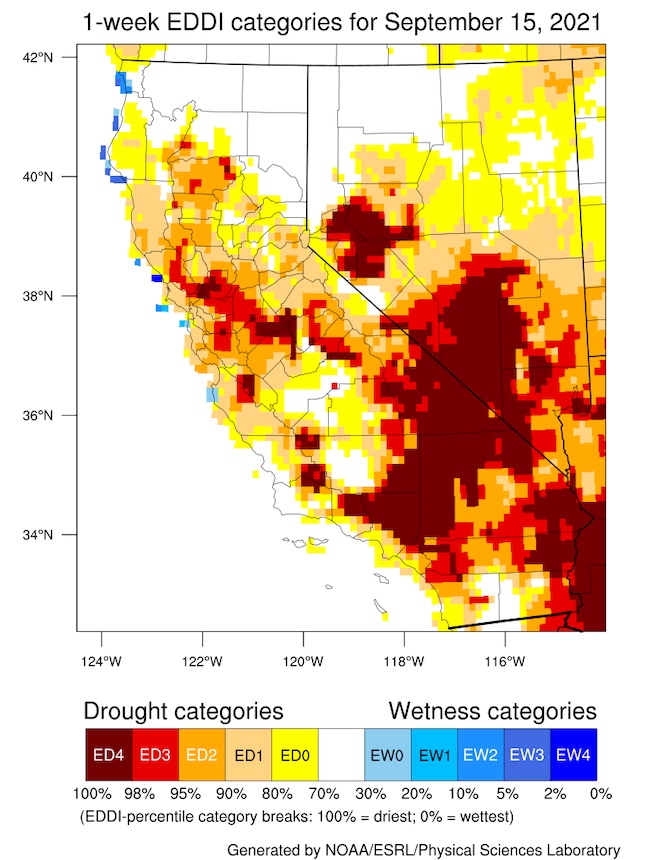
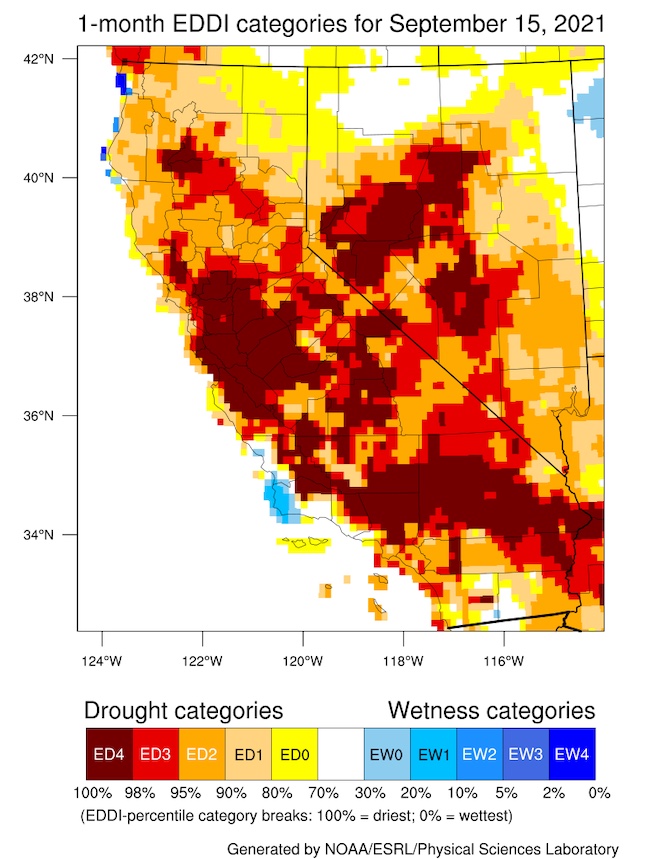
- The current drought is a combination of a precipitation deficit and a surplus of evaporative demand (the atmospheric conditions leading to the drying of the landscape). For much of California, the 2021 summer and water year have had the highest evaporative demand in the last 40 years.
- As of September 20, more than 2.3 million acres have burned in California, causing recent evacuations of South Lake Tahoe and closure of Sequoia and Kings Canyon National Parks. By contrast, around 120 thousand acres have burned in Nevada so far this year, well below recent averages. In late August, the Caldor and DIxie fires became the first to burn from one side of the Sierra to the other.
- For more detailed information on Nevada from the State Climatologist, check out the Nevada Drought Update.
How Is Drought Affecting Your Neighborhood?
Click to see drought indicators, outlooks, and historical conditions by city, county, and state, and to sign up for U.S. Drought Monitor alert emails.
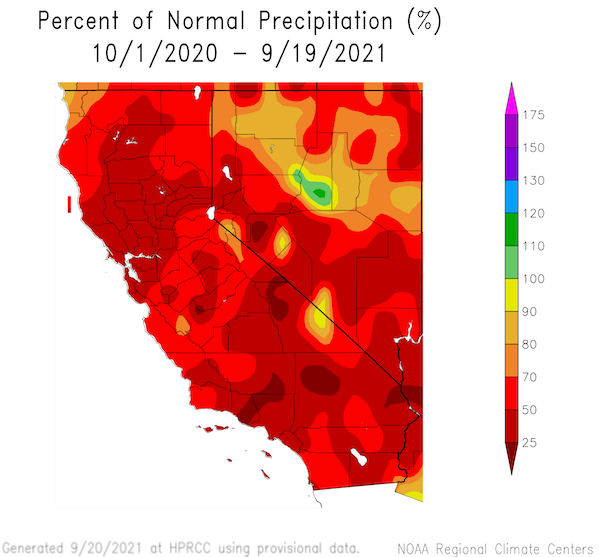
Percent of Normal Precipitation: Last 30 Days and Water Year to Date
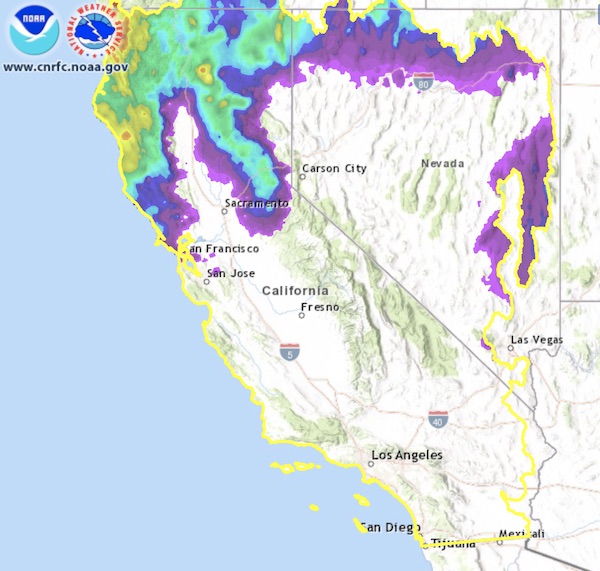
72-Hour Precipitation Totals: September 18–20, 2021
California-Nevada June–August Temperature Rankings
Evaporative Demand Rankings: 2021 Summer and Water Year
Nevada Reservoir Conditions
Water Storage + Snowpack in Feather Reservoirs
Evaporative Demand Drought Index (EDDI)
Recent Drought Impacts
- Find additional impacts through the National Drought Mitigation Center's Drought Impact Reporter.
- Condition Monitoring Observer Reports (CMOR) over the past few weeks highlight less water for irrigation, reduced yield, plant stress, reduced pasture and forage and grazing, hay purchases, more intense fires and risk and accompanying smoke.
- Earlier this month, California lawmakers voted to spend more than $2 billion to prevent wildfires and address the severe drought.
Water Supply
- Dry and failing wells in Tuolumne County, California are instigating drought response measures, including tracking, sharing available resources, and extending an existing local state of emergency proclamation due to drought conditions.
- Reports of the cost of water this year are $2,000–$2,500/acre-foot compared to ~$250/acre-foot in the Central Valley.
- On September 16, the California State Water Board pre-approved a health and human safety exemption allowing the city of Ukiah to provide emergency supplies.
Agriculture
- In Nevada, ranches are bringing back livestock to ranches instead of grazing them on federal land. The Carson River is approaching 1977 and 2015 levels.
- Wine grape growers are beginning to worry about next year as dry soils since the start of this growing season could limit crop capacity next year.
- In California, there are reports of illegal marijuana growers depleting groundwater and surface water resources.
- Lack of Central Valley produce at farmers markets is having a ripple effect on restaurant menus and food supplies.
Wildfire
- As of September 20, the KNP Complex is at 23,743 acres, based on infrared flight, and 0% contained. Kings Canyon National Park is now largely closed, and the Sequoia National Park closure is still in effect.
Wildlife & Ecosystems
- Wildlife continues to be challenged, such as by low seasonal wetlands and pools, fisheries, and food supplies.
- Conditions are causing large pre-spawn Chinook salmon mortalities, and may impact winter run just as severely.
- The California State Water Resources Control Board Harmful Algal Bloom incident reports map show several danger and warning advisories across California.
- The California Department of Fish and Wildlife has announced that the Shasta Valley Wildlife Area will be closed to waterfowl hunting for the entirety of the 2021–22 season as a result of lost wetlands and waterfowl habitat due to drought conditions.
Other Impacts
- The Department of Energy approved the California request for additional natural gas generation to compensate for projected shortfalls in power supply.
- Following the last drought, the San Francisco Giants have made changes to reduce water use, including reducing pressure washing frequency and weather smart field irrigation.
- Butte County Mosquito Control reports widespread West Nile Virus.
Report Your Drought Impacts
Drought and Climate Outlook
El Niño/Southern Oscillation (ENSO)
NOAA’s ENSO alert system status is currently a La Niña Watch.
A transition from ENSO-neutral to La Niña is favored in the next couple of months, with a 70%–80% chance of La Niña during the Northern Hemisphere winter 2021–22. For more information, please check out the NOAA ENSO blog.
Subseasonal to Seasonal Drought, Temperature, and Precipitation Outlooks
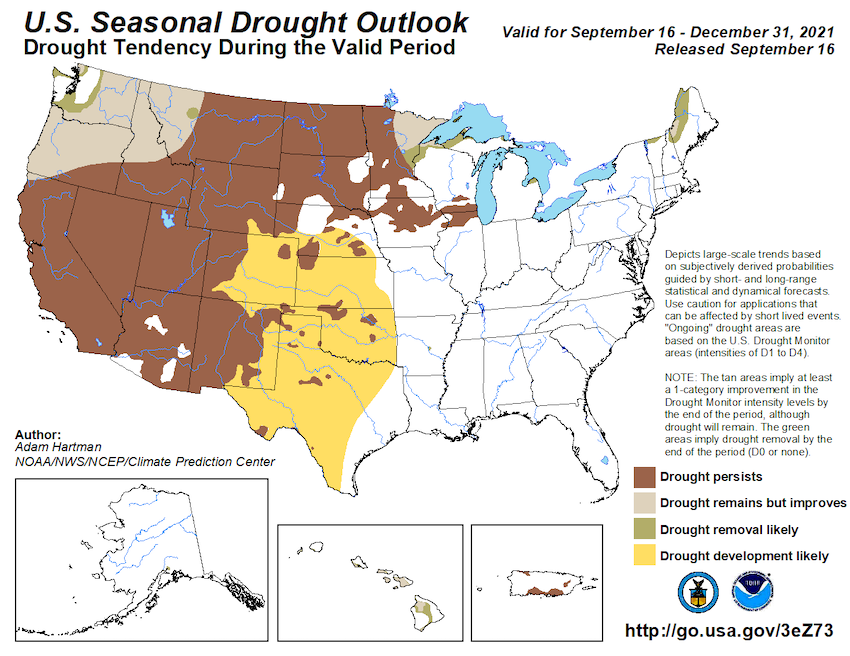
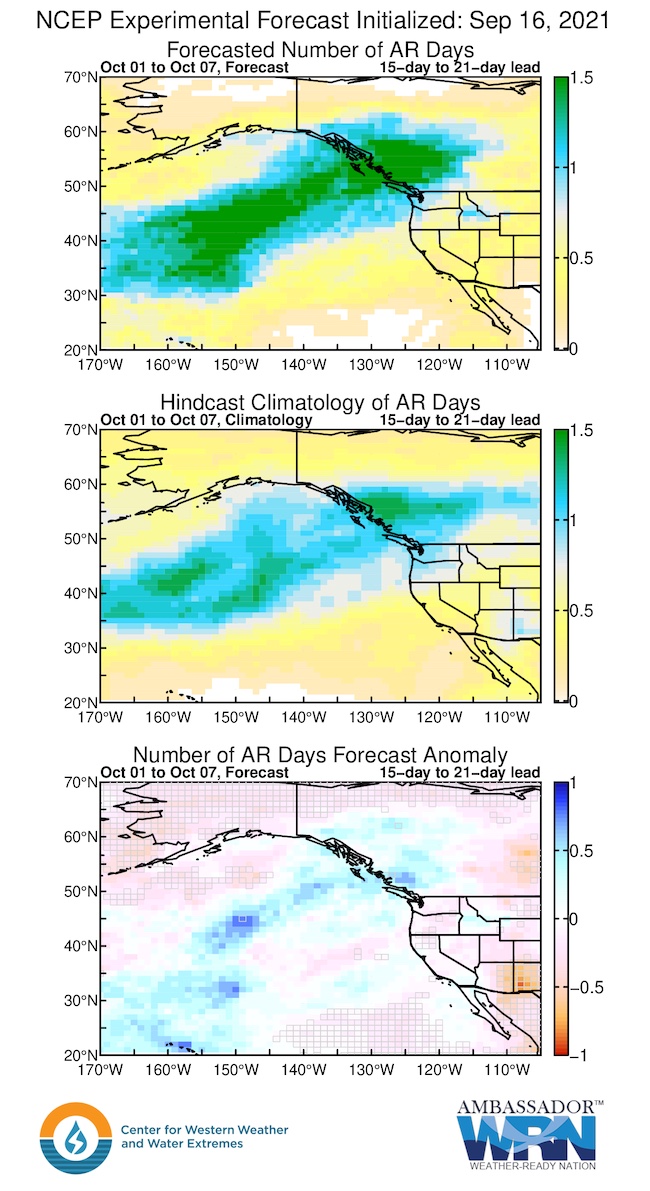
Forecasts for the next 1–3 months show drought persisting across California and the Great Basin, as forecasts increasingly reflect the potential for La Niña development into the fall and winter. Historically, La Niña is associated with dry to normal conditions in the southern part of California and Nevada. The October-November-December outlook from NOAA National Weather Service Climate Prediction Center is leaning to above-normal temperatures for the region, and equal chances of above-, below-, and normal precipitation with slight chances of below-normal conditions in southern California-Nevada. In the short term through early October, the outlook for atmospheric river (AR) activity indicates that California and Nevada are likely to remain dry.
Seasonal Drought Outlook: September 16–December 31, 2021
Three-Month Temperature and Precipitation Outlooks
Atmospheric River 3-Week Outlook
Significant Wildland Fire Potential Outlook
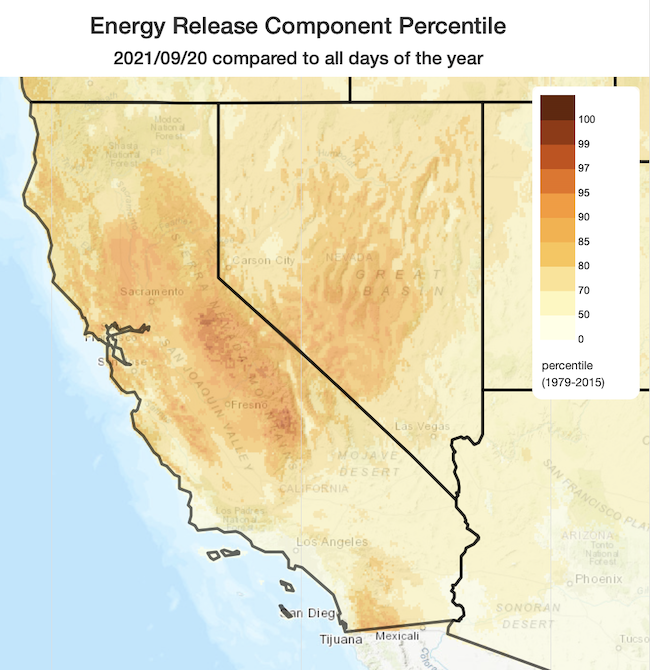
Fuel moistures across California remain extremely dry in the wake of record-setting summer temperatures. Recent precipitation in portions of northern California has temporarily tempered fire danger indices that have tracked daily records for much of the summer. Yet, a large portion of the state of California is experiencing high-to-extreme fire danger conditions. The onset of cooler temperatures and increased humidity during the transition to autumn will lead to the abatement of the extreme fuel dryness conditions. However, above-normal fire potential across most forested regions of the state will persist until the arrival of more consistent long-duration precipitation events measurably allows fuel moistures to increase.
Live fuel moistures in chaparral systems in southern California have fallen below 60%—a threshold that is operationally used to categorize critical fuel moisture that enables high intensity fast-moving fires that resist fire suppression efforts. Fire activity has been relatively limited to-date across southern California; however, traditionally, large wind-driven fires have occurred in the autumn coincident with Santa Ana winds. There is limited long-term seasonal predictability for Santa Ana wind occurrence. However, critically dry fuels will be juxtaposed with limited meaningful precipitation in the next couple weeks.
Energy Release Component
Drought Early Warning Resources
California Nevada California-Nevada DEWS
Prepared By
Amanda Sheffield
NOAA/NIDIS California-Nevada DEWS Regional Drought Information Coordinator
Email: amanda.sheffield@noaa.gov
Julie Kalansky
Program Manager, California-Nevada Applications Program (NOAA RISA team)
Email: jkalansky@ucsd.edu
John Abatzoglou
UC Merced, California-Nevada Applications Program (NOAA RISA team)
Email: jabatzoglou@ucmerced.edu
This drought status update is issued in partnership between the National Oceanic and Atmospheric Administration (NOAA), the California-Nevada Applications Program, a NOAA RISA team, and the Western Regional Climate Center at the Desert Research Institute to communicate the current state of drought conditions in California-Nevada based on recent conditions and the upcoming forecast. NIDIS and its partners will issue future drought updates as conditions evolve.
