A hot, dry winter led to below-normal early winter snowpack; potential water supply impacts if snow does not arrive
Key Points
- Hot, Hot, Hot. All five states in the Intermountain West region (Arizona, Colorado, New Mexico, Utah, Wyoming) had their warmest December on record.
- Low Snowpack. The recent record-setting warm weather led to precipitation falling as rain instead of snow, particularly at mid-elevations. Combined with lower-than-average precipitation, this resulted in reduced snowpack in the Intermountain West. Some stations are recording their lowest or near lowest snowpack on record.
- Current Impacts. Recreation is being impacted by the lack of snow, as some ski areas in the region have not yet been able to operate at full capacity.
- Looking Ahead. Models forecast above-normal temperatures for the next three months, which may continue to impact snowpack accumulation. February and March historically see the most snow of the winter months. However, even if heavy snowstorms arrive, they still may not be enough to make up for the deficits in snow accumulation to date across the region. Three-month precipitation outlooks for Arizona, New Mexico, and southern portions of Utah and Colorado favor below-average precipitation;northern Colorado and Utah have equal chances of above-, near-, or below-average precipitation; and above-average precipitation is favored for Wyoming. Drought conditions are expected to persist across the region and expand in southern Colorado and western New Mexico.
- Future Impacts to Water Supply. Snowpack directly impacts timing and volume of spring runoff, and with current forecasts showing below-normal spring runoff, concerns are growing in the region about water supply. Significant snow is needed over the coming months to compensate for the lack of accumulation so far. Most major reservoirs entered this water year with below-average water storage. Key headwaters for these reservoirs, including in the Colorado River and Rio Grande, need above-average precipitation, in some cases over multiple years, to bring water supplies back to sustainable levels.
- For more information on snowpack in the region, visit the Snow Drought Current Conditions and Impacts in the West report.
This update is based on data available as of Thursday January 15, 20256at 8:00 a.m. MT. We acknowledge that conditions are evolving.
This map shows snow water equivalent (SWE)—the amount of liquid water in the snowpack, and an important indicator of snowpack—compared to the 1991–2020 median for HUC6 watersheds. Values are based on measurements from Snow Telemetry (SNOTEL) stations. Yellow to red hues indicate below-normal SWE, while blue hues indicate above-normal SWE.
View an updated version of this map on the from Drought.gov Snow Drought page. Or, view an interactive maps from the USDA National Resources Conservation Service..
Snow drought is a period of abnormally low snowpack for the time of year. Snowpack typically acts as a natural reservoir, providing water throughout the drier summer months. Lack of snowpack storage, or a shift in timing of snowmelt, can be a challenge for drought planning.
Learn MorePeriods of drought can lead to inadequate water supply, threatening the health, safety, and welfare of communities. Streamflow, groundwater, reservoir, and snowpack data are key to monitoring and forecasting water supply.
Learn MorePercent of Median Snow Water Equivalent
< 50% of Median
Current snow water equivalent (SWE) is less than 50% of the median SWE value for this day of the year, compared to historical conditions from 1991–2020.
50%–70% of Median
Current snow water equivalent (SWE) is between 50%–70% of the median SWE value for this day of the year, compared to historical conditions from 1991–2020.
70%–90% of Median
Current snow water equivalent (SWE) is between 70%–90% of the median SWE value for this day of the year, compared to historical conditions from 1991–2020.
90%–110% of Median
Current snow water equivalent (SWE) is between 90%–110% of the median SWE value for this day of the year, compared to historical conditions from 1991–2020.
110%–130% of Median
Current snow water equivalent (SWE) is between 110%–130% of the median SWE value for this day of the year, compared to historical conditions from 1991–2020.
130%–150% of Median
Current snow water equivalent (SWE) is between 130%–150% of the median SWE value for this day of the year, compared to historical conditions from 1991–2020.
>150% of Median
Current snow water equivalent (SWE) is greater than 150% of the median SWE value for this day of the year, compared to historical conditions from 1991–2020.
This map shows snow water equivalent (SWE)—the amount of liquid water in the snowpack, and an important indicator of snowpack—compared to the 1991–2020 median for HUC6 watersheds. Values are based on measurements from Snow Telemetry (SNOTEL) stations. Yellow to red hues indicate below-normal SWE, while blue hues indicate above-normal SWE.
View an updated version of this map on the from Drought.gov Snow Drought page. Or, view an interactive maps from the USDA National Resources Conservation Service..
This map is valid through the end of the day January 12, 2026 based on data provided by the USDA Natural Resources Conservation Service (NRCS) yesterday (January 14, 2026). NRCS may make additional adjustments to these data. For the most up-to-date information, view NRCS's interactive map.
Snow drought is a period of abnormally low snowpack for the time of year. Snowpack typically acts as a natural reservoir, providing water throughout the drier summer months. Lack of snowpack storage, or a shift in timing of snowmelt, can be a challenge for drought planning.
Learn MorePeriods of drought can lead to inadequate water supply, threatening the health, safety, and welfare of communities. Streamflow, groundwater, reservoir, and snowpack data are key to monitoring and forecasting water supply.
Learn MoreCurrent Conditions and Impacts for the Intermountain West
Early Winter Conditions
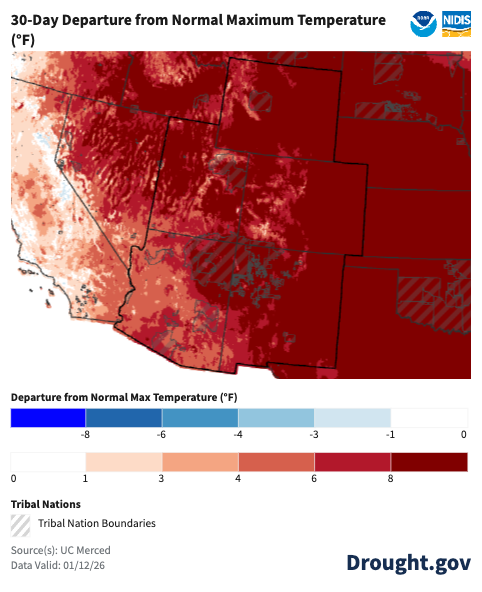
- Temperature: Temperatures in early winter were hotter than usual across the entire Intermountain West, with many areas 5º-10ºF above average. All five states in the region (Arizona, Colorado, New Mexico, Utah, Wyoming) had their warmest December on record. New Mexico experienced its hottest seven-month stretch on record from June to December of 2025. View more state temperature rankings from NOAA’s National Centers for Environmental Information.
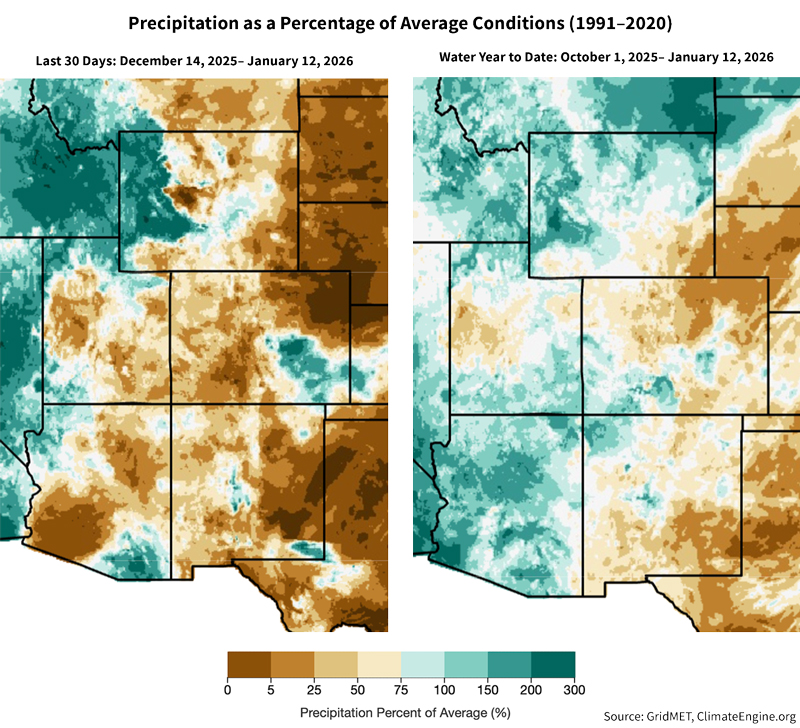
- Precipitation: Water year to date precipitation (October 1, 2025–January 13, 2026) was above average for most of the region, with some exceptions, including northeastern Colorado, west central Utah, and southeastern New Mexico. Some stations in Arizona even recorded the top ten wettest water years to date. Precipitation over the past 30 days, however, was lower than average for much of the region, with exceptions in portions of western Arizona, western Wyoming, and east-central Colorado.Early Season Snow Drought
- The shift to below-normal December precipitation, combined with warmer weather that caused precipitation to arrive as rain rather than snow in some areas, led to lower than normal snowpack in much of the Intermountain West.
- Snow water equivalent (SWE), an important indicator of snowpack, is significantly below normal for most of Arizona, Colorado, New Mexico, and Utah.
- Nearly a third of SNOTEL stations in Colorado are reporting their lowest or second lowest snowpack on record. The Upper Colorado River Basin is at 77% of median SWE, and the Rio Grande Basin is at 40% of median SWE. Multiple sub-basins have even lower SWE.
- In Utah, the area of the state covered by snow was recorded at just 15% of the 2001-2025 median on January 1. Recent cold temperatures have kept snowpack stable, but the unseasonably high snowpack density (wet snow, near melting) may help accelerate melt when temperatures warm.
- To learn more about what winter warmth means for snowpack in the West, visit t the Colorado Climate Center and at CLIMAS blogs.
Winter Precipitation Has Been a Mixed Bag Across the Region, With a Wet Start Followed By Recent Dryness
Winter Temperatures Have Been Significantly Warmer than Usual Across the Entire Intermountain West
Current Reservoir Storage
- Many major reservoirs’ storage levels in the Intermountain West are well below average for January:
- Lake Powell is 26% percent full (48% of average).
- Lake Mead is 33% full (60% of average).
- Elephant Butte Reservoir is 9% full (29% of average).
Soil Moisture Conditions
- Dry soils entering winter may exacerbate low runoff conditions in low snow years, as the thawing soils take up water during snowmelt. However, wet soils in a low snow year may not significantly improve runoff volume.
- Root zone soil moisture was mixed across the Intermountain West in November. Central Colorado and New Mexico, much of Arizona, and parts of eastern Utah had wetter-than-average soils at the start of winter. Western Wyoming, Colorado, and New Mexico have drier-than-average soil conditions in multiple counties, and portions of northeastern Colorado, central and eastern Utah, and central Wyoming had drier or much-drier-than-usual soil moisture.
Drought Conditions
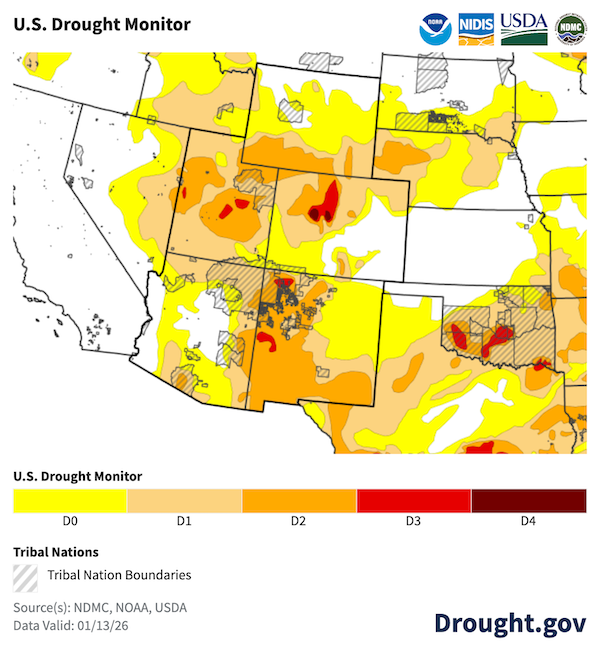
- Drought, as defined by the U.S. Drought Monitor, is patchy across the region with weekly improvements or degradations dependent on where the precipitation is falling. Much of the western part of the region has seen significant improvements to long-term drought since the beginning of the water year.
- However, varying levels of drought are still present across much of the region, with 100% of Utah currently in drought. Those areas that still lag behind in snowpack and precipitation have seen drought worsening. Exceptional Drought (D4), the most severe category, was recently introduced in Colorado.
Drought or Dry Conditions Remain Present Across the Region
Regional Impacts
- The warm, dry conditions have had significant impacts on the recreational ski industry due to lack of snow, and has led to increased fire risk in some areas of Colorado.
- The ongoing snow drought in New Mexico is adding to water supply concerns along the San Juan River and the Rio Grande. At the end of December 2025, reservoir storage for the Rio Grande system was the fourth lowest in 45 years. Due to deficits, water releases for agricultural needs may be reduced, and water users with surface and groundwater supplies may be forced to rely on groundwater for supply much earlier than usual.
- The above-normal precipitation since the beginning of the water year in many areas has been beneficial to sectors such as rangelands where snowpack is not part of the climate regime throughout the winter months.
Additional Regional Information
- Colorado Climate Center, December 2025 Monthly Climate Summary
- Western Water Assessment Intermountain January Briefing (scroll to bottom)
- Southwest Drought Learning Network, January Drought Briefing on January 29
Outlooks and Potential Future Impacts in the Intermountain West
Winter Outlooks
- Outlooks for precipitation in February and March are split across the Intermountain West, with increased probabilities of above-average precipitation in the north, near-average precipitation in the middle, and below-average precipitation in the south.
- Outlooks for temperature indicate a greater probability of continued above-normal temperatures for most of the Four Corners states throughout February and March, and equal chances of above-, near-, or below-normal temperatures for northern Utah, northern Colorado, and most of Wyoming.
Drought Conditions
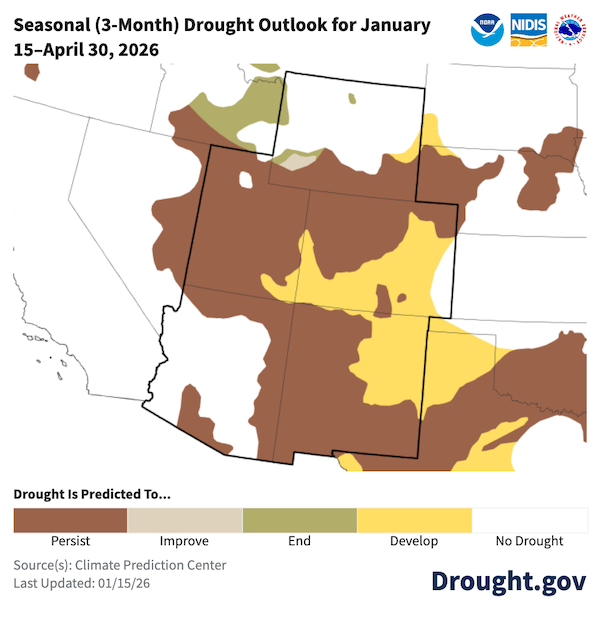
- Drought is predicted to persist across the region, and further development is likely in Colorado, northwest New Mexico and eastern Wyoming. Some improvements predicted in a small section of southwest Wyoming.
- Current La Niña conditions have a 75% chance of a transition to El Niño–Southern Oscillation (ENSO) neutral conditions during January-March 2026. For longer forecast horizons, there are growing chances of El Niño, though there remains uncertainty given the lower accuracy of model forecasts through the spring.
Potential Water Supply Impacts
- Colorado Basin River Forecast Center (CBRFC) streamflow forecasts for the April–July 2026 runoff season are below average for Utah, Colorado, Arizona, and New Mexico. Runoff forecasts are currently near to or slightly below average for much of Wyoming. However, forecast uncertainty is high this time of year, and forecasts may change, depending on weather conditions and snowpack cover over the remaining winter months.
- Water users in areas impacted by below-normal snowpack may receive reduced water allotments. Significant snowpack accumulation is needed over the next two months to compensate for the lack of snowpack in early winter.
- Learn more about water supply forecasts in the CBRFC January Water Supply Discussion.
Drought Likely to Persist and Expand This Winter in the Intermountain West
Additional Resources by State
- More local information is available from the following resources:
- Your state page on Drought.gov:
- National Weather Service Drought Information Statements:
- January 8, 2026: Salt Lake City, Utah
- January 5, 2026: El Paso TX/Santa Teresa, New Mexico
- December 31, 2025: Grand Junction, Colorado
- December 30, 2025: Cheyenne, Wyoming
- December 22, 2025: Tucson, Arizona
- December 12, 2025: Pueblo, Colorado
- More state information is available from the following resources:
- Arizona: Interactive Drought Dashboard; State Climate Office
- Colorado: Water Conditions Monitoring Committee; Colorado Climate Center Drought Dashboard
- New Mexico: Office of the State Engineer, Drought page; New Mexico Climate Center
- Utah: Department of Natural Resources, Drought page; Utah Climate Center
- Wyoming: Drought page; State Climate Office
- Regional: Intermountain West Dashboard – weather, drought, and water resources for Colorado, Utah, and Wyoming
- To report or view local drought impact information:
Prepared By
Elise Osenga
University of Colorado Boulder/Cooperative Institute for Research in Environmental Sciences (CIRES), NOAA/National Integrated Drought Information System (NIDIS)
Meredith Muth
NOAA National Integrated Drought Information System (NIDIS)
Dave Simeral
Desert Research Institute, Western Regional Climate Center
Paul Miller
NOAA National Weather Service Colorado Basin River Forecast Center
Erinanne Saffell
Arizona State Climate Office/Arizona State University
Russ Schumacher
Colorado Climate Center/Colorado State University
Jon Meyer
Utah Climate Center/Utah State University
Andrew Mangham
NOAA National Weather Service Albuquerque Weather Forecast Office
This Drought Status Update is issued in partnership between the National Oceanic and Atmospheric Administration (NOAA) and all the IMW DEWS state partners for your partnership in communicating drought expansion in the IMW region. NIDIS and its partners will issue future Drought Status Updates as conditions evolve. NIDIS is an interagency program within the Climate Program Office, which is part of NOAA’s Office of Oceanic and Atmospheric Research.