Summer Heat Worsens Drought in the Pacific Northwest.
Key Points
- The drought in the Pacific Northwest in 2021 can best be described as a spring drought. The Pacific Northwest has not seen this dry of a spring since 1924, and this is the second driest March–June for Washington, Oregon, and Idaho on record (period of record 1895–present).
- The failure of springtime precipitation to bolster high-elevation snowpack and supplement snowmelt runoff has left the region facing an early fire season with extremely dry conditions, low base flows early in the summer, and reservoirs that are quickly being drained to meet water demands that are higher than normal because of the severe early and mid-summer heat waves.
- The exceptional precipitation deficits across the Northwest can be illustrated by the record low precipitation from March 1 to July 25 at approximately 90% of SNOTEL sites (Figure 1).
- 93.22% of the Pacific Northwest Drought Early Warning System (DEWS) region is in drought, with 55.06% experiencing Extreme (D3) or Exceptional (D4) Drought conditions.
- Drought is exacerbating wildfire risk, with numerous large wildland fires burning across the region.
- Preliminary mortality data from the Washington Department of Health indicate 117 people died of heat-related deaths during the late June heatwave, with the Oregon Health Authority reporting 116. At the time of this release, the NOAA 3–7 Day Hazard Outlook indicates a slight risk of excessive heat for the end of July.
- Twenty-two counties in Oregon have drought declarations. Nineteen counties in Idaho have drought emergency declarations. On July 14, 2021, the Washington Department of Ecology issued a “Drought Emergency” nearly statewide, except for portions of Snohomish, King, and Pierce counties that include Everett, Seattle, and Tacoma.
Current U.S. Drought Monitor map for the Pacific Northwest, as of July 27, 2021. The U.S. Drought Monitor (USDM) is updated each Thursday to show the location and intensity of drought across the country. Drought categories show experts’ assessments of conditions related to dryness and drought including observations of how much water is available in streams, lakes, and soils compared to usual for the same time of year
U.S. Drought Monitor Categories
Current U.S. Drought Monitor map for the Pacific Northwest, as of July 27, 2021. The U.S. Drought Monitor (USDM) is updated each Thursday to show the location and intensity of drought across the country. Drought categories show experts’ assessments of conditions related to dryness and drought including observations of how much water is available in streams, lakes, and soils compared to usual for the same time of year
Current Conditions
- 93.22% of the Pacific Northwest DEWS region is in drought, with 55.06% experiencing Extreme (D3) or Exceptional (D4) Drought conditions.
- The exceptional precipitation deficits have continued across the Northwest with approximately 90% of SNOTEL sites reporting record low precipitation from March 1 to July 25 (Figure 1), along with many others that set second lowest records. Modeled precipitation percentiles from March 1 to July 22, 2021 also show record lows (since PRISM data began in 1980), indicating that dry conditions are not just in the high mountains (Figure 2).
- Drought is reducing soil moisture (Figure 3), drying vegetation, and thus exacerbating wildfire risk, with numerous large wildland fires burning across the region. This includes the Bootleg fire, the third largest fire in Oregon history and the largest fire currently burning in the U.S., which has burned 413,400 acres and is currently 53% contained (as of July 29, 2021). The Bootleg fire is one of 31 fires currently burning in Oregon.
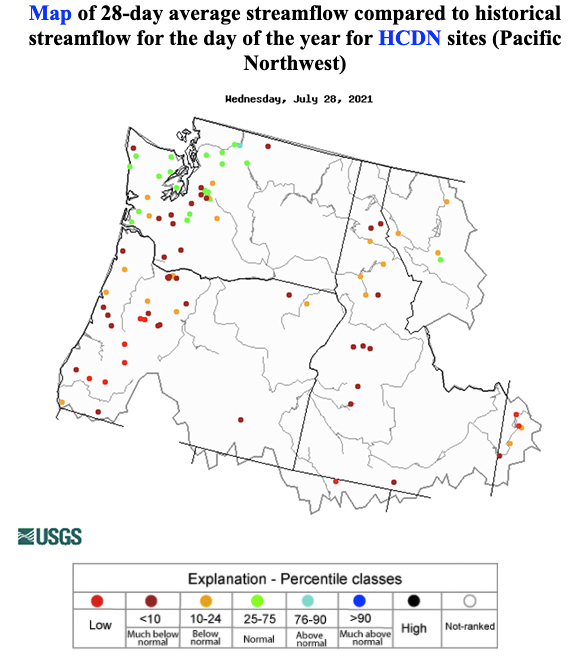
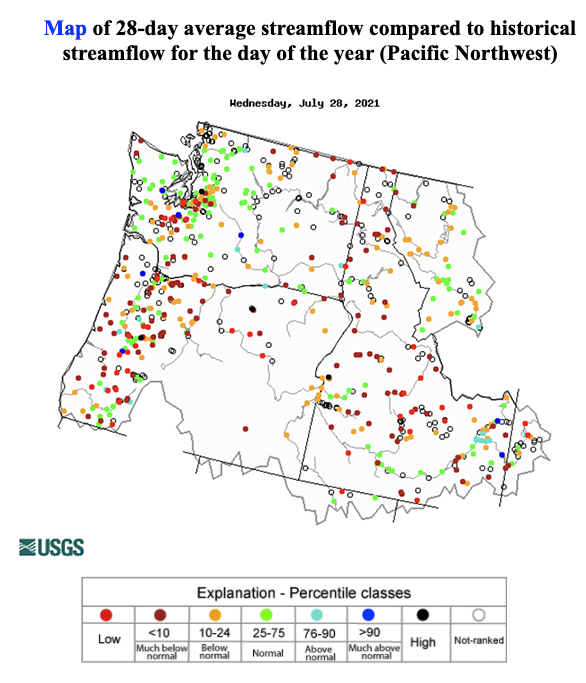
- U.S. Geological Survey (USGS) 28-day streamflow percentiles (Figure 4) indicate many streams across the region are much below normal (less than the 10th percentile)—especially the USGS Hydro-Climatic Data Network (HCDN) gages (Figure 4: top panel), a subset of USGS streamgages where streamflow conditions primarily reflect climatic variations and not human diversions. Many of the streams in the “normal” range are still below the median for this day of the year.
Figure 1. Precipitation Records: March 1–July 25, 2021
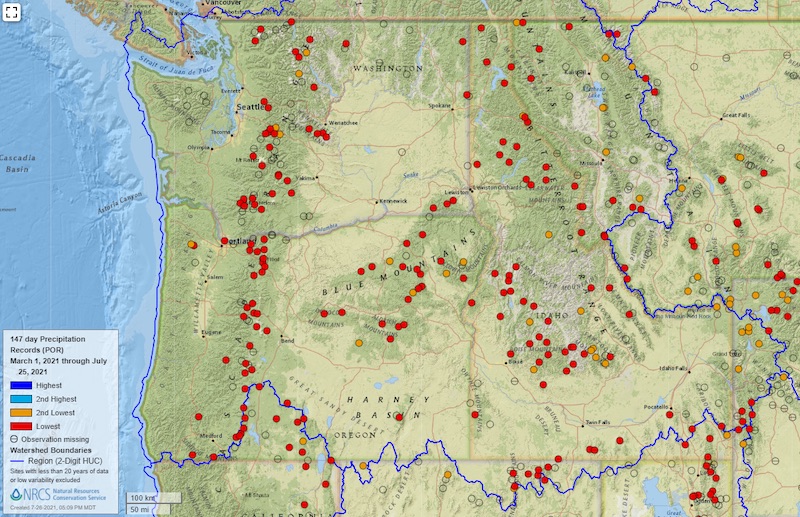
Figure 2. Modeled Precipitation Percentiles: March 1–July 22, 2021
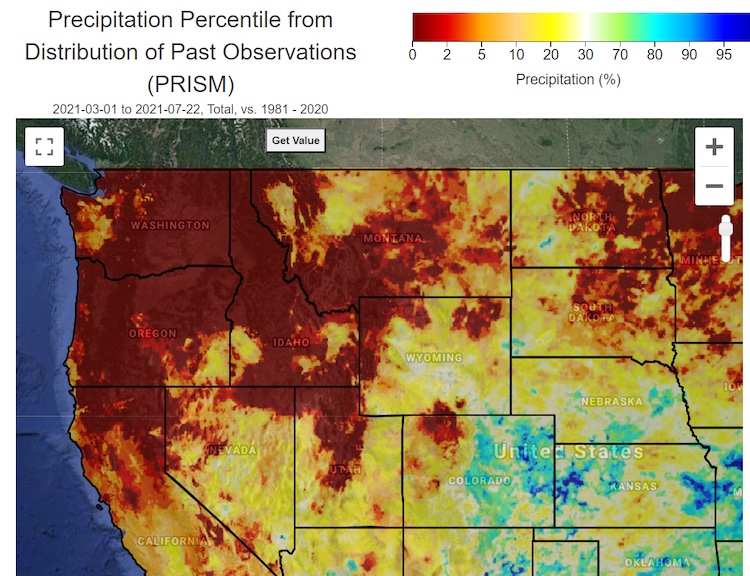
Figure 3. GRACE-Based Surface Soil Moisture Drought Indicator
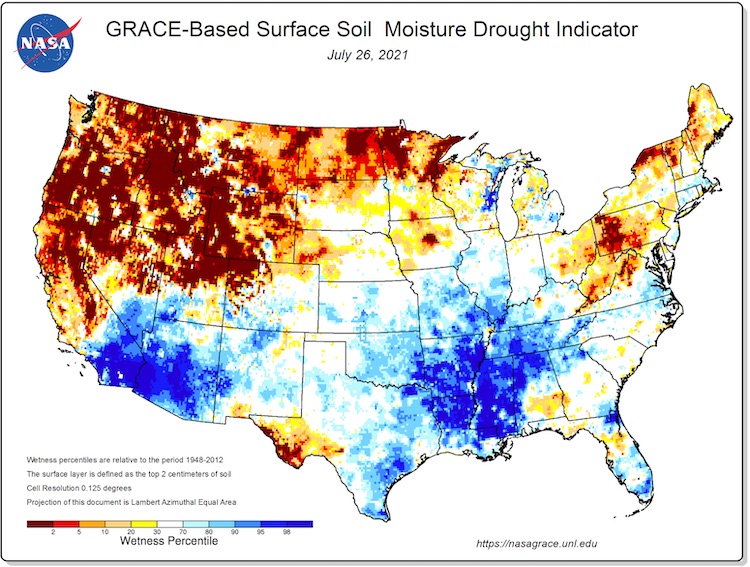
Figure 4. 28-Day Average Streamflow
Drought Impacts
- Twenty-two counties in Oregon have drought declarations. Nineteen counties in Idaho have declared a drought emergency. On July 14, 2021, the Washington Department of Ecology issued a drought declaration nearly statewide, except for portions of Snohomish, King, and Pierce counties that include Everett, Seattle, and Tacoma.
- Preliminary mortality data from the Washington Department of Health indicate 117 people died of heat-related deaths during the late June heat wave, with the Oregon Health Authority reporting 116.
Water and Agricultural Impacts
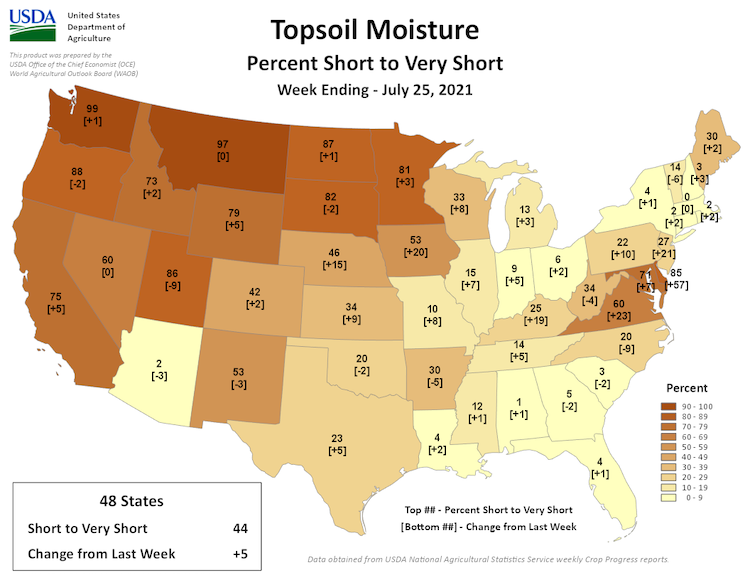
- Washington ranked worst in the country in several drought-related agricultural categories, according to the U.S. Department of Agriculture (USDA). On July 25, Washington’s topsoil moisture was rated 99% very short to short (Figure 5)—beating the previous week’s record of 98%, which was the highest on record since the beginning of the 21st century. Crop conditions reflected this with poor to very poor ratings for rangeland and pastures (97%), spring wheat (88%), and barley (61%), according to the USDA National Agricultural Statistics Service (NASS).
- Washington also saw ongoing curtailment of junior water right holders that began earlier in the season than usual. Mandatory and voluntary outdoor watering restrictions are in place in some locations. While most large water suppliers are in good shape due to the above-normal winter snowpack in Washington, some smaller municipalities are tapping into supplemental water supplies.
- Idaho’s topsoil rated 73% short to very short with 58% of rangeland and pastures rated poor to very poor. Extremely hot and dry conditions persisted in northern Idaho where some grain was cut for hay because it was not worth harvesting. Hay yields were also impacted because of the continued hot and dry conditions. Very few producers had a second cutting of alfalfa hay. Dryland pasture condition was extremely poor with supplemental feeding on the rise among producers. Most crops showed some heat stress even under irrigated conditions (USDA NASS).
- In southern Idaho, the Mountain Home Irrigation District, Big Wood Canal Company, and Big Lost River Irrigation District have run out of storage water, with the Little Wood Irrigation District and Salmon River Canal Company likely to run out of stored water in the month of August. Idaho water managers are expecting significant declines in aquifer levels this year and expect to enter winter with very little carryover in the reservoir systems. Dryland crops and rangeland in southern Idaho have been severely impacted by the exceptionally dry conditions.
- Oregon’s topsoil moisture was rated 88% very short to short (Figure 5) with 83% of rangeland and pastures rated poor to very poor. Dryland pasture condition was extremely poor with supplemental feeding on the rise among producers and stress and mortality to livestock. Most crops showed some heat stress even under irrigated conditions. In southeast Oregon, significant infestations of grasshoppers and Mormon crickets continue to impact irrigated crops and rangeland (USDA NASS).
- Oregon is also experiencing curtailed or discontinued irrigation deliveries and curtailed or discontinued reservoir releases to support instream surface water flows as water supply impacts worsen.
Figure 5. Topsoil Moisture Percent Short to Very Short
Freshwater and Terrestrial Ecosystem Impacts
- Drought conditions and the recent heat wave have led to emergency fishing regulations in Oregon. Signs of stressed fish and early onset of other fish health issues have been reported. Signs of stress in fish, in combination with high temperatures and low water levels, have led the Nature Conservancy to close fishing access to Silver Creek Preserve in Idaho.
- Hot, dry conditions around the state have led the Washington Department of Fish and Wildlife to create a tool to help the public inform them of potential environmental fish or shellfish die-offs. They have also reminded anglers of best practices to help reduce stress to fish, including fishing in the early morning when air and water temperatures are cooler and avoiding disturbing fish during the hottest part of the day when undertaking other activities and work around water.
- Over 100 observations of forest impacts—such as discolored leaves, dead branch tips, and dead trees—have been noted mostly in western Oregon. View observations or note forest and other types of drought impacts here. There is also concern about the long-term impacts of the heat wave, which hit in early summer before trees had become heat adapted.
- Damage to Christmas tree farms from the drought and heat have been reported, primarily in Oregon, the nation’s leading producer of Christmas trees.
Wildland Fire Impacts
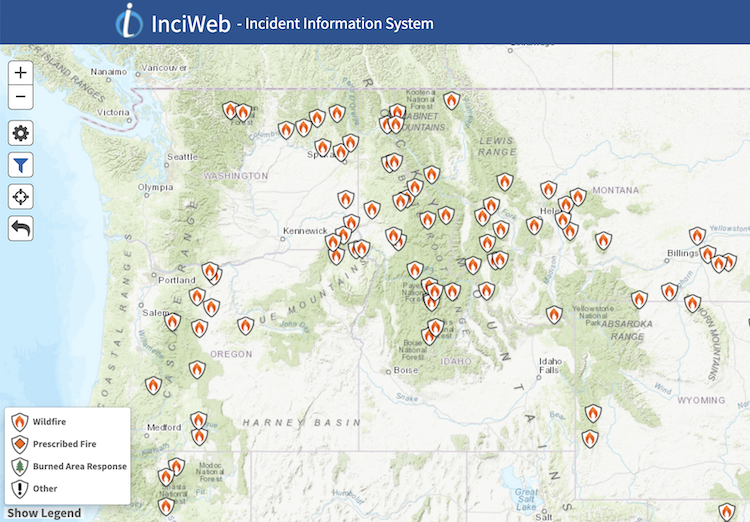
- Burn bans continue across Washington, Oregon, and Idaho due to drought conditions and above-normal temperatures. The National Interagency Fire Center has moved to National Preparedness Level 5, the highest level, given the number of large incidents (Figure 6; InciWeb) and the number of firefighting assets deployed across multiple regions.
- Nationally, the number of wildfires is below average, but Washington is already above average both in number of fires and acres burned. The number of fire ignitions in the state is approximately double the 10-year average, with months of fire season still to go. The fire season started early this year across the region, and it is noteworthy that Oregon’s third largest fire is burning already in July. For this time of year, fires in the panhandle of Idaho have burned more acres than average with the Snake River Complex fire over 100,000 acres. Smoke and air quality are also key concerns.
- Another drought-fire related impact is closure of recreational lands to public access. The Washington Department of Natural Resources (DNR) closed all DNR lands east of the Cascades beginning July 23, 2021. PotlatchDeltic Corps has closed public access to timberlands in Idaho due to wildfire risk. Some of these closures are unprecedented. These decisions are based on many factors, including current extreme hot and dry conditions, a forecast that shows no meaningful precipitation in the near future, current fuel loads, a concern for public safety, and firefighting assets that are spread thin.
Figure 6. Active Wildfires on July 29, 2021
If you are seeing additional impacts or different impacts of the drought where you live, please let us know!
Outlook and Potential Impacts
- The official August-September-October outlook from the Climate Prediction Center (Figures 7 and 8), shows higher chances of above-normal temperatures for the entire region. There is a chance of below-normal precipitation for Idaho and the southeast half of Oregon, with equal chances of below-, normal, or above-normal precipitation for the rest of the region. The Climate Prediction Center's Seasonal Drought Outlook indicates persistent drought conditions with drought development in areas that are currently categorized as D0 (abnormally dry).
- The Significant Wildland Fire Potential Outlook shows higher chances of wildfire potential across the Pacific Northwest, except for the upper northwest corner of Washington, through August and September.
- At the time of this release, the NOAA 3–7 Day Hazard Outlook indicates a slight risk of excessive heat for the end of July.
- The Climate Prediction Center's ENSO Alert System indicates that ENSO-neutral is favored through the Northern Hemisphere summer and into the fall (51% chance for the August–October season), with La Niña potentially emerging during the September–November season and lasting through the 2021–22 winter (66% chance during November–January). The emergence of a La Niña in September and November could lead to a wetter than normal winter, though there are regional differences in this pattern. Short of a robust snowpack, the Northwest is likely to experience lingering moisture deficits into next year.
- Impacts to crops, rangeland, surface, and groundwater, freshwater ecosystems, and wildfire risk are likely to continue and worsen. Given the impacts to reservoir levels, reliance on aquifers due to low surface water base flows, and lack of natural recharge the hydrological impacts of drought will be long term and could last multiple years. Recharge of groundwater systems is often a process that takes two plus years even with normal to above-normal precipitation.
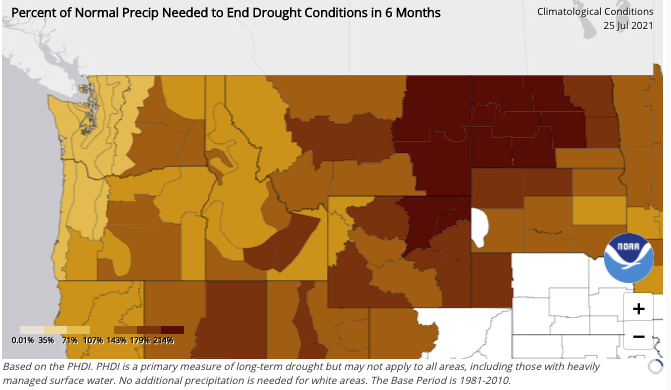
- The NCEI Drought Termination and Amelioration Tool (Figure 9) currently indicates the region would require a range of 90%–200% of normal precipitation over the next 6 months to end the drought.
Figure 7. Three-Month Temperature Outlook
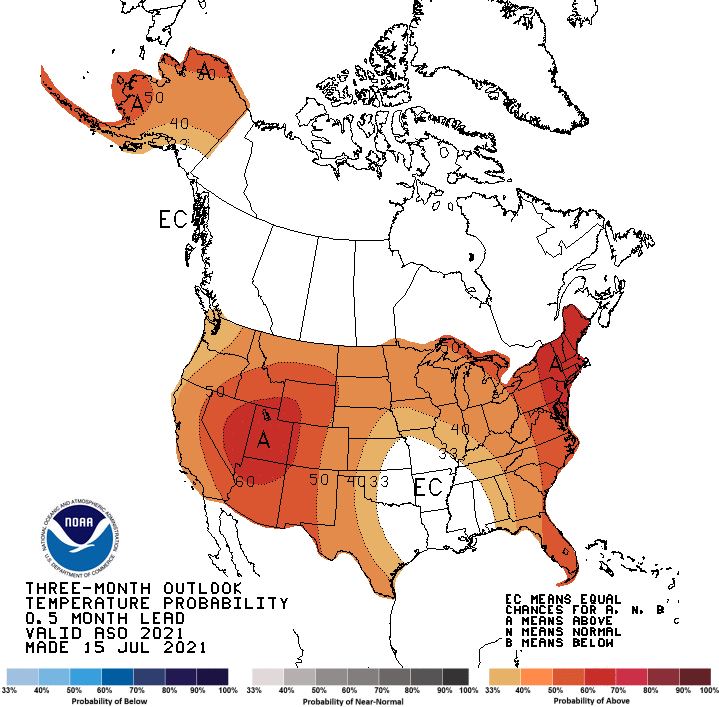
Figure 8. Three-Month Precipitation Outlook
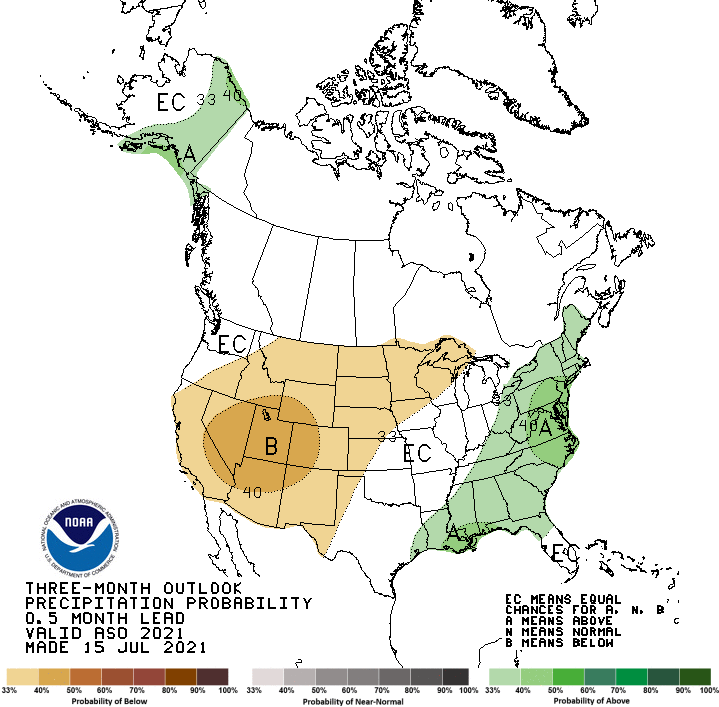
Figure 9. Percent of Normal Precipitation Needed to End Drought Conditions in 6 Months
For More Information
- NIDIS and its partners will issue future updates as conditions evolve.
- More local information is available from the following resources:
- For additional regional drought and wildfire resource information, see 2021 Pacific Northwest Drought Resources.
- Register for the Pacific Northwest Drought & Climate Outlook webinar on August 23, 11 a.m. PDT.
- Federal drought declarations are available from the U.S. Department of Agriculture Farm Service Agency.
Prepared By
Britt Parker
NOAA National Integrated Drought Information System
Karin Bumbaco
Office of the Washington State Climatologist
David Hoekema
Idaho Department of Water Resources
Ryan Andrews
Oregon Department of Water Resources
Larry O’Neill
Oregon Climate Service
Scott Oviatt
USDA Natural Resources Conservation Service
Holly Prendeville
USDA Northwest Climate Hub
This drought status update is issued in partnership with the states of Oregon, Washington, and Idaho, the USDA Northwest Climate Hub, the USDA Natural Resources Conservation Service, and the Oregon Climate Change Research Institute to communicate a potential area of concern for drought expansion and/or development within the Pacific Northwest based on recent conditions and the upcoming forecast. NIDIS and its partners will issue future drought status updates as conditions evolve.
