Widespread Dry Conditions Across the Southeast Due to Persistent Low Rainfall
A return to a consistent wetter pattern is needed to improve conditions.
Key Points
- Abnormally Dry (D0) conditions and drought (D1-D3) now cover 99.58% of the Southeast. This is the second largest area of D0 or worse conditions to ever cover the Southeast since the U.S. Drought Monitor started in 2000. (Last week was the highest at 99.69% coverage). Moderate to Extreme Drought (D1-D3) conditions cover 86.15% of the Southeast, the largest area of drought (D1 or greater) in the region since 2007.
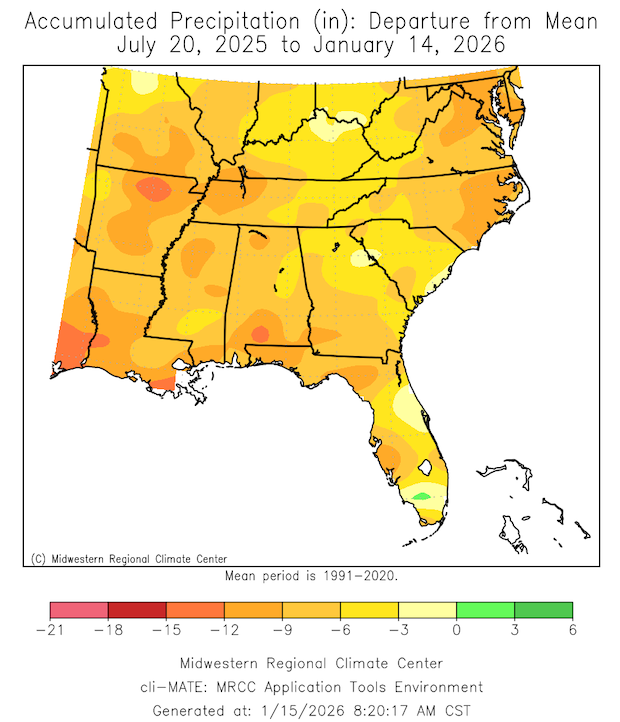
- The entire Southeast has experienced below-normal precipitation since July 2025. Most of the region has precipitation deficits over 6 inches.
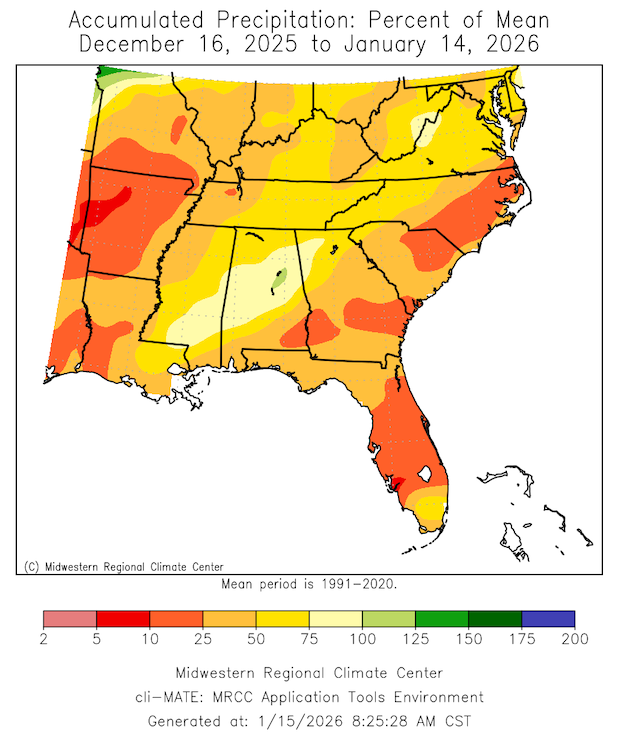
- The last 30-day period worsened the regional dryness. Much of the region received less than 75% of normal precipitation. Some areas received less than 25% of normal precipitation.
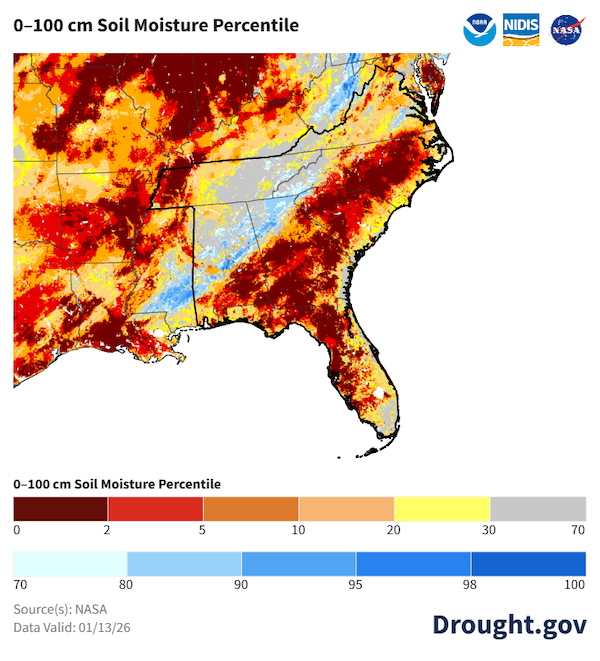
- Longer-term dryness has been compounded by recent short-term dry conditions. This caused significant soil moisture and streamflow deficits across the region.
- Impacts are relatively limited during this time of year as it is the agricultural off-season and overall water demands are typically lower. However, the dry conditions have caused some harm to agricultural pasture conditions, elevated fire risk, and decreased some reservoir levels in the region.
- Winter is the water resource recharge season (i.e., for streamflows, reservoirs, and groundwater) for the Southeast. Given the current dry conditions across the region, continued below-normal precipitation this winter could impact multiple sectors when temperatures and water demands start to increase in the spring.
Current drought coverage, according to the U.S. Drought Monitor (USDM), valid for January 13, 2026. The U.S. Drought Monitor depicts the location and intensity of drought across the country. The map uses 5 classifications: Abnormally Dry (D0), showing areas that may be going into or are coming out of drought, and four levels of drought (D1–D4).
The U.S. Drought Monitor is a joint effort of the National Oceanic and Atmospheric Administration, U.S. Department of Agriculture, and National Drought Mitigation Center.
The U.S. Drought Monitor 4-week change map shows where drought has improved, remained the same, or worsened since the previous month's U.S. Drought Monitor.
The U.S. Drought Monitor depicts the location and intensity of drought across the country, using 5 classifications (D0–D4). Green hues show where conditions improved, yellow/orange hues show where conditions worsened, and gray areas show where drought remained the same.
A drought index combines multiple drought indicators (e.g., precipitation, temperature, soil moisture) to depict drought conditions. For some products, like the U.S. Drought Monitor, authors combine their analysis of drought indicators with input from local observers. Other drought indices, like the Standardized Precipitation Index (SPI), use an objective calculation to describe the severity, location, timing, and/or duration of drought.
Learn MorePeriods of drought can lead to inadequate water supply, threatening the health, safety, and welfare of communities. Streamflow, groundwater, reservoir, and snowpack data are key to monitoring and forecasting water supply.
Learn MoreDrought can reduce the water availability and water quality necessary for productive farms, ranches, and grazing lands, resulting in significant negative direct and indirect economic impacts to the agricultural sector. Monitoring agricultural drought typically focuses on examining levels of precipitation, evaporative demand, soil moisture, and surface/groundwater quantity and quality.
Learn MoreA drought index combines multiple drought indicators (e.g., precipitation, temperature, soil moisture) to depict drought conditions. For some products, like the U.S. Drought Monitor, authors combine their analysis of drought indicators with input from local observers. Other drought indices, like the Standardized Precipitation Index (SPI), use an objective calculation to describe the severity, location, timing, and/or duration of drought.
Learn MorePeriods of drought can lead to inadequate water supply, threatening the health, safety, and welfare of communities. Streamflow, groundwater, reservoir, and snowpack data are key to monitoring and forecasting water supply.
Learn MoreDrought can reduce the water availability and water quality necessary for productive farms, ranches, and grazing lands, resulting in significant negative direct and indirect economic impacts to the agricultural sector. Monitoring agricultural drought typically focuses on examining levels of precipitation, evaporative demand, soil moisture, and surface/groundwater quantity and quality.
Learn MoreU.S. Drought Monitor Categories
D0 - Abnormally Dry
Abnormally Dry (D0) indicates a region that is going into or coming out of drought, according to the U.S. Drought Monitor.
D1 – Moderate Drought
Moderate Drought (D1) is the first of four drought categories (D1–D4), according to the U.S. Drought Monitor.
D2 – Severe Drought
Severe Drought (D2) is the second of four drought categories (D1–D4), according to the U.S. Drought Monitor.
D3 – Extreme Drought
Extreme Drought (D3) is the third of four drought categories (D1–D4), according to the U.S. Drought Monitor.
D4 – Exceptional Drought
Exceptional Drought (D4) is the most intense drought category, according to the U.S. Drought Monitor.
Total Area in Drought (D1–D4)
Percent area of the Southeast U.S. that is currently in drought (D1–D4), according to the U.S. Drought Monitor.
Drought Change Since Last Month
5-Category Degradation
Drought/dryness has worsened by 5 categories, according to the U.S. Drought Monitor.
4-Category Degradation
Drought/dryness has worsened by 4 categories, according to the U.S. Drought Monitor.
3-Category Degradation
Drought/dryness has worsened by 3 categories, according to the U.S. Drought Monitor.
2-Category Degradation
Drought/dryness has worsened by 2 categories, according to the U.S. Drought Monitor.
1-Category Degradation
Drought/dryness has worsened by 1 category, according to the U.S. Drought Monitor.
No Change
There has been no change in drought conditions at this location.
1-Category Improvement
Drought/dryness has improved by 1 category, according to the U.S. Drought Monitor.
2-Category Improvement
Drought/dryness has improved by 2 categories, according to the U.S. Drought Monitor.
3-Category Improvement
Drought/dryness has improved by 3 categories, according to the U.S. Drought Monitor.
4-Category Improvement
Drought/dryness has improved by 4 categories, according to the U.S. Drought Monitor.
5-Category Improvement
Drought/dryness has improved by 5 categories, according to the U.S. Drought Monitor.
Current drought coverage, according to the U.S. Drought Monitor (USDM), valid for January 13, 2026. The U.S. Drought Monitor depicts the location and intensity of drought across the country. The map uses 5 classifications: Abnormally Dry (D0), showing areas that may be going into or are coming out of drought, and four levels of drought (D1–D4).
The U.S. Drought Monitor is a joint effort of the National Oceanic and Atmospheric Administration, U.S. Department of Agriculture, and National Drought Mitigation Center.
The U.S. Drought Monitor 4-week change map shows where drought has improved, remained the same, or worsened since the previous month's U.S. Drought Monitor.
The U.S. Drought Monitor depicts the location and intensity of drought across the country, using 5 classifications (D0–D4). Green hues show where conditions improved, yellow/orange hues show where conditions worsened, and gray areas show where drought remained the same.
The U.S. Drought Monitor is released every Thursday morning, with data valid through the previous Tuesday at 7 a.m. EST.
The U.S. Drought Monitor and change maps are released every Thursday morning, with data valid through the previous Tuesday at 7 a.m. EST.
A drought index combines multiple drought indicators (e.g., precipitation, temperature, soil moisture) to depict drought conditions. For some products, like the U.S. Drought Monitor, authors combine their analysis of drought indicators with input from local observers. Other drought indices, like the Standardized Precipitation Index (SPI), use an objective calculation to describe the severity, location, timing, and/or duration of drought.
Learn MorePeriods of drought can lead to inadequate water supply, threatening the health, safety, and welfare of communities. Streamflow, groundwater, reservoir, and snowpack data are key to monitoring and forecasting water supply.
Learn MoreDrought can reduce the water availability and water quality necessary for productive farms, ranches, and grazing lands, resulting in significant negative direct and indirect economic impacts to the agricultural sector. Monitoring agricultural drought typically focuses on examining levels of precipitation, evaporative demand, soil moisture, and surface/groundwater quantity and quality.
Learn MoreA drought index combines multiple drought indicators (e.g., precipitation, temperature, soil moisture) to depict drought conditions. For some products, like the U.S. Drought Monitor, authors combine their analysis of drought indicators with input from local observers. Other drought indices, like the Standardized Precipitation Index (SPI), use an objective calculation to describe the severity, location, timing, and/or duration of drought.
Learn MorePeriods of drought can lead to inadequate water supply, threatening the health, safety, and welfare of communities. Streamflow, groundwater, reservoir, and snowpack data are key to monitoring and forecasting water supply.
Learn MoreDrought can reduce the water availability and water quality necessary for productive farms, ranches, and grazing lands, resulting in significant negative direct and indirect economic impacts to the agricultural sector. Monitoring agricultural drought typically focuses on examining levels of precipitation, evaporative demand, soil moisture, and surface/groundwater quantity and quality.
Learn MoreCurrent Conditions in the Southeast
This update is based on data available as of Thursday, January 15 at 8 a.m. ET. We acknowledge that conditions are evolving.
- Regional dry conditions began to build in late summer and early fall 2025. Now, the entire Southeast is experiencing precipitation deficits that date back to July.
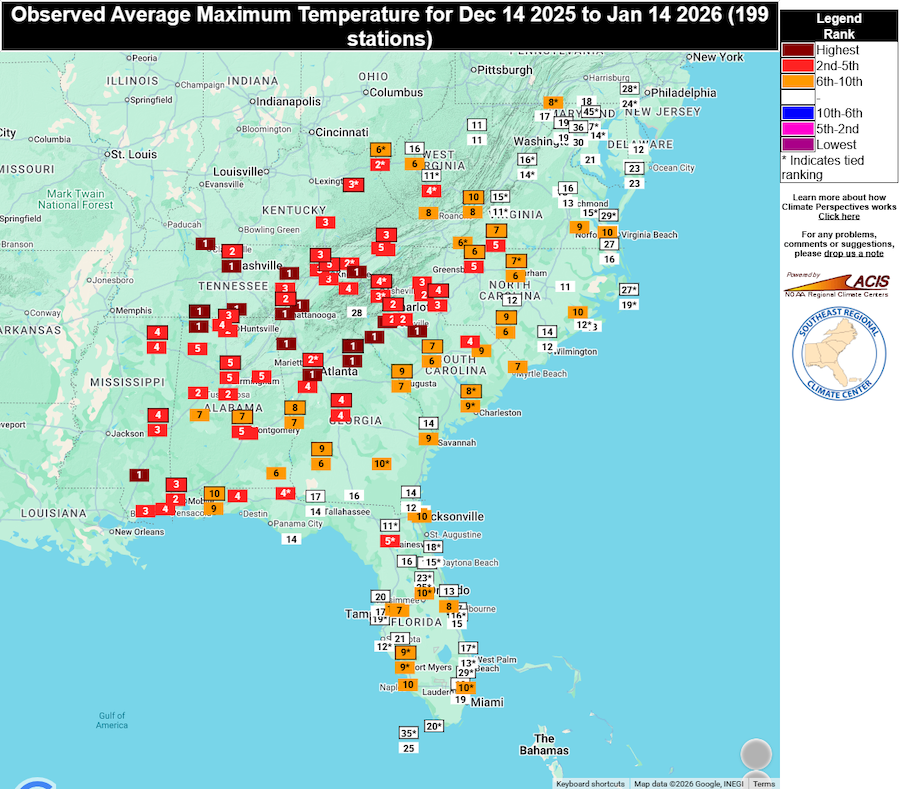
- The last 30-day period was particularly dry and warm. Most of the region received less than 50% of normal precipitation and well-above-normal average maximum daily temperatures.
- Seventy-eight monitoring stations experienced conditions that rank among the top five driest for the past 30-day period (December 14, 2025 - January 14, 2026), with 17 experiencing record driest conditions for the period.
- The persistent dry conditions have allowed soil moisture and streamflow deficits to build across the Southeast.
- Abnormally Dry (D0) conditions and drought (D1-D3) cover almost the entire Southeast.
- All states within the region are experiencing at least Severe Drought (D2) conditions, while small pockets of Florida and Georgia are experiencing Extreme Drought (D3) conditions.
Find additional information on national current conditions, or explore conditions in your state.
The Southeast Experienced Below-Normal Precipitation Since July 2025 (180 Days)
The Past 30 Days Were Very Dry for Most of the Southeast
Much of the Southeast Experienced Above-Normal Maximum Temperature Over Past 30 Days
Drought Impacts to Agriculture, Forestry and Streamflow Levels
- Agricultural impacts are limited as it is outside the growing season. Some producers reported feeding livestock supplemental hay due to poor pasture conditions, reduced water in stock ponds, and stunted winter grain crops.
- Dry conditions may increase fire risk. The National Interagency Coordination Center’s Wildfire Fire Potential Outlooks indicate a greater than usual likelihood that significant wildland fires could occur in much of the region for January, February, and March.
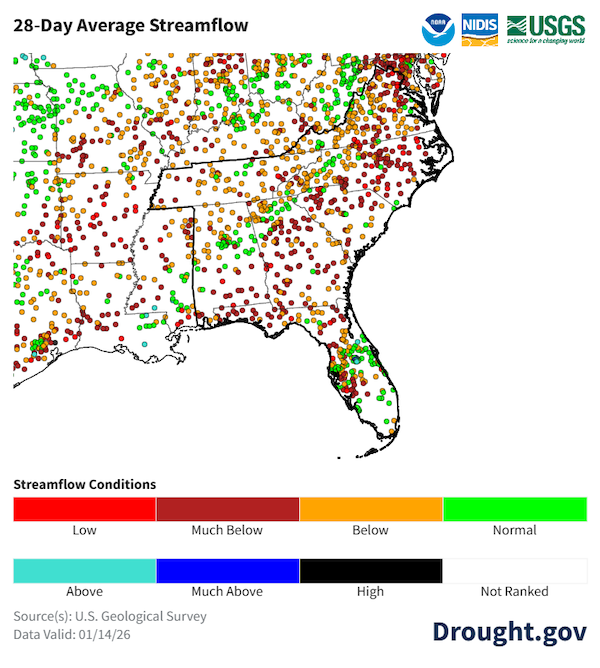
- Streamflows range from below normal to well below normal for most of the region.
- Limited precipitation reduced reservoir inflows and caused some reservoirs in the region to experience declines in storage.
- Report conditions and any drought impacts you see or hear via the Condition Monitoring Observer Reports from the National Drought Mitigation Center.
Soil Moisture Conditions Are Below Normal for Much of the Southeast
28-Day Average Streamflows Are Mostly Below Normal
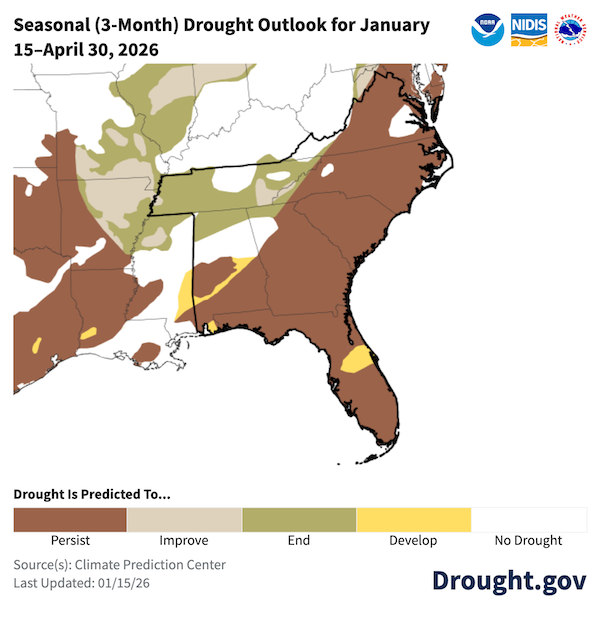
Looking Ahead: Widespread Drought Conditions Expected to Persist through March
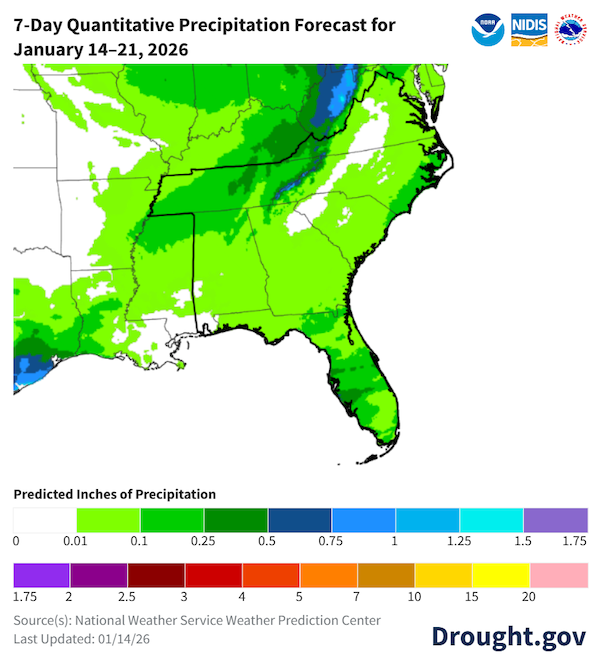
- Limited rainfall over the Southeast is forecast over the next week.
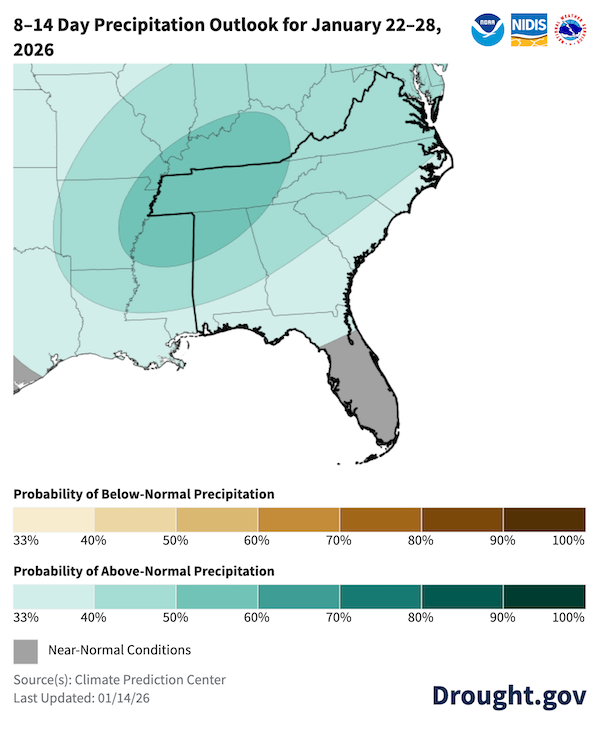
- Above-normal precipitation is likely during January 22-28 for much of the region, which could enable some short-term relief.
- Given the long-term lack of precipitation that caused soil moisture and streamflow deficits, drought conditions are likely to persist for much of the region through March if a persistent wetter pattern does not return. Tennessee, along with northwestern Alabama and Georgia may experience some drought improvement or or removal through the period.
- Additional outlook and forecast information can be found on Drought.gov.
Limited Rainfall Forecast for Next 7 Days
8-14 Day Precipitation Outlook Favors Above-Normal Precipitation for Most of the Southeast
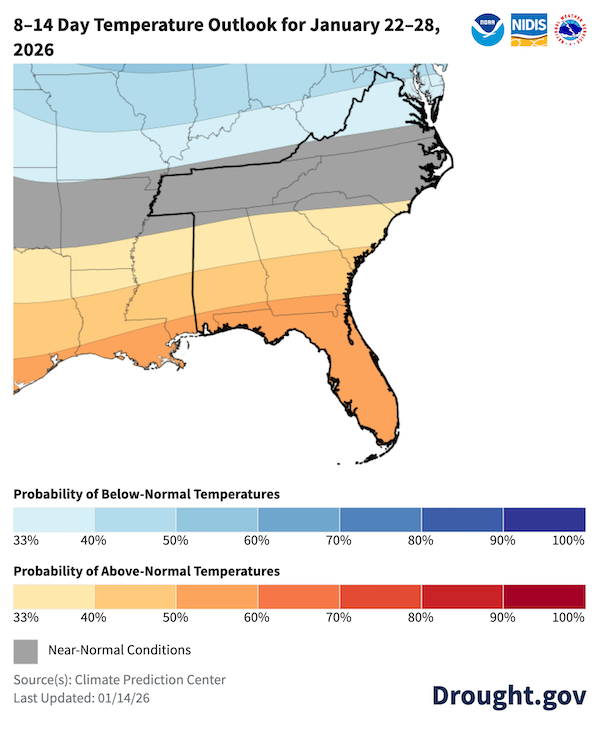
8-14 Day Temperature Outlooks Favor Near- to Above-Normal Temperatures for Most of the Region
Drought Is Expected to Persist for most of the Southeast in January–March
Resources
Drought.gov State Pages
State pages on Drought.gov provide a one-stop shop for tailored state drought information and resources for each state. Find your state here. You can also find county and city-level information on Drought.gov.
State Resources
- Alabama: ADECA Drought Planning and Management; Office of the Alabama State Climatologist; Alabama Drought Reach
- Florida: Florida Climate Center; Florida Weekly Drought Summary
- Georgia: Georgia EPD Drought Management; Office of the Georgia State Climatologist
- North Carolina: North Carolina Drought Management Advisory Council; North Carolina State Climate Office
- South Carolina: South Carolina Drought Page; South Carolina State Climatology Office
- Tennessee: Tennessee Weekly Drought Summaries; Tennessee Climate Office
- Virginia: Virginia DEQ Drought Page
Prepared By
Elliot Wickham
Cooperative Institute for Research to Operations in Hydrology (CIROH)/University of Alabama, NOAA’s National Integrated Drought Information System (NIDIS)
Brianne Minton
Alabama Office of the State Climatologist at the University of Alabama in Huntsville
Chris Fuhrmann and William Schmitz
Southeast Regional Climate Center
Corey Davis
North Carolina State Climate Office at North Carolina State University
Pam Knox
University of Georgia Cooperative Extension
Shelby Saxon
NOAA’s National Weather Service Southeast River Forecast Center
This Drought Status Update is issued in partnership between the National Oceanic and Atmospheric Administration (NOAA) and partners to communicate a potential area of concern for drought expansion and/or development within the Southeast DEWS region based on recent conditions and the upcoming forecast. NIDIS and its partners will issue future Drought Status Updates as conditions evolve. Special thanks to state partners for their input including the State Climate Offices of Georgia and Tennessee, NWS Weather Forecast Offices in Virginia, University of Georgia, and the North Carolina Department of Environmental Quality. NIDIS is an interagency program within the Climate Program Office, which is part of NOAA's Office of Oceanic and Atmospheric Research.