Below-average snowpack and a dry forecast: Potential drought impacts through spring in the Intermountain West.
Key Points
- Despite recent precipitation, long-term exceptional drought conditions persist over areas of the Intermountain West U.S. (Arizona, Colorado, New Mexico, Utah).
- Snowpack so far this season has been low, but improved from last month.
- Dry conditions are expected to continue for the southwest
Current U.S. Drought Monitor map for the Intermountain West Drought Early Warning System (DEWS) region with data valid for February 23, 2021. The U.S. Drought Monitor (USDM) is updated each Thursday to show the location and intensity of drought across the country.
Extreme (D3) to Exceptional (D4) Drought persists across much of the Intermountain West (65% of the region).
U.S. Drought Monitor Categories
Current U.S. Drought Monitor map for the Intermountain West Drought Early Warning System (DEWS) region with data valid for February 23, 2021. The U.S. Drought Monitor (USDM) is updated each Thursday to show the location and intensity of drought across the country.
Extreme (D3) to Exceptional (D4) Drought persists across much of the Intermountain West (65% of the region).
Recent and Current Conditions
U.S. Drought Monitor Conditions
- Extreme (D3) to Exceptional (D4) drought persists across much of the Intermountain West (65% of the region):
- Arizona (85% of the state)
- Colorado (57%)
- New Mexico (82%)
- Utah (90%)
- Wyoming (23%)
- Extreme (D3) drought conditions have been in place in this region since May 2020.
- The impact on the summer growing season is counted as a “billion–dollar disaster” for the western and central U.S.
Current Snow Water Equivalent (SWE)
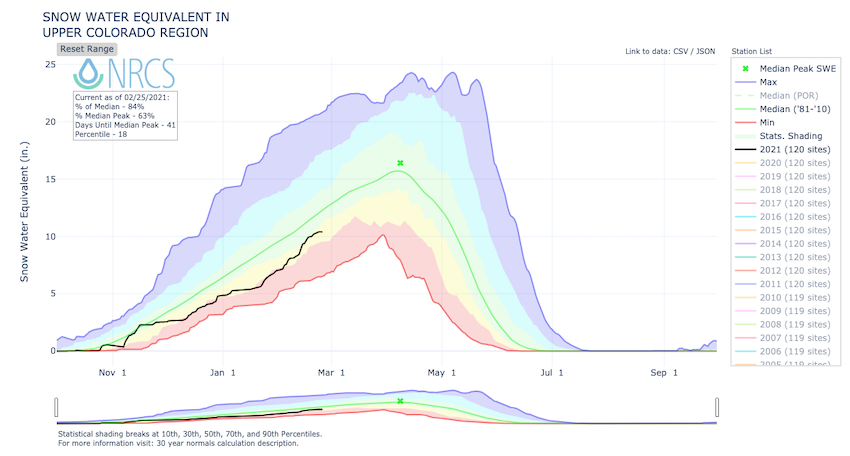
- Most of the Intermountain West has experienced low SWE for this winter, so far. Recent storms (February 2021) have made large improvements to the snowpack across the west, but SWE still sits below average for this time of the season.
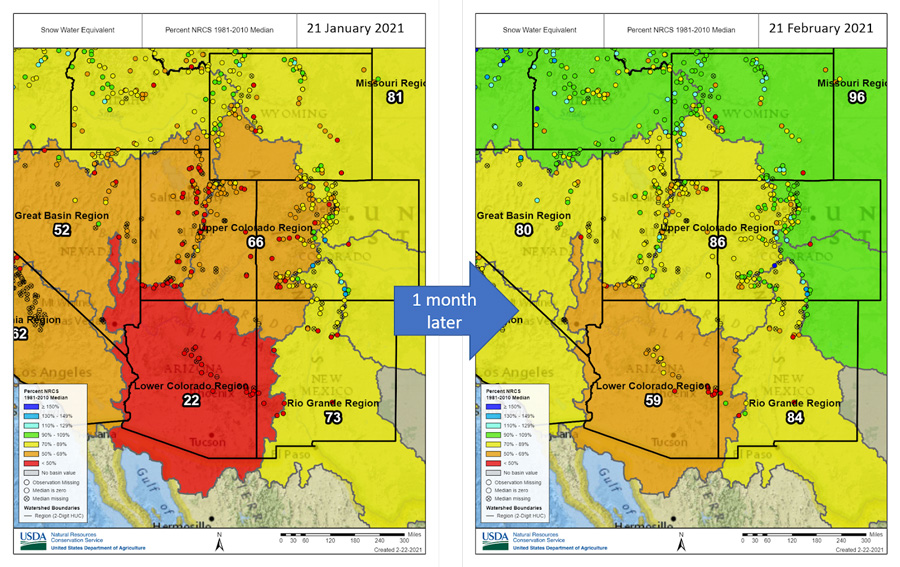
- Of note, upper Colorado River basin (upper and lower) catchments are currently at 74% of the USDA Natural Resources Conservation Service 1981-2010 median.
Snow Water Equivalent in the Upper Colorado Region
Snow Water Equivalent Percent of Median: January 21 vs. February 21
February Precipitation
Precipitation through February was mixed across the Intermountain West with the region as a whole measuring near-average precipitation.
Precipitation Conditions: January 23–February 21, 2021
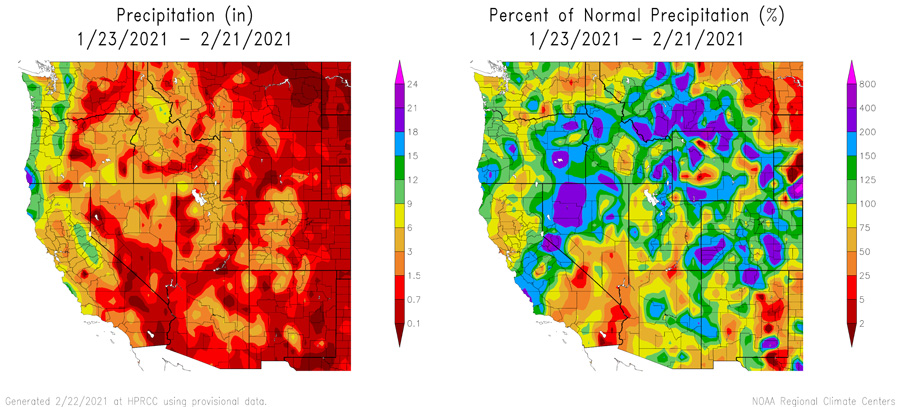
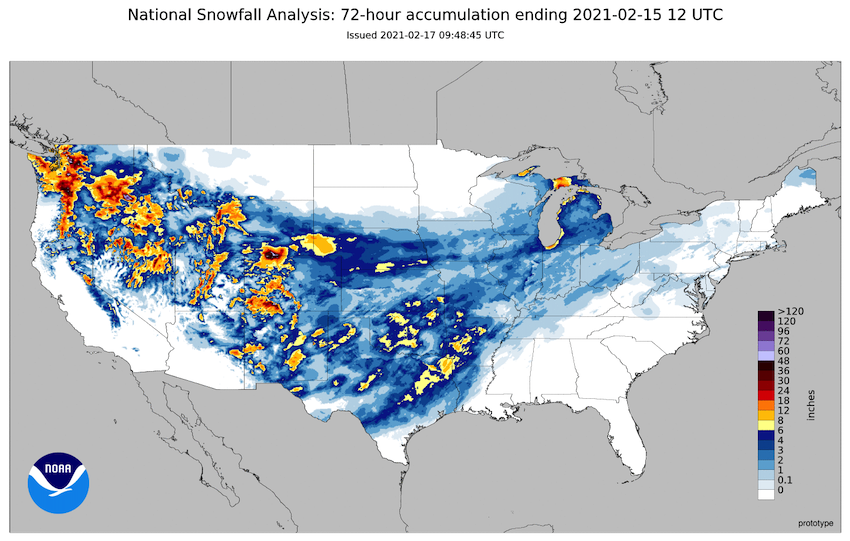
February precipitation included region-wide (except southern Arizona) rain and snowfall from February 14–18.
72-Hour Snowfall Accumulation: February 15, 2021
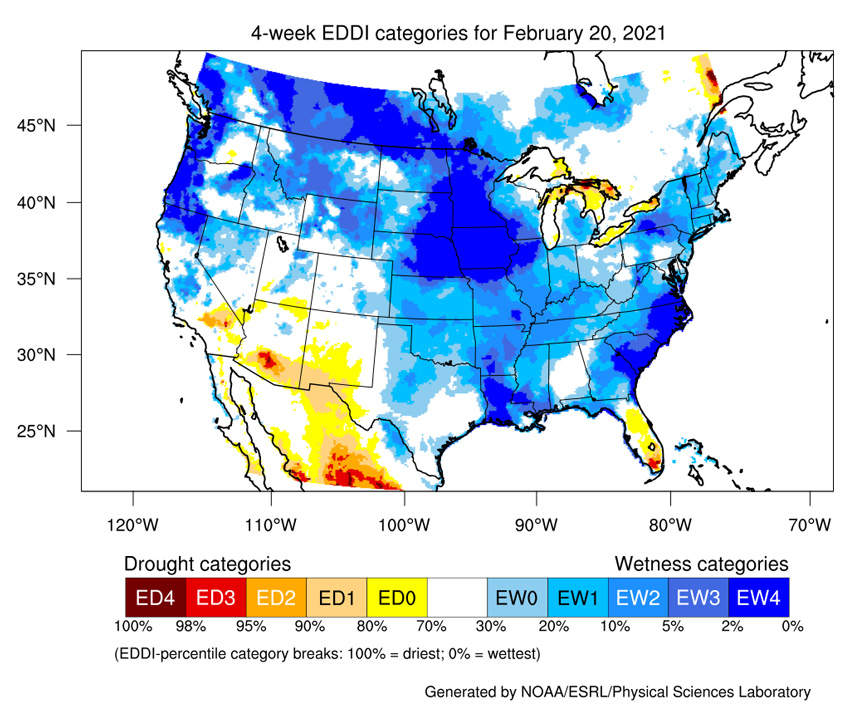
Evaporative Drought Demand Index (EDDI)
4-Week EDDI for February 20, 2021
- EDDI values have been favorable for Utah and Colorado over the past month.
- There is high evaporation demand for this time of year across southern Arizona and New Mexico.
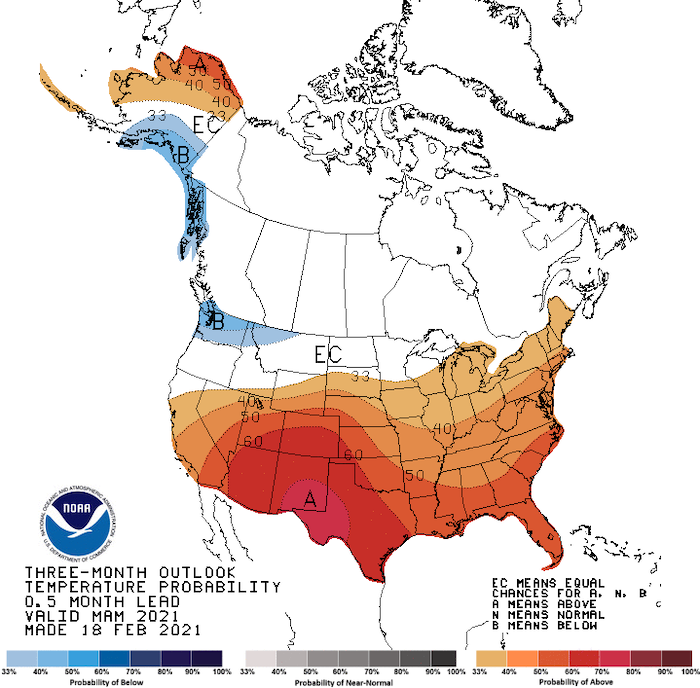
Seasonal Outlooks: March–May 2021
Temperature Outlook
For March–May, there is a greater chance for above-normal temperatures across the Intermountain West, with the highest probabilities in southern New Mexico.
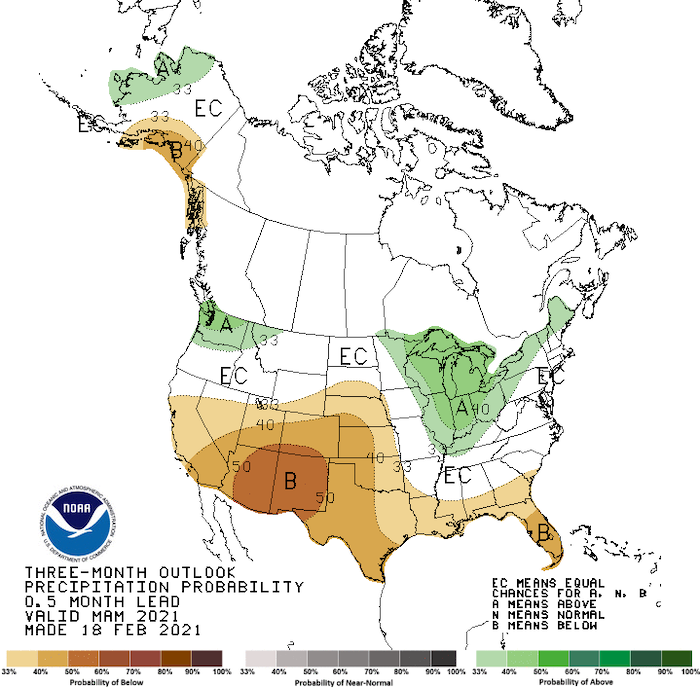
Precipitation Outlook
The Climate Prediction Center's precipitation outlook shows that below-average rainfall is the most likely outcome for March–May across the southwest, including Arizona, New Mexico, Colorado, most of Utah, and southern Wyoming.
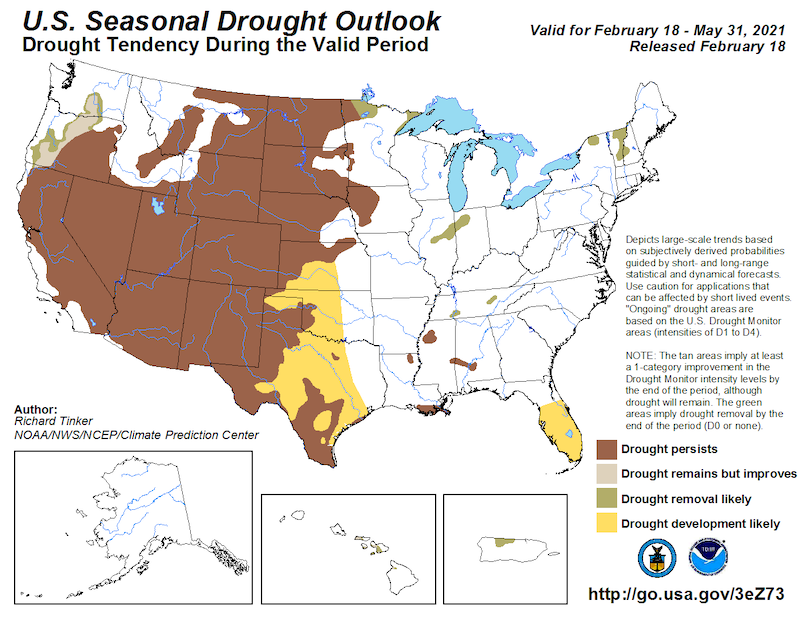
Drought Outlook
Despite recent precipitation, drought conditions are forecast to continue at least through May across the Intermountain West.
Climate Patterns
- NOAA’s ENSO alert system status is currently a La Niña advisory with moderate La Niña conditions over the equatorial Pacific.
- There is a ~60% chance of a transition from La Niña to ENSO-Neutral during the Northern Hemisphere spring 2021 (April–June).
- Historically, the southwest has experienced continued dryness into spring during La Niña conditions.
March–May Precipitation During La Niña: Increased Risk of Wet or Dry Extremes
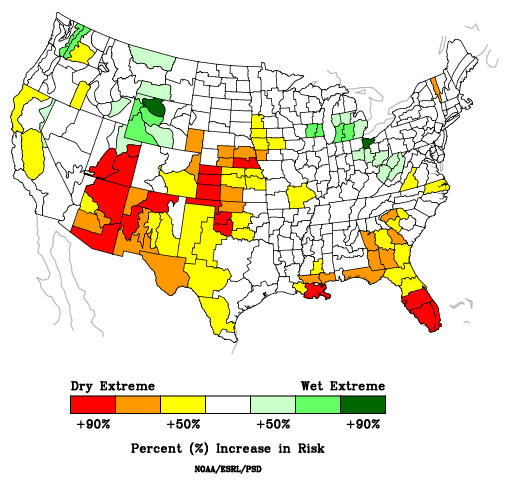
For more information, please check out the NOAA ENSO blog and the Western Regional Climate Center info page about the La Niña impacts for the west.
State-Based Conditions and Impacts
Arizona
- Statewide precipitation is 2.08 inches below water year average through January, making it the 14th driest water year on record so far.
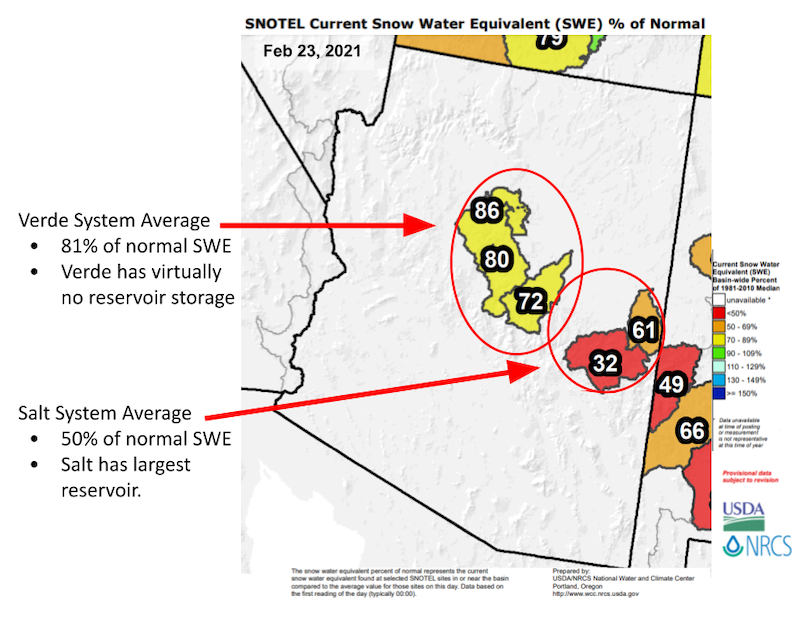
- Snowpack (SWE) in the Salt River and Upper Gila river basins are below 50% of normal.
- Dry soil beneath the snowpack will reduce run-off and aquifer recharge.
- Exceptionally hot and dry monsoon killed hundreds of Saguaro cacti in central and southern Arizona, largely due to extreme soil temperatures. Saguaros take decades to reach 3 feet tall and can live 150–200 years.
SNOTEL Snow Water Equivalent Percent of Normal
Colorado
- A series of winter storms in mid-February provided 2–4 inches of precipitation to western Colorado.
- Snowpack along the western slopes is currently 80%–90% of normal. Catchments east of the Divide are 90%–100% of normal.
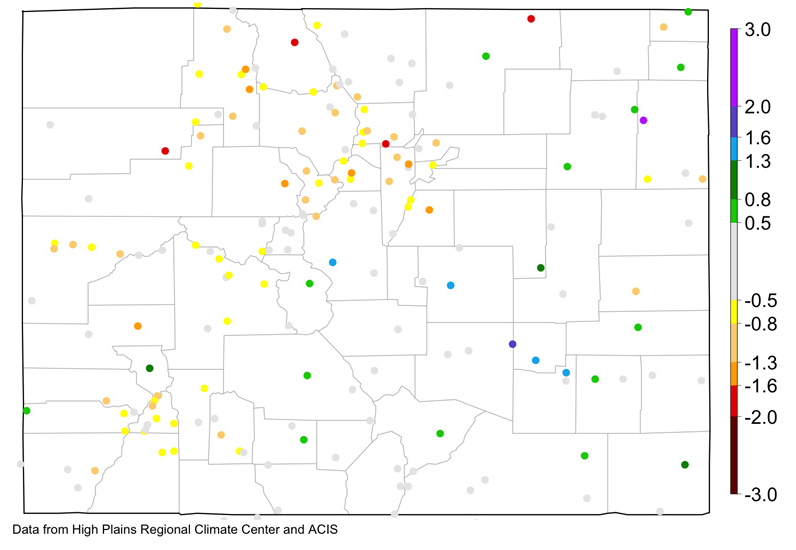
- 2020 was Colorado's second driest calendar year on record, leaving soils, base flows, and some reservoirs low entering 2021.
90-Day Standardized Precipitation Index (SPI): January 23, 2020–February 20, 2021
New Mexico
- Snowpack in the Upper Gila, Upper Pecos, and Rio Grande-Mimbres regions is still below 50% for this time of the season.
- Precipitation for February-to-date has been below average, overall, for the state.
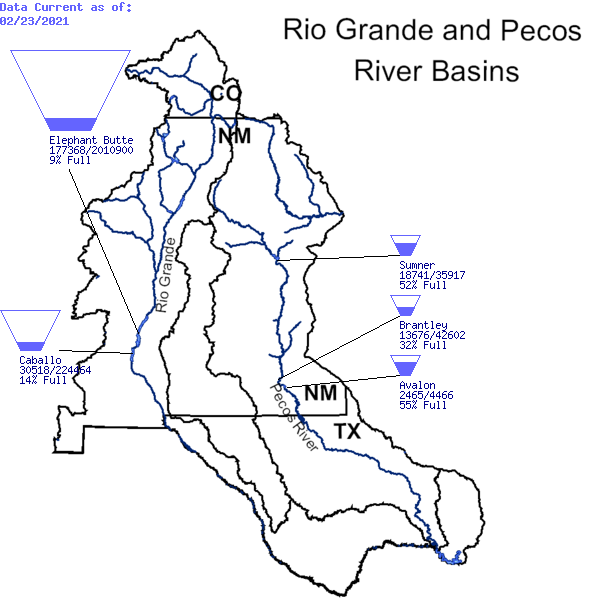
- Long-term drought shows up clearly in surface water levels in the Rio Grande and Pecos Basins. For example, Elephant Butte storage is 9% of capacity.
Utah
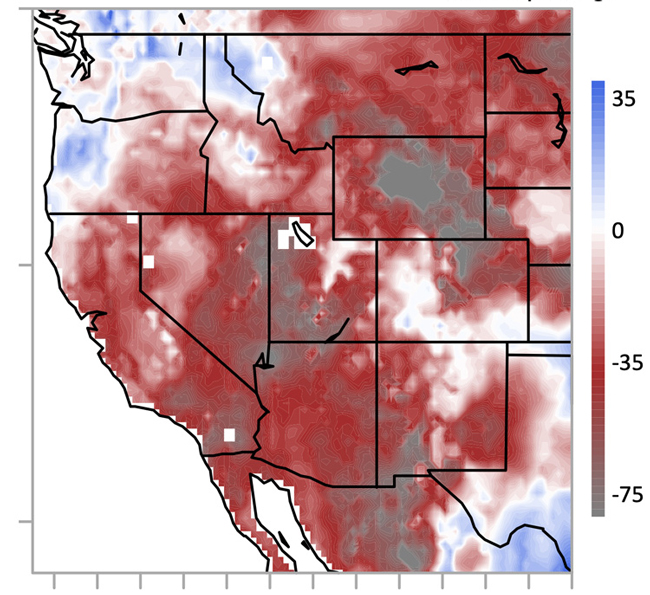
- All but the northern Wasatch Range is in a deepened drought situation that is twice as bad as a year before (from December 1, 2020 through February 22, 2021), as shown in the first figure of soil moisture deficit map below based on GRACE data. Southwest Utah remains the worst hit.
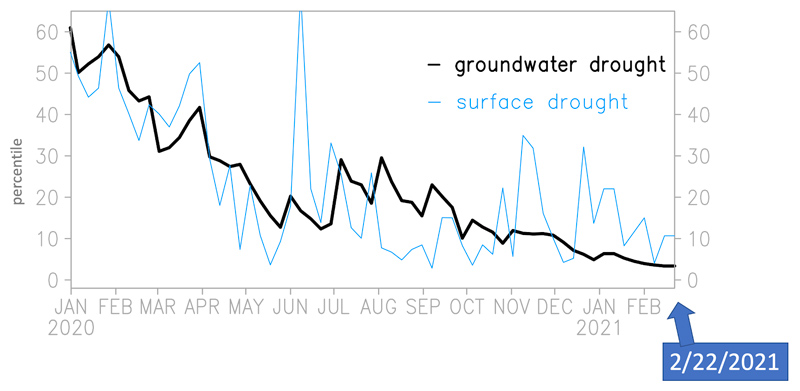
- The weekly time series of the GRACE data averaged over Utah shows a continual decline in groundwater despite the recent precipitation events, as shown in the second figure. This suggests the “sponge effect” of a very-dry subsurface in absorbing the large precipitation that otherwise would have eased the drought. This is evident in the depression of surface soil moisture after the recent storms.
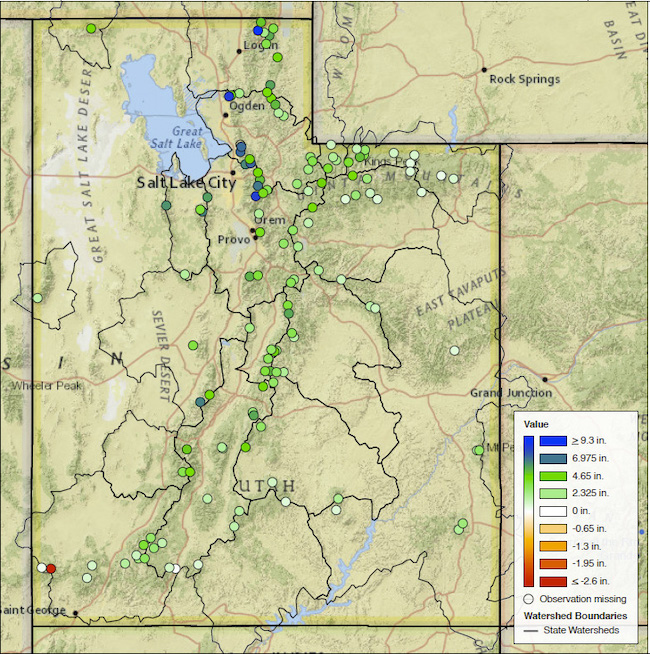
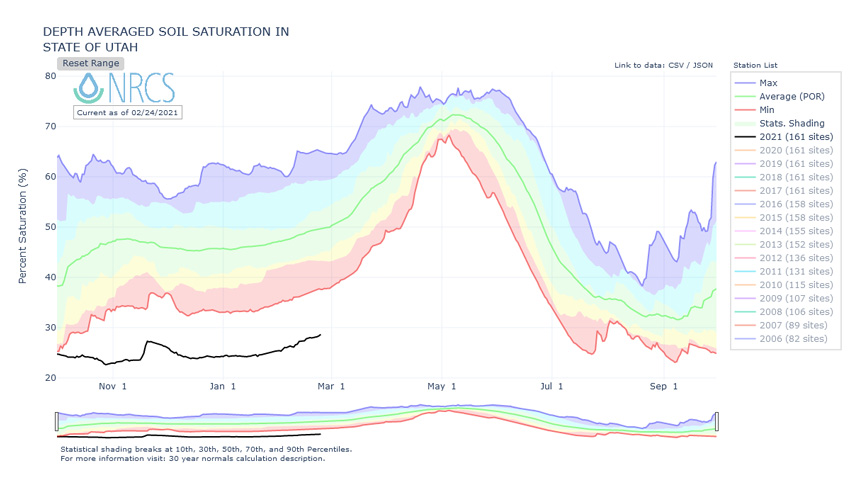
- Recent snowfall has helped snowpack conditions, as shown by the third graphic of SNOTEL change in snow water equivalent observations between February 1 and February 23. Supporting the evidence that while snowfall has occurred, soil moisture is still significantly outside of historical boundaries, as shown in the yearly comparison of statewide soil moisture conditions in the final figure.
Rootzone Soil Moisture Deficit: Dec. 1, 2020–Feb. 22, 2021 Compared to One Year Ago
Utah Groundwater Conditions
Utah Change in Snow Water Equivalent Values: February 1–23, 2021
Utah Soil Moisture Conditions
For More Information
More local information is available from the following resources:
Prepared By
Joel Lisonbee
NOAA/National Integrated Drought Information System (NIDIS)
Nancy J. Selover
Arizona State Climatologist/Arizona State University
Simon Wang and Jon Meyer
Utah Climate Center/Utah State University
Dave DuBois
New Mexico Climate Center/New Mexico State University
Peter Goble
Colorado Climate Center/Colorado State University
This Drought Early Warning Update is issued in partnership between the National Oceanic and Atmospheric Administration (NOAA), and the offices of the state climatologist for Arizona, Colorado, New Mexico, Utah, and Wyoming. The purpose of the update is to communicate a potential area of concern for drought expansion and/or development within the Intermountain West based on recent conditions and the upcoming forecast. NIDIS and its partners will issue future drought updates as conditions evolve.
