Drought emergency declared for Utah while Northeast Colorado sees drought conditions improve.
Key Points
- A heavy winter storm from March 12–14 eased drought conditions for eastern Colorado.
- Despite recent precipitation, exceptional drought conditions persist over areas of the Intermountain West (Arizona, Colorado, New Mexico, Utah).
- Snowpack so far this season has been low, but improved from last month.
- Dry conditions are expected to continue for the Southwest.
Current U.S. Drought Monitor map for the Intermountain West Drought Early Warning System (DEWS) region with data valid for March 23, 2021. The U.S. Drought Monitor (USDM) is updated each Thursday to show the location and intensity of drought across the country.
Extreme (D3) to Exceptional (D4) drought persists across much of the Intermountain West.
Extreme (D3) drought conditions have been in place in this region since May 2020. The impact on last year's summer growing season is counted as a “billion-dollar disaster” for the western and central U.S.
U.S. Drought Monitor Categories
Current U.S. Drought Monitor map for the Intermountain West Drought Early Warning System (DEWS) region with data valid for March 23, 2021. The U.S. Drought Monitor (USDM) is updated each Thursday to show the location and intensity of drought across the country.
Extreme (D3) to Exceptional (D4) drought persists across much of the Intermountain West.
Extreme (D3) drought conditions have been in place in this region since May 2020. The impact on last year's summer growing season is counted as a “billion-dollar disaster” for the western and central U.S.
Recent and Current Conditions
State Drought Plans, Declarations, or States of Emergency in Effect
| Arizona | Colorado | New Mexico | Utah |
|---|---|---|---|
| Drought declaration from 2007 that has not been rescinded | State Drought Mitigation and Response Plan shifted from Phase 2 to Phase 3 (full activation) on November 30, 2020 | Drought declaration and activation of the State Drought Task Force, December 9, 2020 | Drought state of emergency issued on March 17, 2021 |
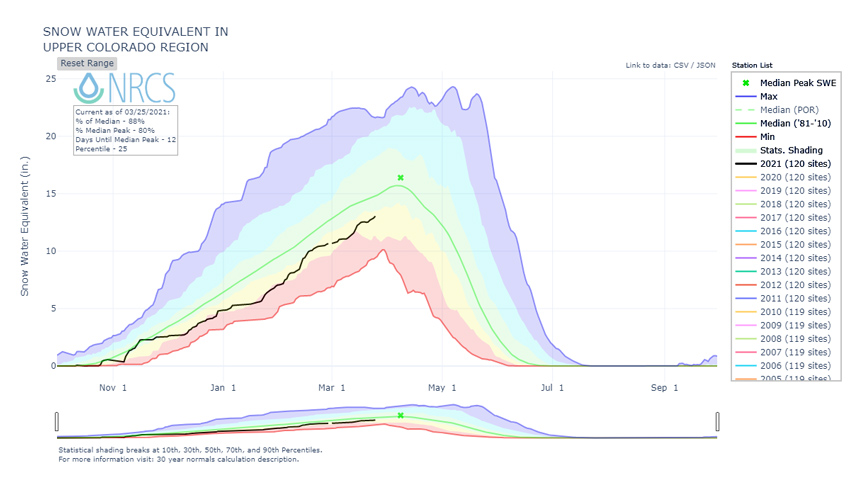
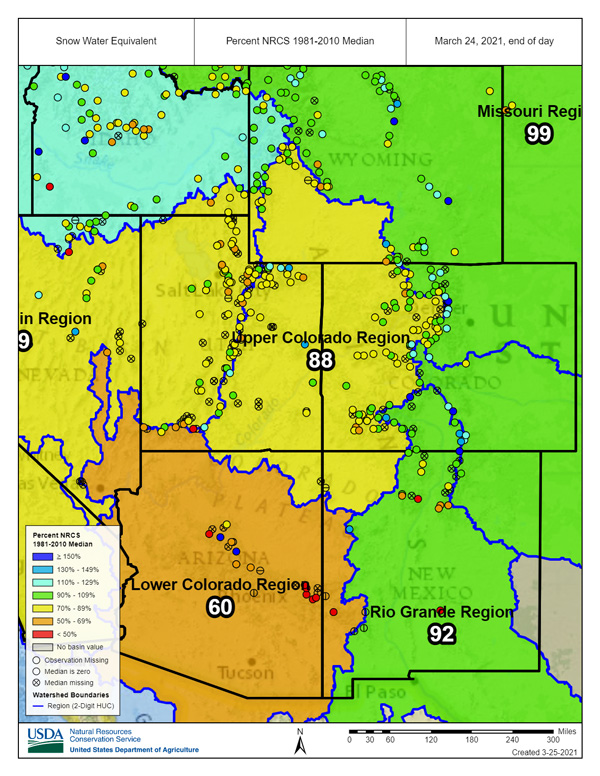
Current Snow Water Equivalent (SWE)
- Snow drought conditions remain over much of the Southwest U.S. and the Colorado River Headwaters.
- Most of the Intermountain West has experienced low SWE for this winter, so far.
- Recent storms (March 2021) have made large improvements to the snowpack across the West, but SWE still sits below average for this time of the season.
- Of note, the Colorado River basin (upper and lower) catchments are currently at 74% of USDA Natural Resources Conservation Service (NRCS)1981-2010 median.
Snow Water Equivalent in the Upper Colorado Region
Snow Water Equivalent Percent of Median: March 24, 2021
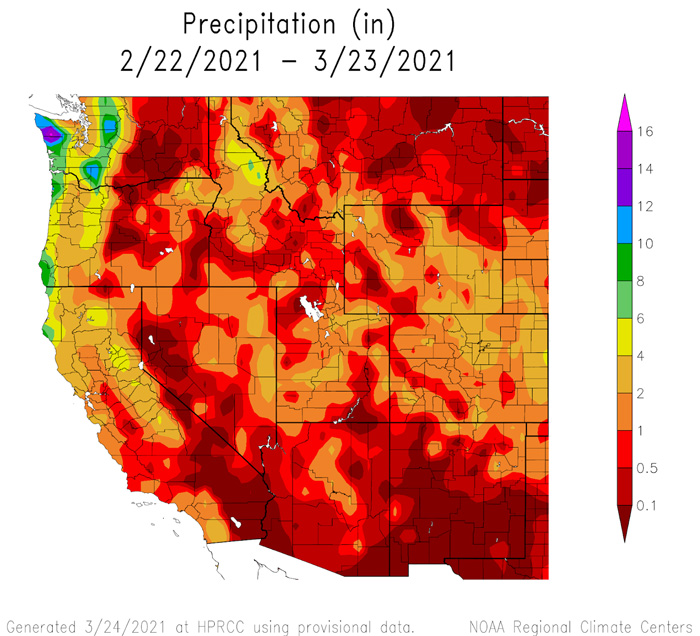
March Precipitation
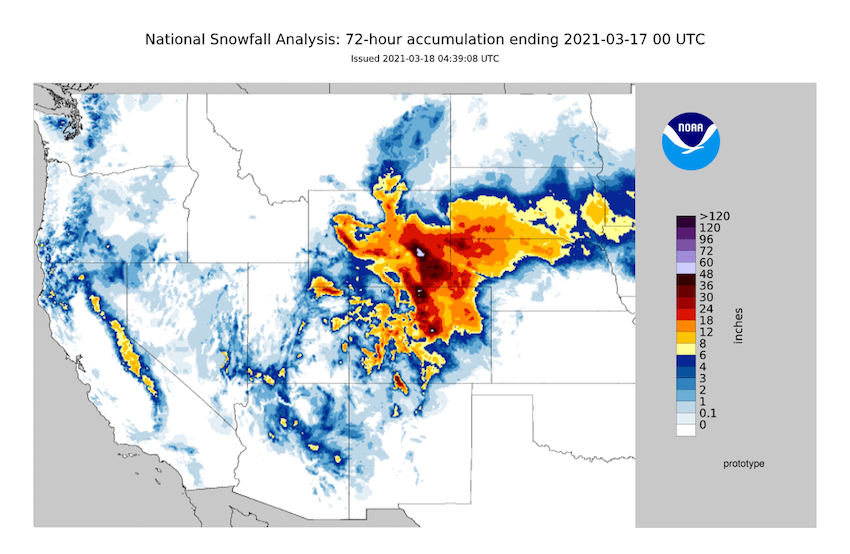
A major winter storm occurred on March 12–14.
- Areas benefiting from this storm include the Front Range, Colorado, eastern Wyoming, and the north slope of the Uinta Mountains in northeast Utah.
- The Denver airport received 27.1 inches of snow in two days, making it the fourth biggest snowstorm on record.
- The South Platte River Basin, which drains the Front Range snowpack, gained 1.8 inches of SWE (when averaged over all SNOTELs in the basin) between March 13–16 and was at 100% of median on March 16.
The Upper Colorado River region missed out (March 12–14 snow storm).
- Precipitation totals west of the Continental Divide, including the headwaters of the Colorado River, were beneficial, but much lower than on the east side.
- The Colorado Headwaters River Basin (a sub-basin of the Upper Colorado) gained only 0.8 inches of SWE from the storm and was at 89% of median on March 16.
- For most locations in the West, this storm provided just enough to keep up with the seasonal average, and many individual stations within the Colorado Headwaters Basin remain below 30th percentile SWE.
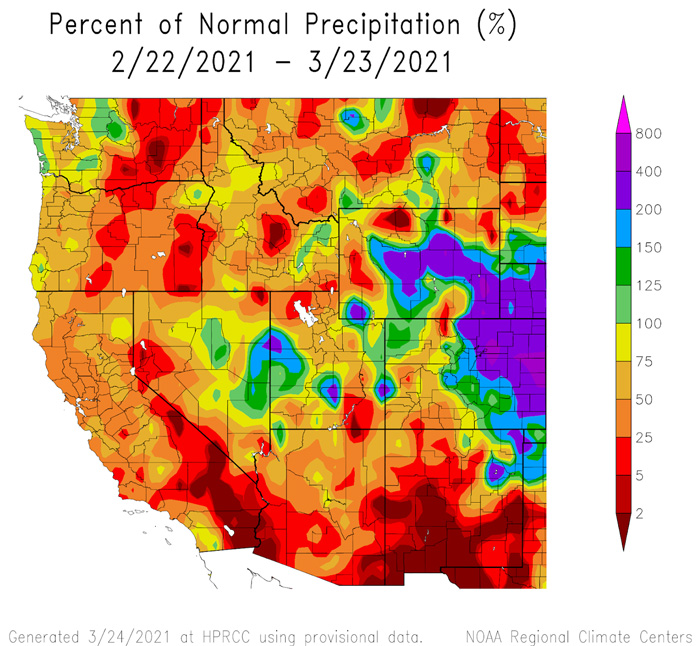
Precipitation Conditions: February 22–March 23, 2021
72-Hour Snowfall Accumulation: March 17, 2021
Evaporative Drought Demand Index (EDDI)
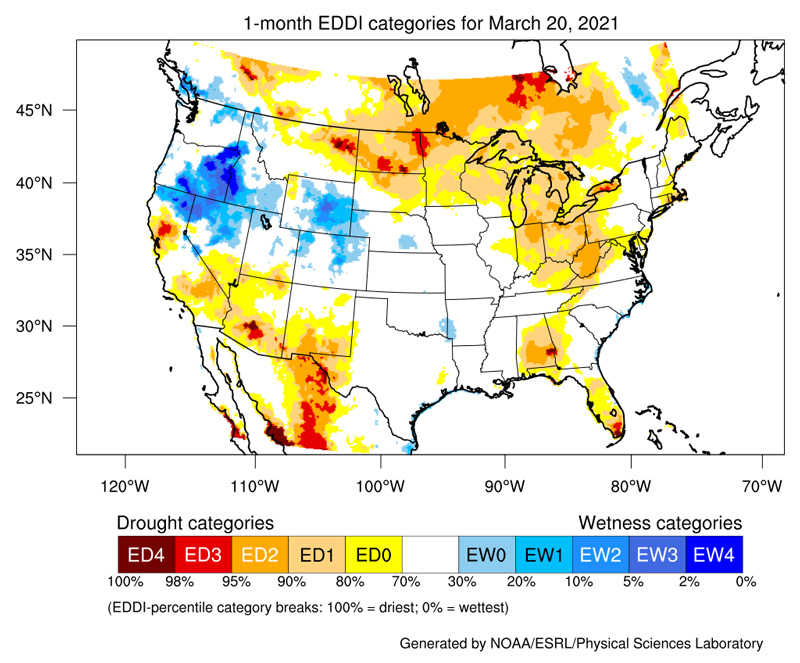
4-Week EDDI for March 20, 2021
- EDDI values have been favorable for Utah, Colorado, and Wyoming over the past month.
- There is high evaporation demand for this time of year across southern Arizona.
Seasonal Outlooks: April–June 2021
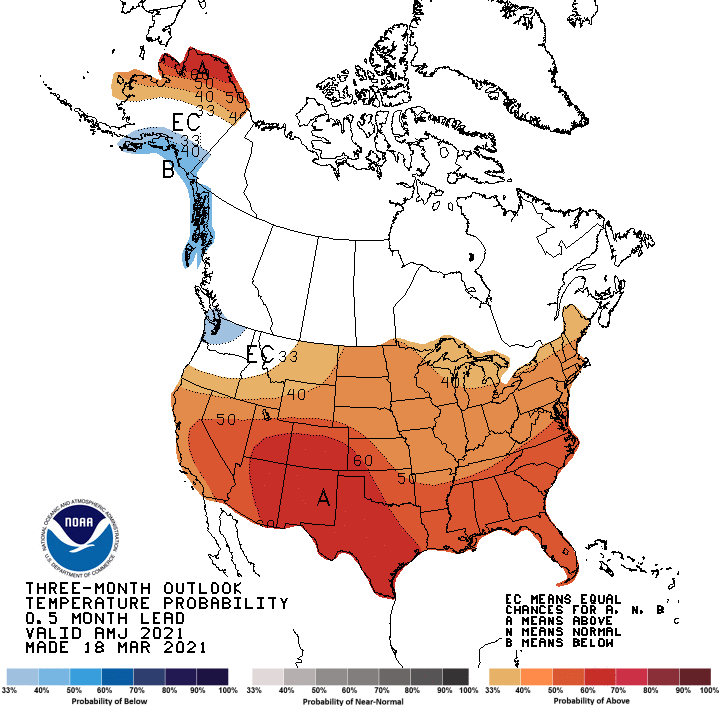
Temperature Outlook
For April–June, there is a greater chance for above-normal temperatures across the Intermountain West.
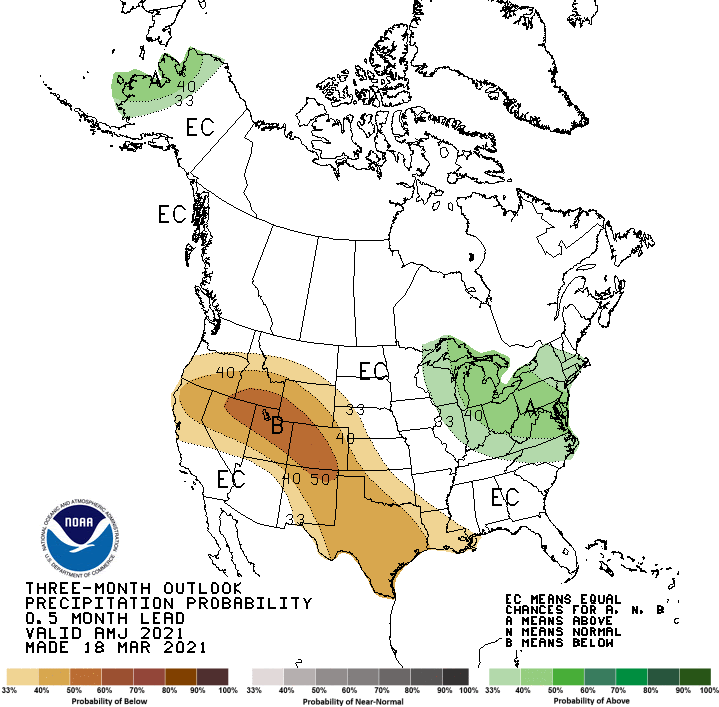
Precipitation Outlook
The Climate Prediction Center's precipitation outlook shows that below-average rainfall is the most likely outcome for April–June across the Intermountain West, including New Mexico, Colorado, Utah, and Wyoming.
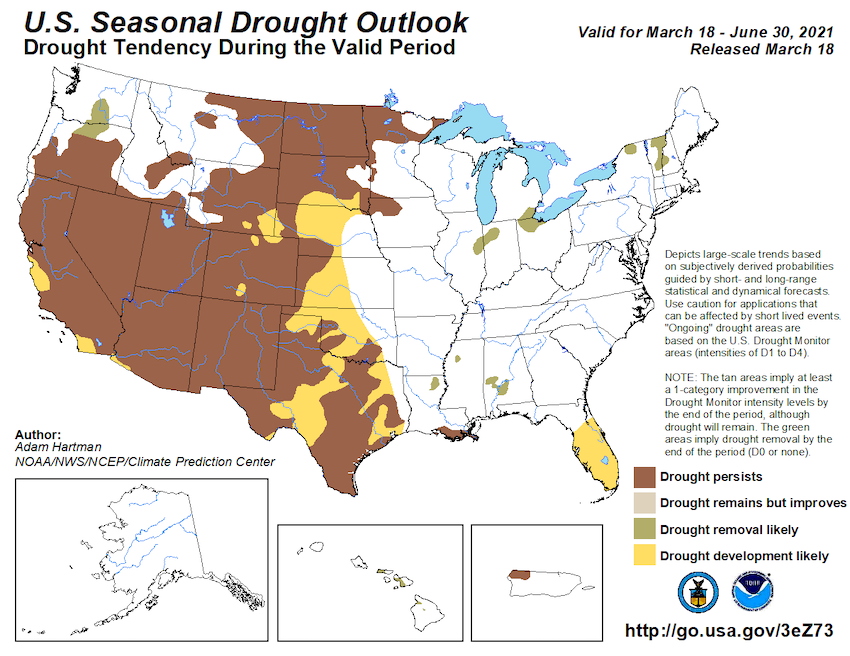
Drought Outlook
Despite recent precipitation, drought conditions are forecast to continue at least through May across the Intermountain West.
Climate Patterns
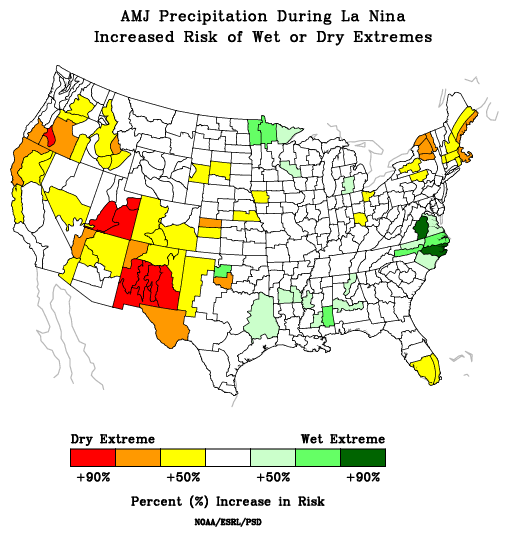
- NOAA’s El Niño–Southern Oscillation (ENSO) alert system status is currently a La Niña advisory with moderate, but waning, La Niña conditions over the equatorial Pacific.
- There is a ~60% chance of a transition from La Niña to ENSO-Neutral during the Northern Hemisphere spring 2021 (April-June).
- Historically, the Southwest has experienced continued dryness into spring during La Niña conditions.
April–June Precipitation During La Niña: Increased Risk of Wet or Dry Extremes
- For more information, please check out the NOAA ENSO blog and the Western Regional Climate Center info page about the La Niña impacts for the West.
- ENSO forecasts from the International Research Institute (IRI) for Climate and Society show ENSO neutral conditions returning within the coming months. Earlier forecasts showed an increased likelihood of La Niña returning in autumn 2021, but more recent forecasts have lowered this likelihood, although it cannot be ruled out, yet.
State-Based Conditions and Impacts
Arizona
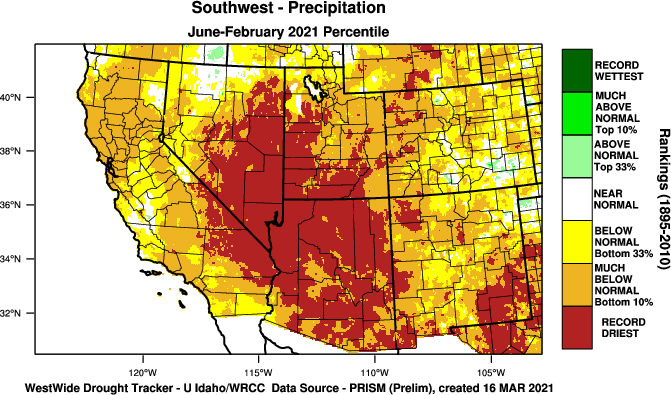
- Statewide precipitation is 2.99 inches below Water Year average through February, making it the 8th driest Water Year on record so far.
- Over the past 9 months, the entire state is below the 10th percentile for precipitation, and most of the state has had the driest June through February on record.
- The Salt Basin is averaging 27% of median, and the Verde Basin is averaging 66% of median snow water equivalent through March 22. The Salt Reservoir system is at 83% capacity, and the Verde is at 29% capacity.
- The return of warmer than normal conditions is expected to quickly melt out the remaining snow except at the highest elevations.
Southwest Precipitation Percent of Normal: June 2020–February 2021
Colorado
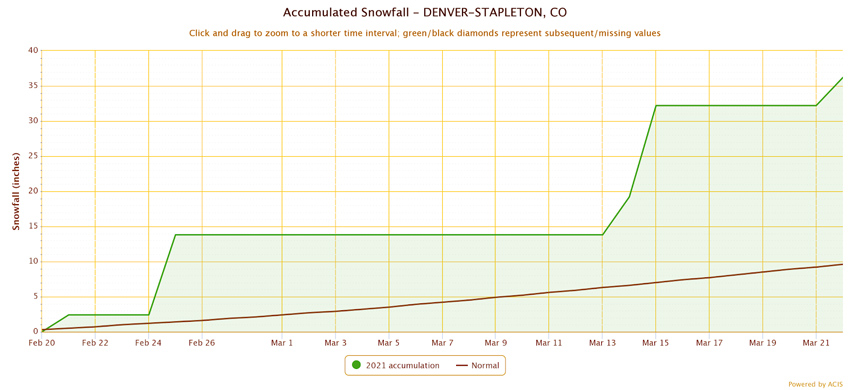
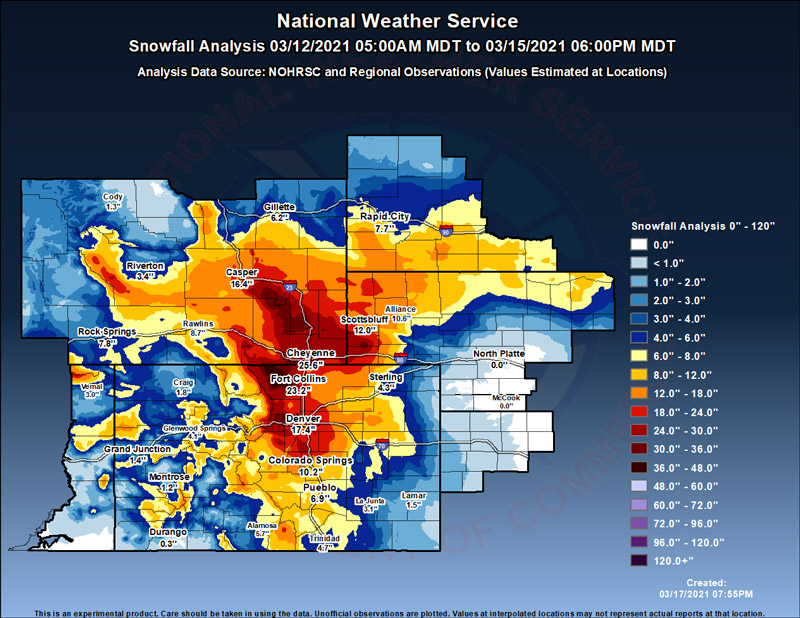
- A significant winter storm dropped 18–24 inches of snowfall on the Colorado Urban corridor between March 13 and 15.
- Denver has received over 3 feet of snowfall in the last 30 days.
- Snowpack in major basins varies from 83%–105% of normal. We are now near peak snowpack season.
- 2020 was Colorado's second driest calendar year on record, leaving soils, base flows, and some reservoirs low entering 2021. This remains a concern, particularly on the West Slopes. Soil moisture and long-term SPIs (Standardized Precipitation Index) are still well below normal.
30-Day Accumulated Snowfall for Denver-Stapleton, Colorado
National Weather Service Snowfall Analysis: March 12–15, 2021
New Mexico
- Snowpack across the state is still low to very low.
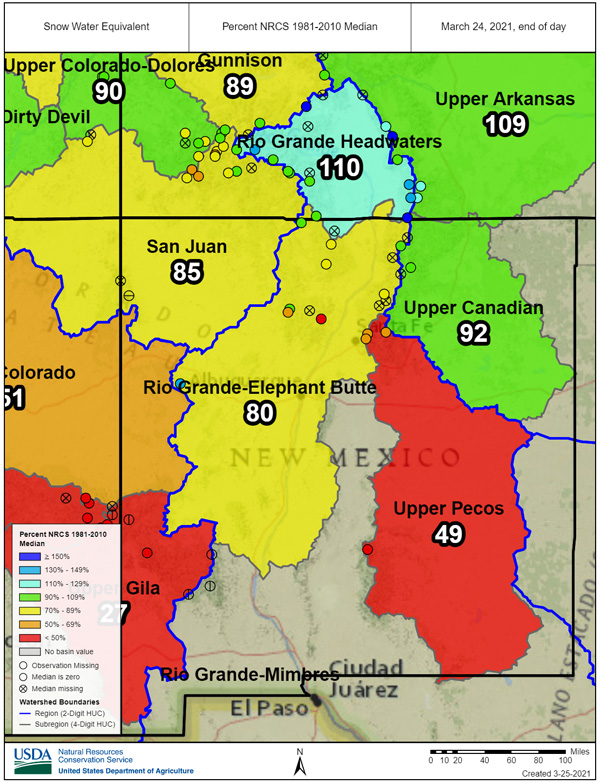
- SWE in the Upper Gila is 27% of normal for this time of the season, Upper Pecos is at 49%, and Rio Grande-Elephant Butte is at 80% of normal.
- The Rio Grande headwaters is the only region that has above-normal SWE at 110% of normal.
- Precipitation for March-to-date has been below average, overall, for the state. Northern and northeastern New Mexico has had a wetter month than the rest of the state.
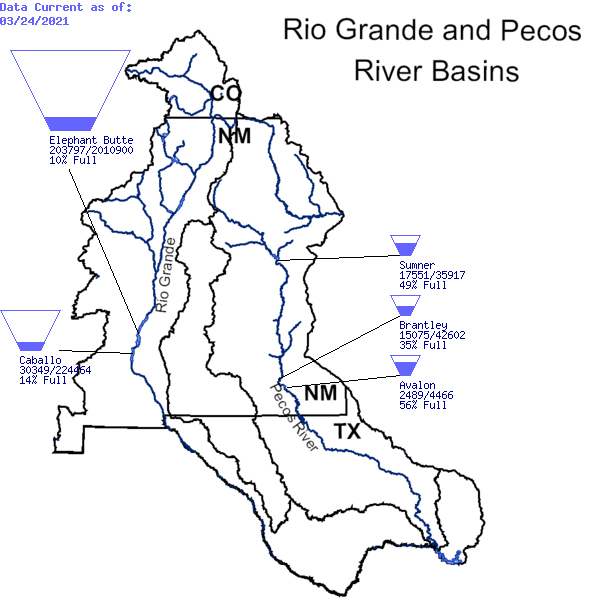
- Long-term drought shows up clearly in surface water levels in the Rio Grande and Pecos basins. For example, Elephant Butte storage is 10% of capacity.
Rio Grande and Pecos River Basin Reservoir Storage
Snow Water Equivalent Percent of Median: New Mexico Basins
Utah
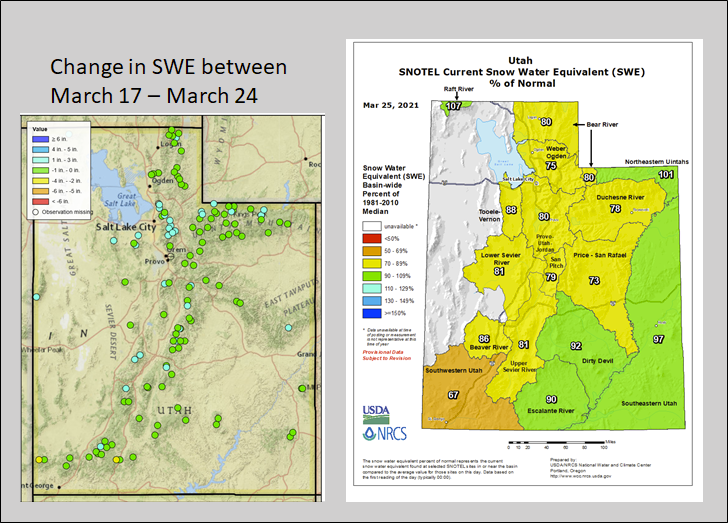
- The March 12–14 snow storm that primarily impacted northeastern Colorado also provided some snowfall for the mountains of eastern Utah, including the Uinta Mountains. For most locations, this was enough just to keep up with the seasonal average, but some locations, such as the Hickerson Park SNOTEL site, received over 4 inches of SWE.
- SNOTEL observations indicate the state’s spring melt has yet to initiate with continued, albeit marginal, SWE increases observed statewide in response to recent minor storm systems. Several basins across eastern Utah have begun to creep closer to 100% of normal in response to recent storms, but it should be noted that many of these regions are entering the period of the year when historically snow melt can have already begun. Southwest Utah remains the worst off.
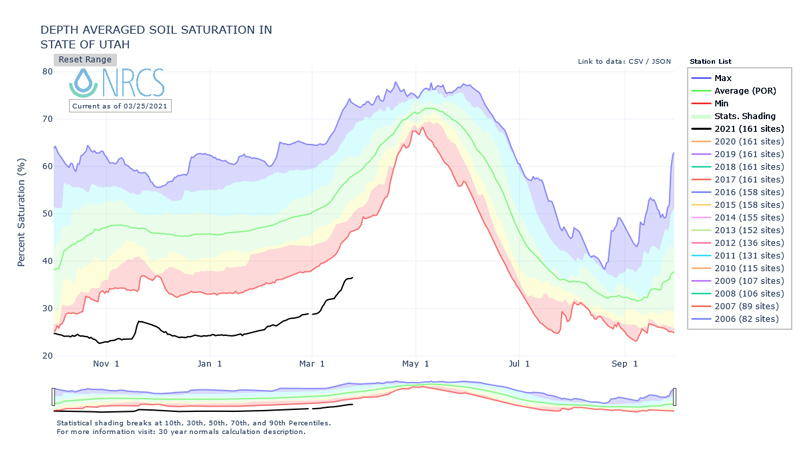
- Depleted soil moisture across the state remains well below historical normals for this time of year but has made up ground in the recent weeks. The state of depleted soil moisture has limited the ability of recent storms and near-normal snowpacks in certain basins to translate to similar boosts in streamflow forecasts, which remain low.
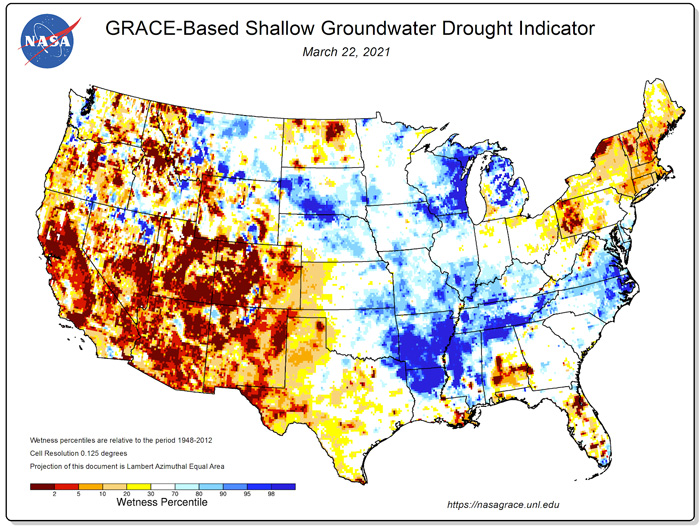
- GRACE observations suggest top-soil and root-zone soil moisture has responded well to recent storms while groundwater deficiencies remain mostly unaffected at this point.
Utah SNOTEL Snow Water Equivalent
Utah Depth of Averaged Soil Saturation
GRACE Shallow Groundwater Drought Indictor: March 22, 2021
Wyoming
- A heavy March storm provided moisture to the eastern plains, which led to improvements in drought conditions in those areas. While the storm provided a much-needed boost in moisture in parts, conditions are still tenuous and could slip further if additional moisture fails to continue.
- The precipitation outlook is for below-normal amounts while the temperature outlook has us expecting above-normal temperatures.
- Some infiltration into the soil column as the snow melts is helping soil moisture, but conditions are still very dry in the southwest, west, and northeast.
- Snowpack in all Wyoming basins is above 70% of median with all but 6 of 19 above 90%.
- Precipitation from about the beginning of the Water Year has ranged from about 2.5 inches above normal in the eastern plains to more than 2.5 inches below normal in the south central and most of the western mountains.
For More Information
More local information is available from the following resources:
Prepared By
Joel Lisonbee
NOAA/National Integrated Drought Information System (NIDIS)
Nancy J. Selover
Arizona State Climatologist/Arizona State University
Simon Wang and Jon Meyer
Utah Climate Center/Utah State University
Dave DuBois
New Mexico Climate Center/New Mexico State University
Peter Goble
Colorado Climate Center/Colorado State University
Tony Bergantino
Water Resources Data System, Wyoming State Climate Office
This drought early warning update is issued in partnership between the National Oceanic and Atmospheric Administration (NOAA) and the offices of the state climatologist for Arizona, Colorado, New Mexico, Utah, and Wyoming. The purpose of the update is to communicate a potential area of concern for drought expansion and/or development within the Intermountain West based on recent conditions and the upcoming forecast. NIDIS and its partners will issue future drought updates as conditions evolve.