Short-term drought improves. Long-term drought continues as winter snowpack will be crucial.
Key Points
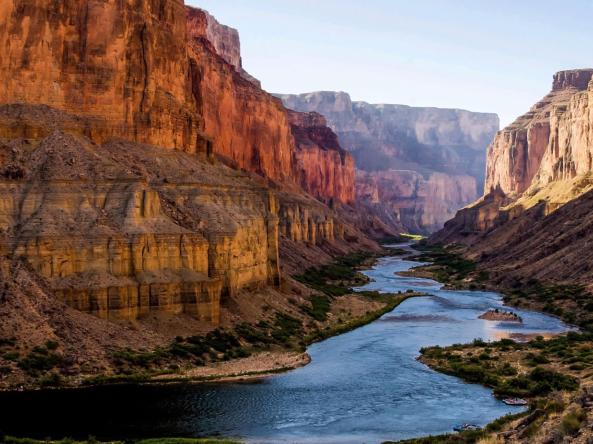
- The Southwest has been experiencing high rainfall totals during the monsoon season.
- Despite recent improvements to drought conditions, long-term drought remains.
- Warm and dry conditions are forecast for the Intermountain West this fall.
Current U.S. Drought Monitor map for the Intermountain West Drought Early Warning System region with data valid for August 24, 2021. The U.S. Drought Monitor is updated each Thursday to show the location and intensity of drought across the country.
Extreme (D3) to Exceptional (D4) drought persists across much of the Intermountain West.
U.S. Drought Monitor Categories
Current U.S. Drought Monitor map for the Intermountain West Drought Early Warning System region with data valid for August 24, 2021. The U.S. Drought Monitor is updated each Thursday to show the location and intensity of drought across the country.
Extreme (D3) to Exceptional (D4) drought persists across much of the Intermountain West.
Recent and Current Conditions
U.S. Drought Monitor Conditions
- Extreme (D3) to Exceptional (D4) drought persists, but has dropped to 35% of the Intermountain West (was 43% one month ago).
- Extreme (D3) drought conditions have been in place in this region since May 2020.
- The extent of D4 drought in the Intermountain West reached a peak of 45% area in December 2020, a new record for the region, and is currently at 9%.
- Moderate (D1) or worse drought has been in the region since August 2009.
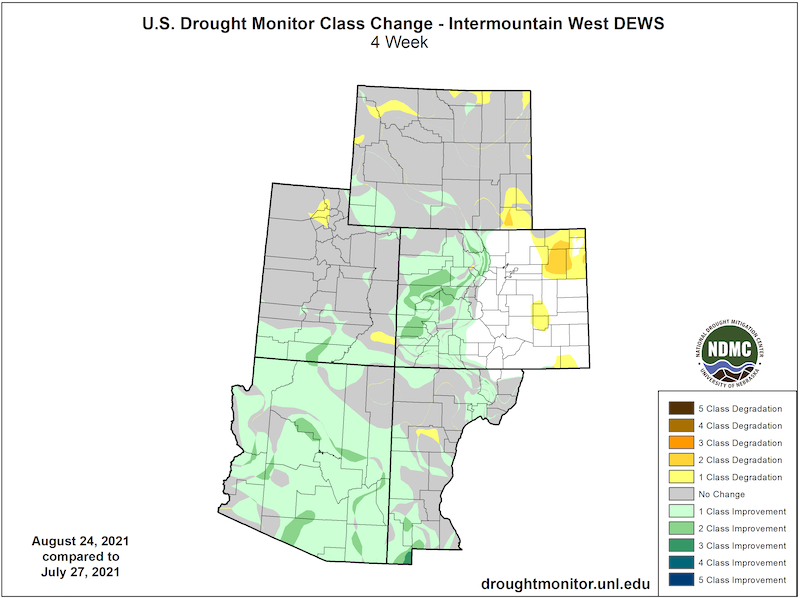
- Over the past four weeks, drought conditions have improved but remain in Arizona, New Mexico, southern Utah, and southwestern Colorado
- Despite the small improvement, Severe (D2) to Extreme (D3) drought remains in these places.
- Drought conditions have remained or deteriorated in Wyoming, Utah, and northeast Colorado.
U.S. Drought Monitor 1-Month Change Map
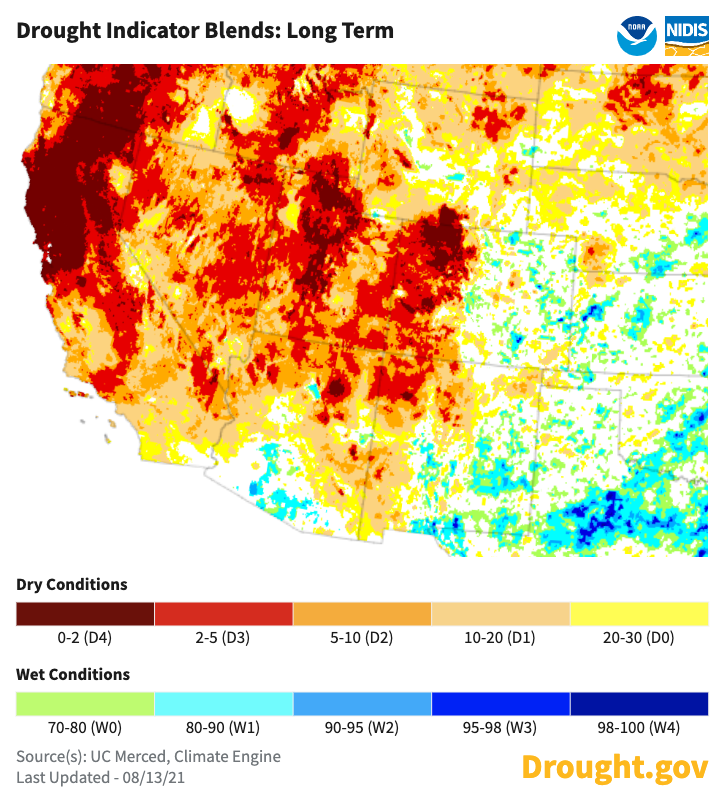
Long-Term Drought Persists
- Despite recent improvements, long-term drought persists in the Intermountain West
- Long-term indicator blends show extreme (D3) and exceptional (D4) drought across western Colorado, Utah, and northern Arizona and New Mexico.
Long-Term Drought Indicator Blend for the Intermountain West
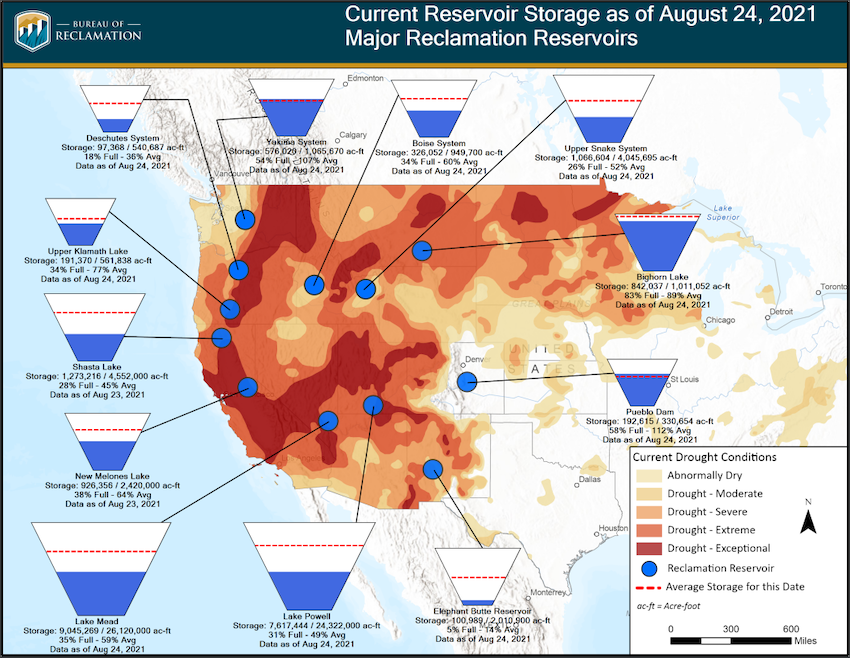
Major Bureau of Reclamation Reservoir Storage: August 24
Southwest Monsoon 2021
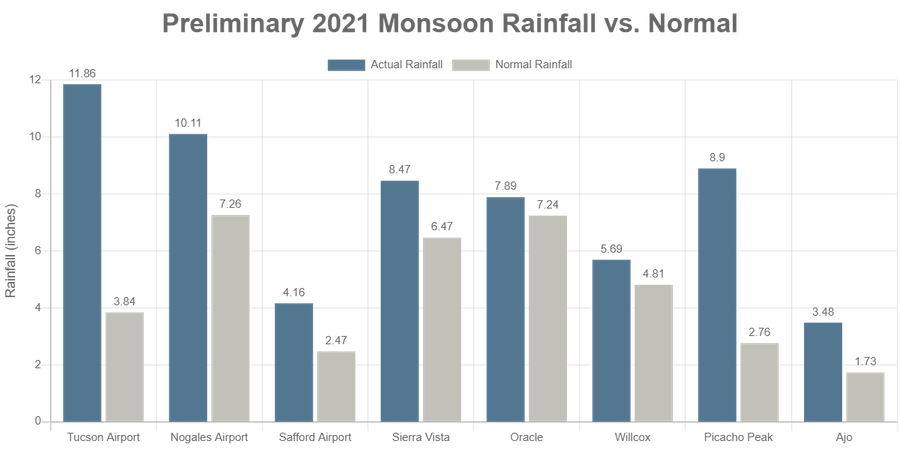
- Arizona measured its second wettest July on record, the wettest since 1919.
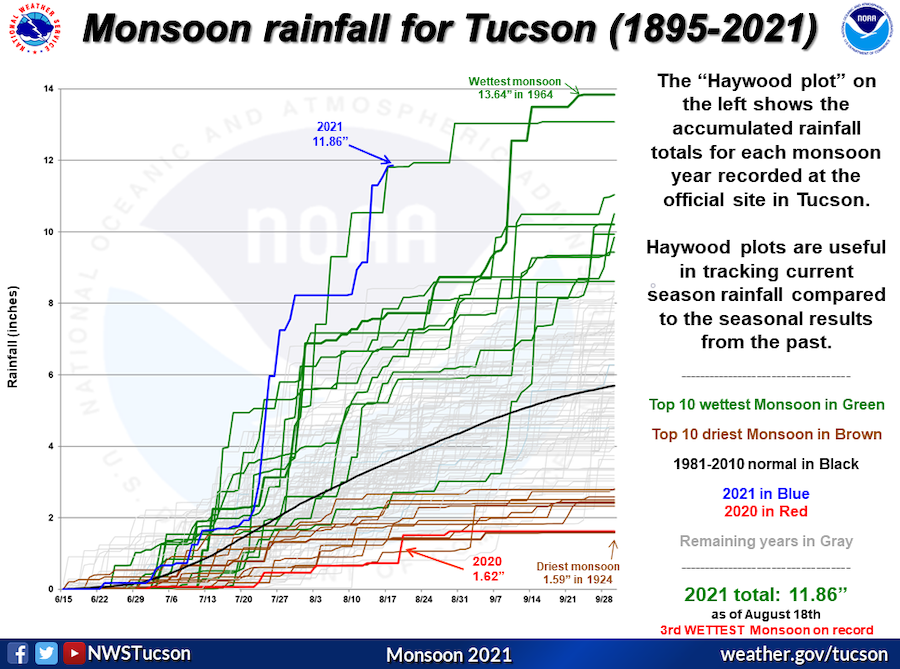
- Tucson Airport is approaching one foot of rainfall for the season and is currently at its third wettest monsoon season on record.
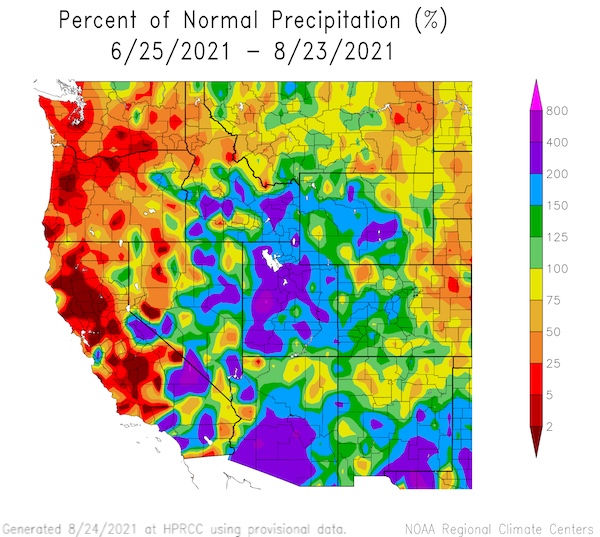
Southwest Monsoon Rainfall vs. Normal
Tucson Historical Monsoon Rainfall: 1895–2021
- Short-term forecasts show a continuation of monsoon conditions.
- Track the southwest U.S. Monsoon:
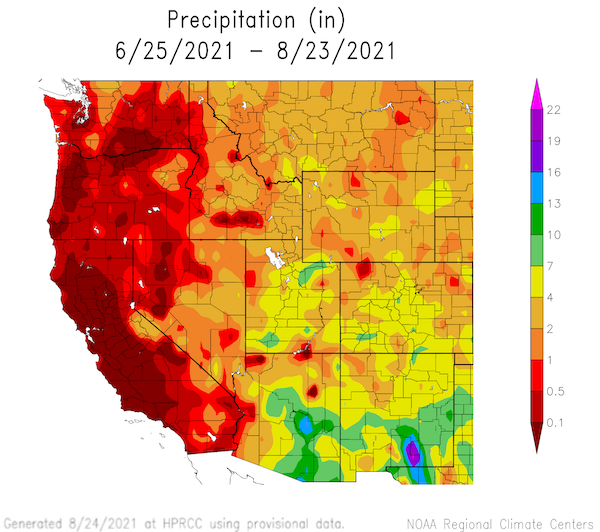
- Parts of New Mexico, Arizona, and Utah have received over double their normal precipitation for this time of year.
60-Day Precipitation Conditions
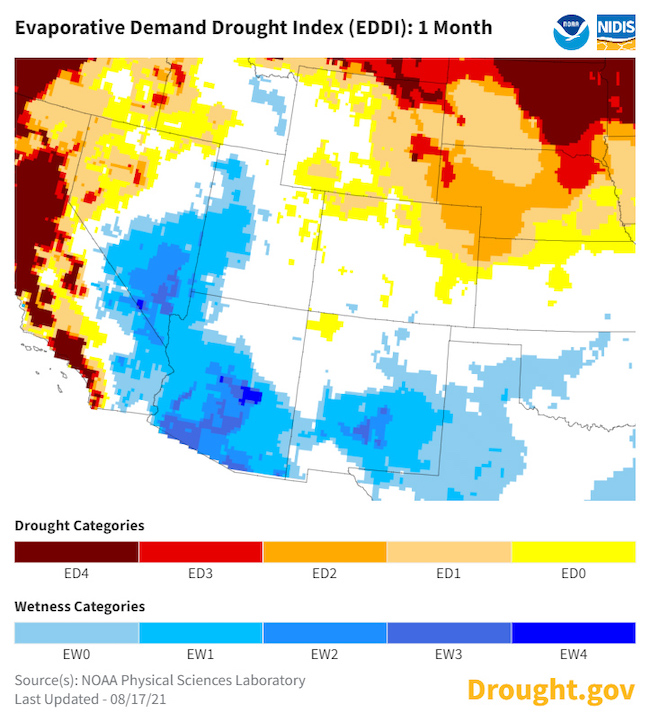
Evaporative Demand Drought Index (EDDI)
4-Week EDDI for August 17, 2021
EDDI values show increased wetness across most of the Intermountain West.
Observed EDDI, Last 4 Weeks
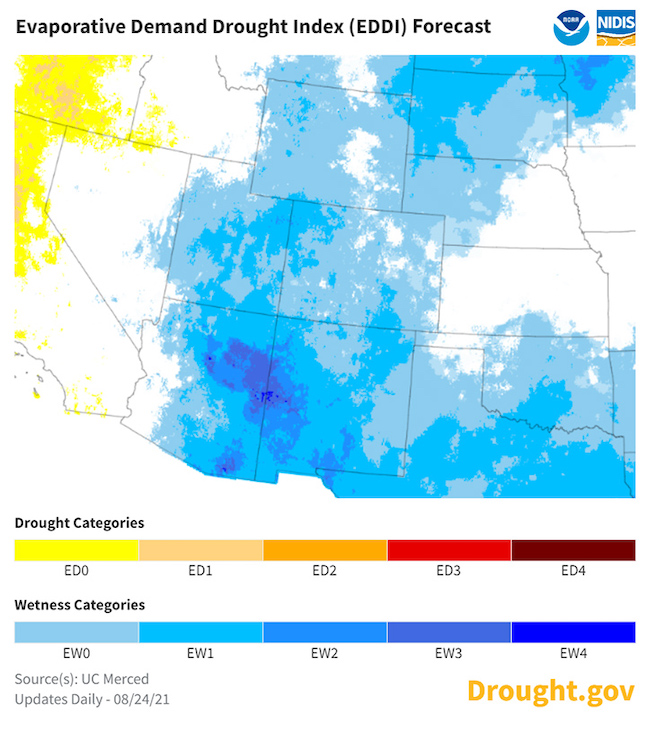
Forecast EDDI: Next 4 Weeks
Forecasts and Seasonal Outlooks
1-Month Outlook for September
A warm and dry September is likely for most of the West, including Utah, Wyoming, and western Arizona in the Intermountain West.
September 2021 Temperature Outlook
September 2021 Precipitation Outlook
3-Month Outlook for the Fall (September–November 2021)
A warm and dry fall is likely for the Intermountain West.
September–November 2021 Temperature Outlook
September–November 2021 Precipitation Outlook
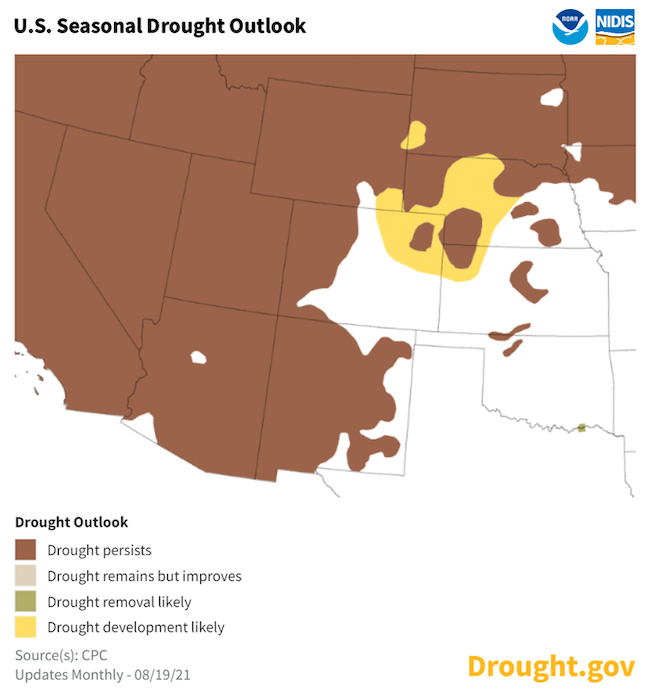
Seasonal Drought Outlook
Despite short-term drought improvement, the National Weather Service Climate Prediction Center's 3-month drought outlook shows drought continuing at least through November.
3-Month Drought Outlook
Climate Patterns: La Niña Watch
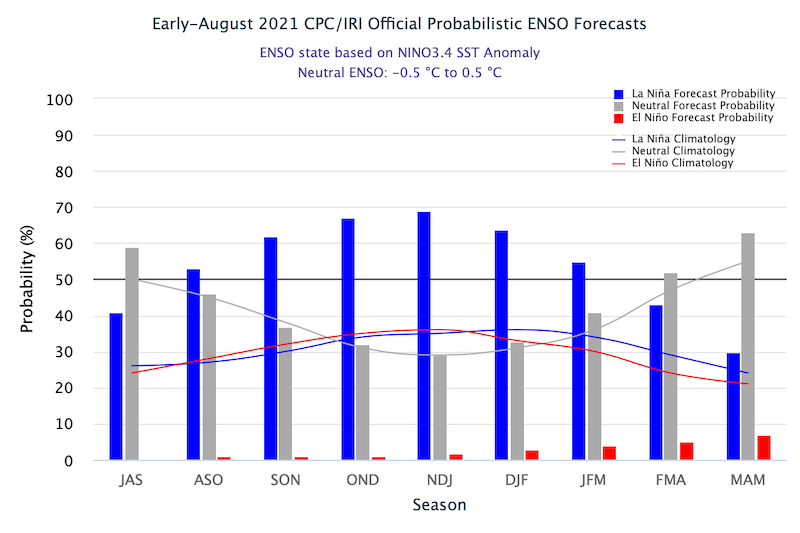
- NOAA’s El Niño–Southern Oscillation (ENSO) alert system status is currently at La Niña Watch—meaning the pacific is currently ENSO-neutral, but conditions are favorable for the redevelopment of La Niña within the next six months.
- La Niña usually correlates with below-normal winter precipitation in the Southwest U.S.
- For more information, please check out the NOAA ENSO blog.
Probability of El Niño, La Niña, or Neutral Conditions
State-Based Conditions and Impacts
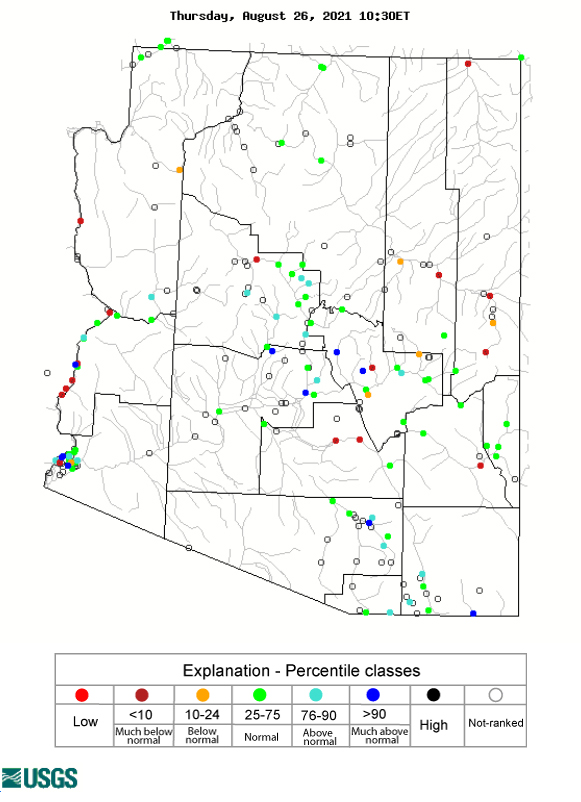
Arizona
- Drought conditions across most counties improved, with counties in the southeastern portion of the state improving by 2–3 categories of drought.
- Total system storage in the Salt and Verde river basin slightly improved as a result of runoff into reservoirs.
- There has been improvement in range and pasture lands.
- Lake Mead is operating under Tier 1 conditions.
Arizona Streamflow Conditions
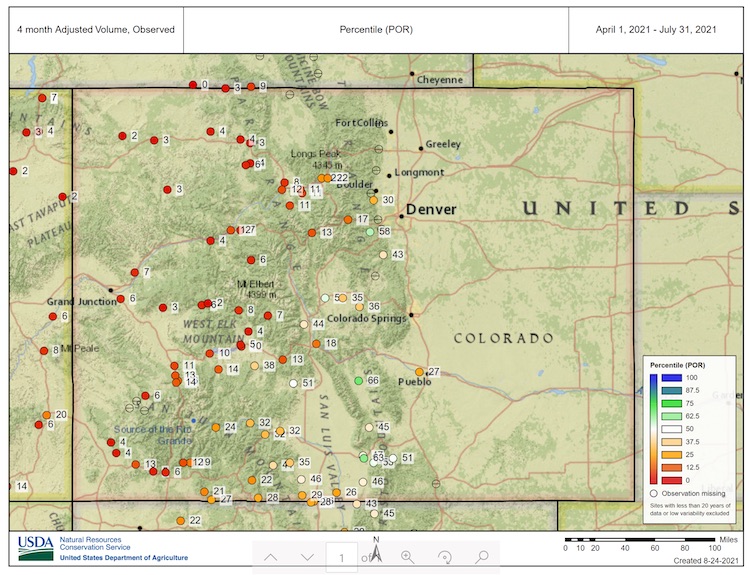
Colorado
- August brought a shift in weather patterns to Colorado. In recent months, precipitation has been above normal east of the Continental Divide and below normal west of the Continental Divide. This pattern was reversed in August. The eastern plains have been mostly hotter and drier than normal, and the west slopes have been mostly wetter than normal. There are a few large exceptions on the eastern plains. For instance, the Holyoke CoAgMET weather station received over 8 inches of precipitation in a 24 hour period.
- As we near the end of August, the growing season begins to wind down. The dry weather in July and August impacted winter wheat stands in eastern Colorado, with some crops achieving abnormally low weights. According to GrassCast, however, rangeland production was mostly above average, especially in southeast Colorado.
- Despite helpful monsoonal moisture, long-term drought and low reservoir supplies remain major concerns for western Colorado. Peak season streamflows were generally below the 10th percentile. Recent rains will not be enough to reverse deficits in water year cumulative flows. Blue Mesa Reservoir is forecast to retain record low storage through the cold season.
Colorado 4-Month Streamflow Percentiles
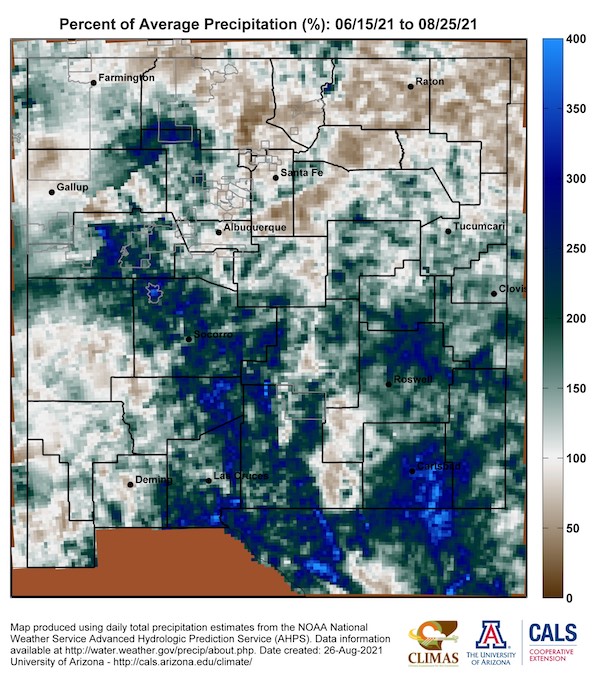
New Mexico
- Most of New Mexico has had average to above-average precipitation this summer, but precipitation has not been consistent across the state. Albuquerque, Santa Fe, Gallup, and Farmington have had a near-average monsoon this year.
- Ample winter snowpack will be needed to fill low reservoirs: Elephant Butte, 5% full; Caballo, 9% full; and Sumner, 22% full
New Mexico Precipitation Conditions
Utah
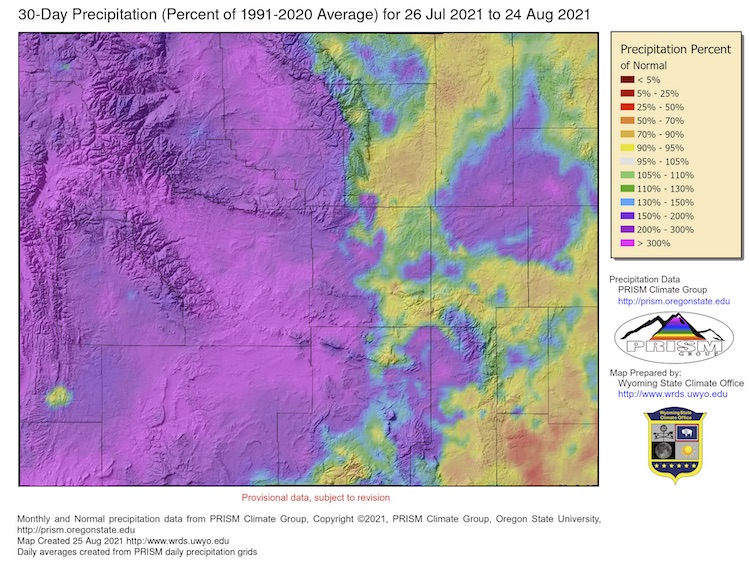
- After the 4th wettest July on record for the state, the last month of monsoonal rainfall has delivered 200%–400+% of normal precipitation to the majority of the state, with localized pockets exceeding 800% of normal.
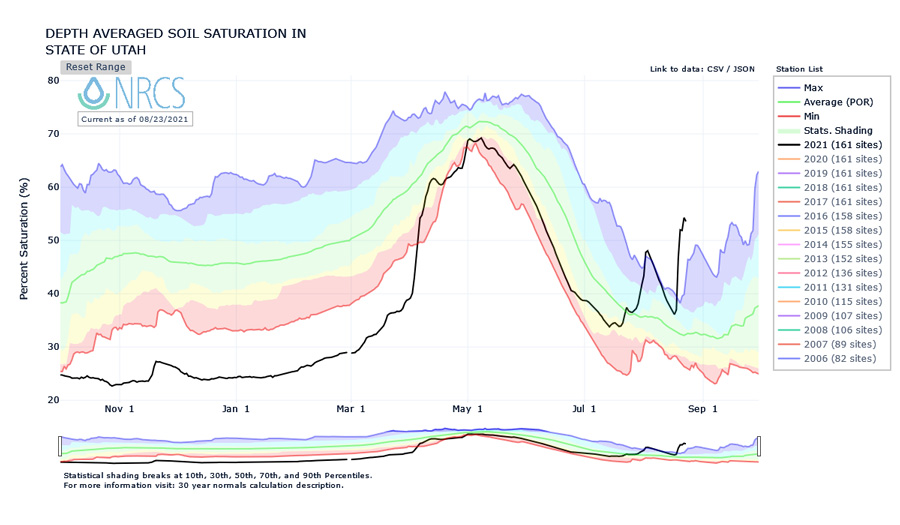
- The active monsoon has eased Utah’s meteorological drought and improved the short-term agricultural drought conditions as near-surface soil moisture has jumped to record levels for this time of year, although groundwater levels have not seen an appreciable increase.
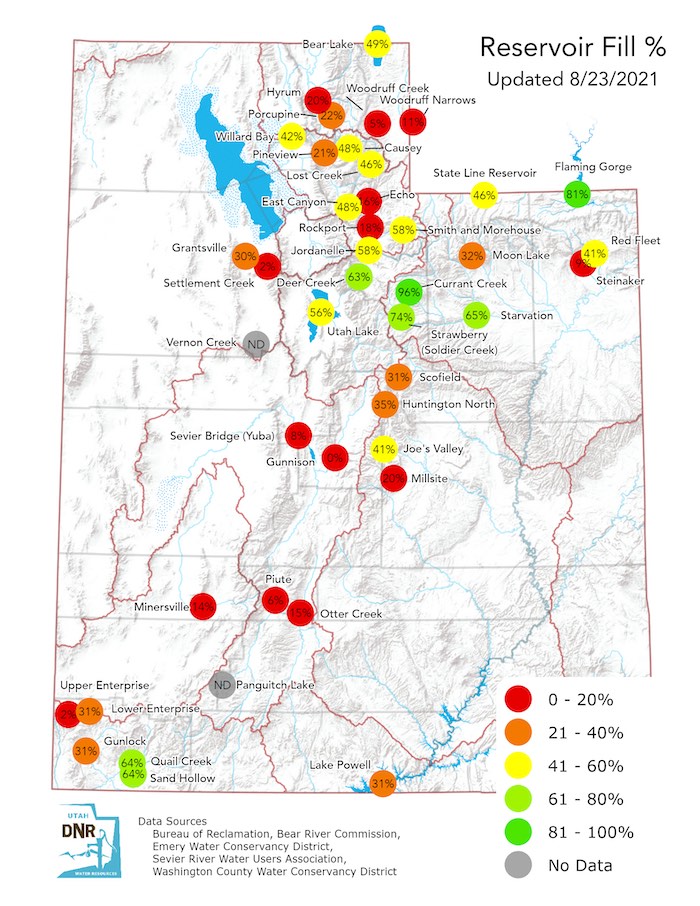
- Hydrologic drought remains a significant problem as medium and long-range streamflow forecasts will not benefit from the recent monsoon rainfall, and regional reservoirs continue to see decreasing levels (Lake Powell is at 31% of storage, down from 34% last month).
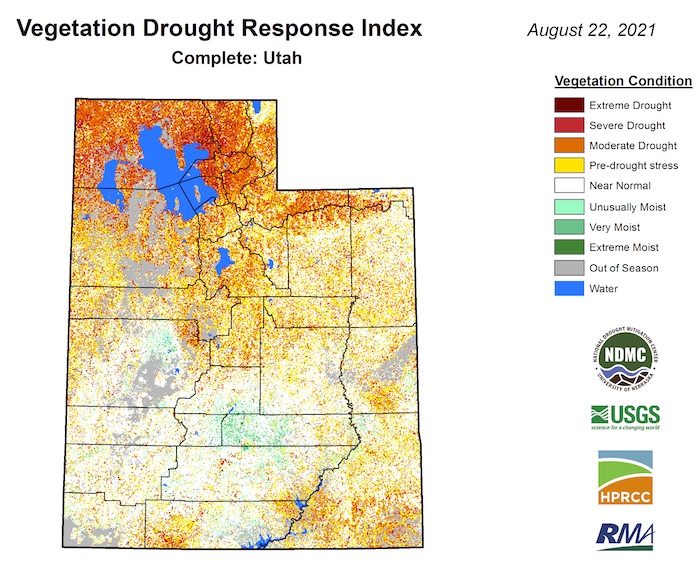
- Vegetative-based drought indices show noticeable improvements to the southern half of the state, but the northern half of the state continues to feature unhealthy growing conditions—this time of year should normally have limited vegetative growing conditions.
- The Great Salt Lake continues to dip farther into record low elevations and should continue to do so for the foreseeable future, as the lake levels will have a long-term lag in response to the current drought conditions.
- Concern remains that the seasonal outlook for dry fall and winter conditions will further exacerbate the long-term drought and erase any positive hydrologic contribution the monsoon has had on soil moisture, which needs to be retained ahead of the snowpack growth to avoid another failed spring runoff.
Utah Soil Moisture Conditions
Vegetation Drought Response Index (VegDRI)
Utah Reservoir Conditions
Wyoming
- Average maximum temperatures over the last 30 days have been below average by up to 3 °F in much of western Wyoming while the east has been around up to 3 °F above the average. Average mean temperatures have generally been up to 3F above average with some cooler spots in the far west.
- Precipitation over the last 30 days
- Above average in the western half of the state with totals being 200% to 300% above the 1991-2020 average. Parts of east central Wyoming are just below that.
- Laramie County in the southeast has been the farthest below average where large parts were under 50% of the average.
- Soil moisture has improved in the last month in many parts of the state, most notably in the northwest where precipitation has brought about a quarter of the state to above the 20th percentile. The northeast and parts of the southwest remain at less than the 2nd percentile.
- Drought conditions are similar to where they were last month with a few changes having been made over the last 30 days. There have been slight expansions in north central and southeast Wyoming while parts of Sweetwater, Uinta, and Lincoln Counties in the southwest have gone from D3 to D2 conditions. Currently less than a quarter of a percent of the state is not in any of the D0-D4 categories and almost 95% of Wyoming is in D1 or worse. This is the largest percentage of Wyoming that has been in D1-D4 since the 5th of February 2013.
30-Day Percent of Normal Precipitation
For More Information
More local information is available from the following resources:
In Case You Missed It
- August 24, 2021: Southwest Drought Briefing
Upcoming Events
- September 16, 2021: Southwest Drought Briefing. More details to come.
- September 27, 2021: California-Nevada Drought and Climate Outlook Webinar
Prepared By
Joel Lisonbee
NOAA/National Integrated Drought Information System (NIDIS)
Erin Saffell
Arizona State Climatologist/Arizona State University
Erin Boyle
Service Hydrologist, National Weather Service, Tucson, Arizona
Peter Goble
Colorado Climate Center/Colorado State University
Jon Meyer
Utah Climate Center/Utah State University
Tony Bergantino
Water Resources Data System – Wyoming State Climate Office
Greg Heavener
Warning Coordination Meteorologist, National Weather Service, Pueblo, Colorado
This drought status update is issued in partnership between the National Oceanic and Atmospheric Administration (NOAA), and the offices of the state climatologist for Arizona, Colorado, New Mexico, Utah and Wyoming. The purpose of the update is to communicate a potential area of concern for drought expansion and/or development within the Intermountain West based on recent conditions and the upcoming forecast. NIDIS and its partners will issue future drought status updates as conditions evolve.