Another La Niña lowers the chance for a wet winter ahead.
Key Points
- Extreme drought conditions continue in the Intermountain West, and abnormally dry conditions have developed in Colorado.
- One of the wettest monsoon seasons on record for the Southwest ended with a lackluster September.
- There is a 70%–80% chance that another La Niña will develop this winter.
- This usually means less snow for the Southwest.
Current U.S. Drought Monitor map for the Intermountain West Drought Early Warning System region with data valid for September 28, 2021. The U.S. Drought Monitor is updated each Thursday to show the location and intensity of drought across the country.
Extreme (D3) to Exceptional (D4) drought persists across much of the Intermountain West.
U.S. Drought Monitor Categories
Current U.S. Drought Monitor map for the Intermountain West Drought Early Warning System region with data valid for September 28, 2021. The U.S. Drought Monitor is updated each Thursday to show the location and intensity of drought across the country.
Extreme (D3) to Exceptional (D4) drought persists across much of the Intermountain West.
Recent and Current Conditions
U.S. Drought Monitor Conditions
- Extreme (D3) to Exceptional (D4) drought persists, but has dropped to 34% of the Intermountain West.
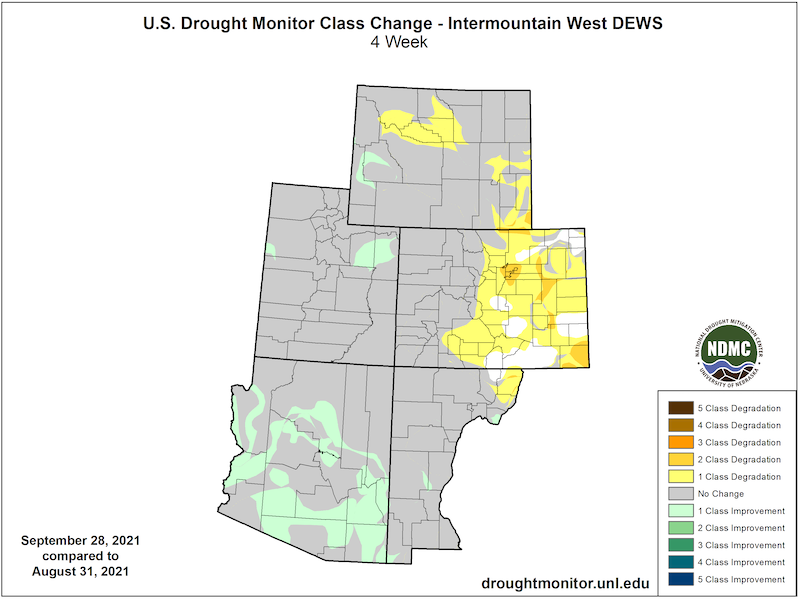
- Over the past four weeks, drought conditions have improved but remain in Arizona, New Mexico, and western Utah.
- Despite the small improvement, Severe (D2) to Extreme (D3) drought remains in Arizona and New Mexico.
- Exceptional (D4) drought remains in Utah and Colorado.
- Drought conditions have remained or deteriorated in eastern Colorado and southeast Wyoming.
U.S. Drought Monitor 1-Month Change Map
Southwest Monsoon 2021
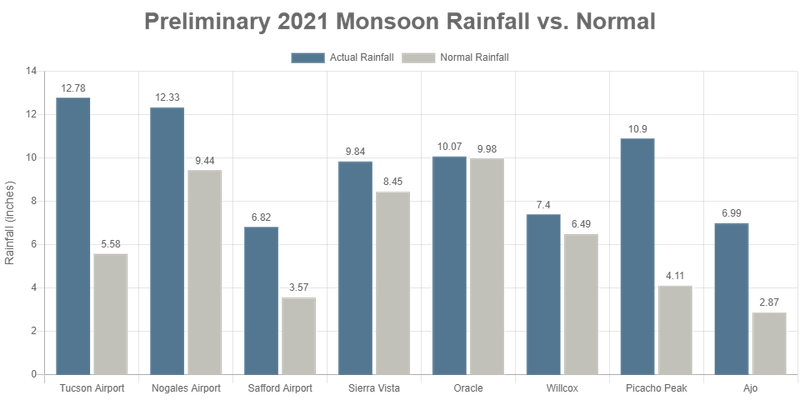
- Arizona measured its second wettest July on record—the wettest since 1919—followed by an average August.
- Tucson, Nogales, and other locations exceed one foot of rainfall for the season.
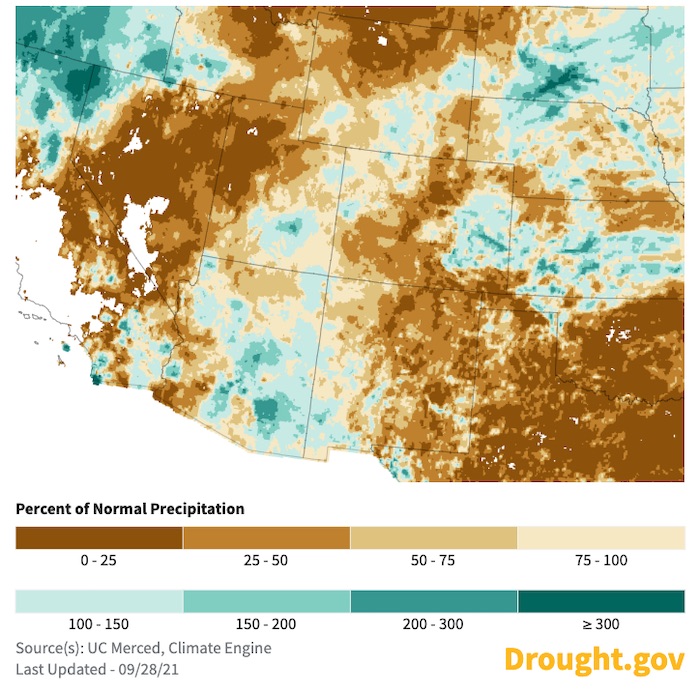
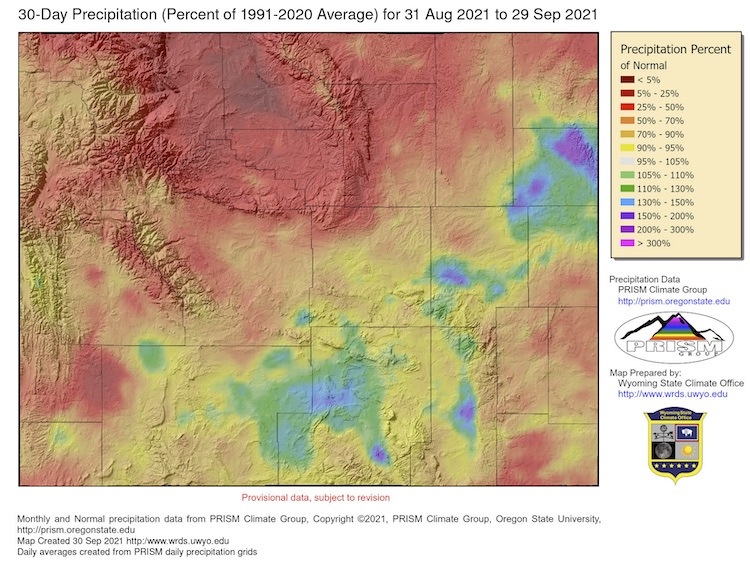
- September precipitation has been average to below average for most of the Intermountain West region.
- Track the Southwest U.S. Monsoon:
2021 Southwest Monsoon Rainfall vs. Normal
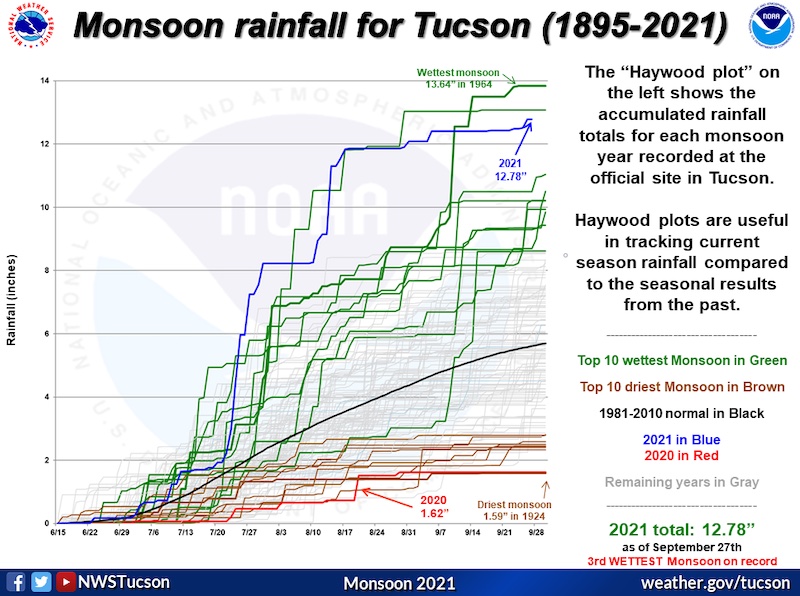
Tucson Historical Monsoon Rainfall: 1895–2021
30-Day Percent of Normal Precipitation
Forecasts and Seasonal Outlooks
Climate Patterns: La Niña Watch
- NOAA’s El Niño–Southern Oscillation (ENSO) alert system status is currently at La Niña Watch—meaning a transition from ENSO-neutral to La Niña is favored in the next couple of months.
- La Niña usually correlates with below-normal winter precipitation in the Southwest U.S.
- Seasonal forecasts also show a drying pattern across the Southwest, consistent with a La Niña pattern.
3-Month Outlook (October–December 2021)
A warm and dry autumn is likely for the Intermountain West.
October–December Temperature Outlook
October–December Precipitation Outlook
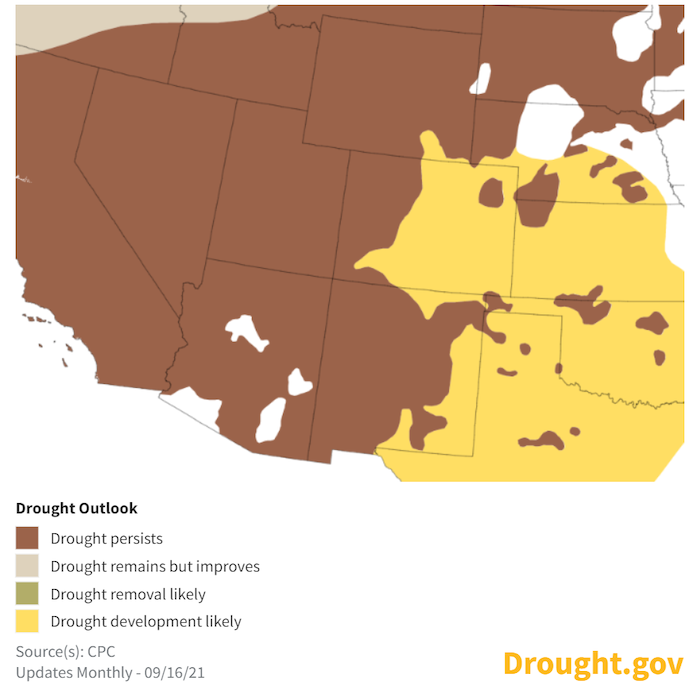
Seasonal Drought Outlook
Despite short-term drought improvement, the 3-month drought outlook shows drought continuing at least through the end of the year.
U.S. Drought Outlook: September 16–December 31, 2021
State-Based Conditions and Impacts
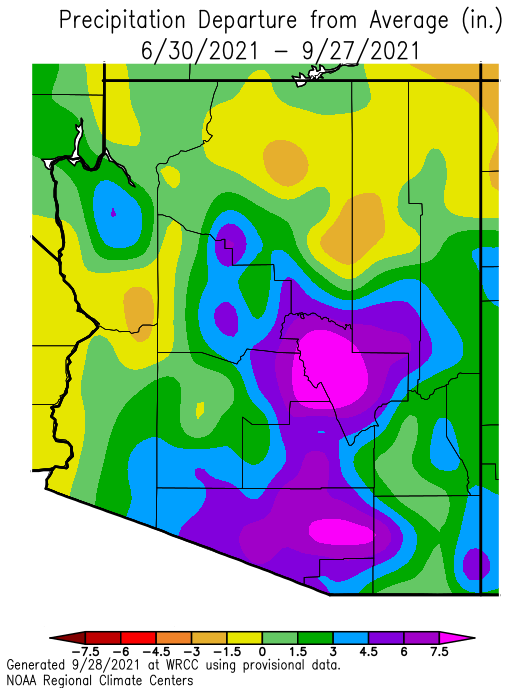
Arizona
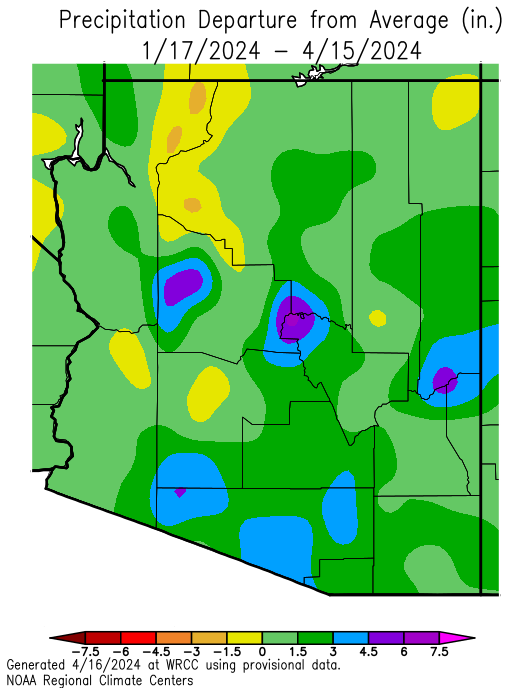
- After an impressive early monsoon, September precipitation largely returned to normal or below-normal amounts across the state. Still, the monsoon precipitation will end the season at above-average levels in Arizona.
- Range and pastureland vegetation continued to improve; however, increased growth has potentially contributed to increased wildland fire fuel.
- The wind regime started transitioning to westerly patterns near September 10. Precipitation events later in September largely occurred from cyclonic activity.
Arizona 90-Day Departure from Average Precipitation
Colorado
- September has been a much warmer than normal month for Colorado. The eastern plains have been 3–5 degrees above normal over the last 30 days. Warm conditions in September can be advantageous for finishing late season crops, but summer moisture was low.
- Conditions have degraded on the eastern plains. Akron, CO had its driest summer on record. Due to a wet spring, however, Akron still had a wetter-than-normal water year.
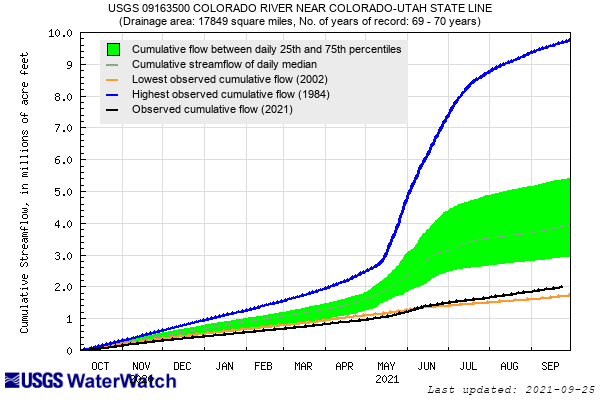
- Monsoonal rains improved conditions in western Colorado, but hydrological drought remains. Cumulative streamflows on major rivers exiting the state will still be in the bottom quartile for the water year, and baseflows have not recovered to normal levels. Reservoir storage statewide will also be below normal this winter, meaning above-normal snowpack will be necessary this winter to break out of drought.
Cumulative Streamflow Conditions
Utah
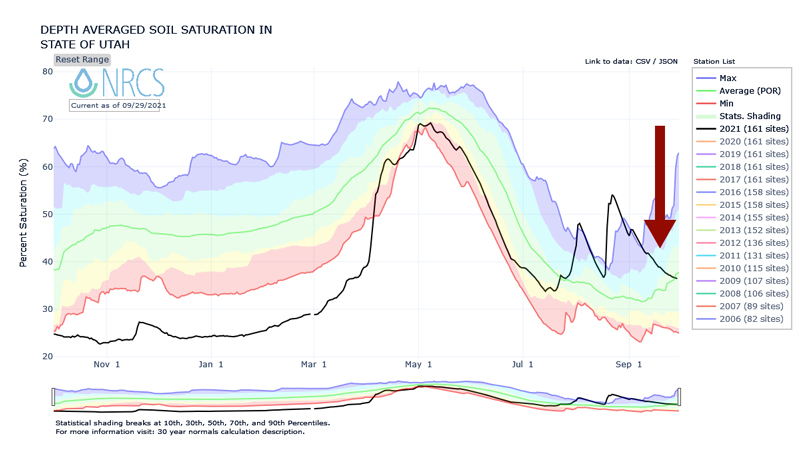
- A warm and generally dry month of September has led to a loss of much of the soil moisture gained during late July and August monsoon rainfall. Following record high soil moisture to start the month, the state looks to end September with near-normal soil moisture for this time of year.
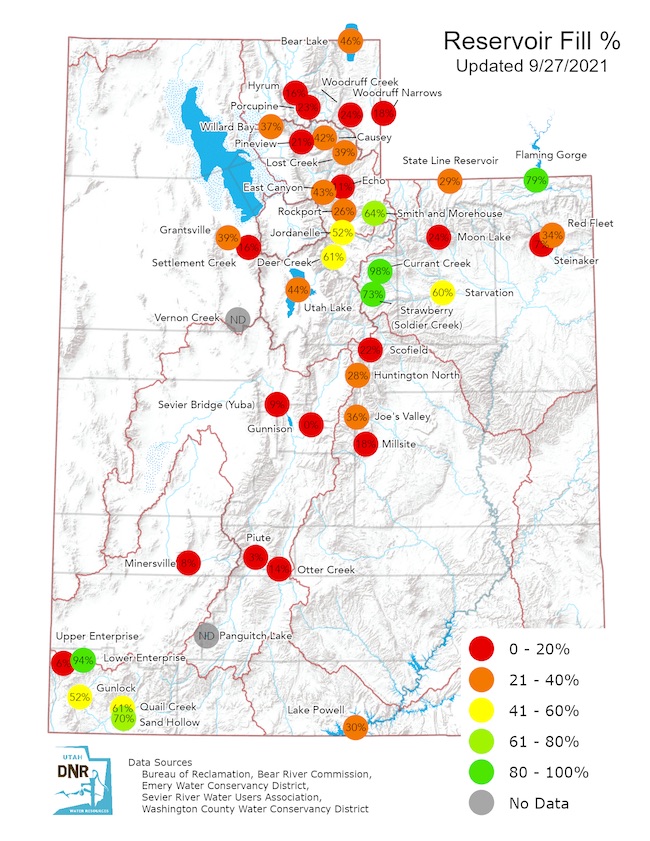
- Reservoir levels remain exceptionally depleted across the state with approximately 3 out of 4 reservoirs below 50% capacity. Lake Powell has continued to drop in September and now sits at 30% capacity, while the Great Salt Lake continues to drop deeper into record low levels.
- Drought metrics show little change in drought stress to vegetation or evaporative demand over the month of September. Status quo for drought classification is the expected path forward for the Fall months.
Utah Soil Moisture Conditions
Utah Reservoir Conditions
Wyoming
- Wyoming has had two snow events in the higher elevations around the state since September 20.
- Temperatures:
- Average temperatures across the state have been generally 3 to 6 degrees Fahrenheit above average east of the Divide and up to 3 degrees Fahrenheit above average west of the Divide over the last 30 days.
- Minimum temperatures were average to 3 degrees Fahrenheit above average statewide, with some areas 3 to 6 degrees Fahrenheit above normal in the east and eastern flanks of the Wind River and Bighorn Ranges. Some scattered areas in the west and south-central parts of the state were as much as 3 degrees Fahrenheit below average.
- Precipitation has been above average in south-central Wyoming as well as parts of the northeast, but the remainder of the state has been below to well below average, especially in the north.
- A flash drought appears to be emerging in the north and north-central part of the state affecting the Bighorn Basin, with precipitation in the area at 50% of average over the last 30 days and some areas under 10% of average over that period. This, coupled with temperatures up to 6 degrees Fahrenheit above average, has led to a rapid deterioration of conditions there, with Severe (D2) and Extreme (D3) drought conditions expanding in the last week.
Wyoming 30-Day Percent of Normal Precipitation
For More Information
More local information is available from the following resources:
In Case You Missed It
- September 16, 2021: Southwest Drought Briefing
- September 21–22, 28–29, 2021: Southwest Drought Forum
- New Video: Living With Drought and Increasing Aridification in the Southwest
Upcoming Events
- October 26, 2021: Southwest Drought Briefing
Prepared By
Joel Lisonbee
NOAA/National Integrated Drought Information System (NIDIS)
Erin Saffell
Arizona State Climatologist/Arizona State University
Erin Boyle
Service Hydrologist, National Weather Service, Tucson, Arizona
Peter Goble
Colorado Climate Center/Colorado State University
Jon Meyer
Utah Climate Center/Utah State University
Tony Bergantino
Water Resources Data System – Wyoming State Climate Office
This drought status update is issued in partnership between the National Oceanic and Atmospheric Administration (NOAA), and the offices of the state climatologist for Arizona, Colorado, New Mexico, Utah and Wyoming. The purpose of the update is to communicate a potential area of concern for drought expansion and/or development within the Intermountain West based on recent conditions and the upcoming forecast. NIDIS and its partners will issue future drought status updates as conditions evolve.
