Drought Crisis Continues With Record Low Water Levels at Lake Powell and the Largest Recorded Wildfire in New Mexico History
Key Points
- Extreme and exceptional drought conditions to continue in the Intermountain West for the third summer in a row.
- Upper Colorado River SWE is currently at 54% of median for this time of year with about a month left in the melt season.
- Exceptional drought expanded in New Mexico, where the fire season is in full swing. With over 311,000 acres burned, the Hermits Peak/Calf Canyon Fire Complex is now the largest in modern records for the state of New Mexico.
Current U.S. Drought Monitor map for the Intermountain West Drought Early Warning System (DEWS) region with data valid for May 17, 2022. The U.S. Drought Monitor is updated each Thursday to show the location and intensity of drought across the country.
31.87% of the Intermountain West DEWS region is experiencing extreme to exceptional drought (D3–D4).
U.S. Drought Monitor Categories
Current U.S. Drought Monitor map for the Intermountain West Drought Early Warning System (DEWS) region with data valid for May 17, 2022. The U.S. Drought Monitor is updated each Thursday to show the location and intensity of drought across the country.
31.87% of the Intermountain West DEWS region is experiencing extreme to exceptional drought (D3–D4).
Current Drought Conditions and Outlook
U.S. Drought Monitor Conditions
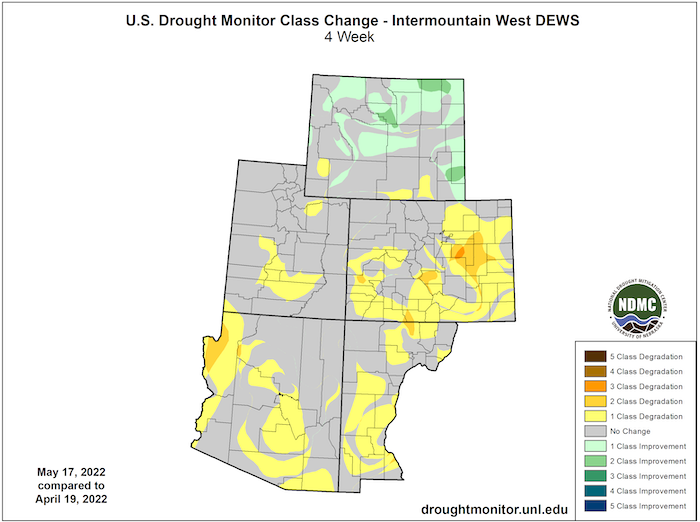
- There has been little change in drought conditions across the Intermountain West.
- Exceptional (D4) drought exists in the region in northeastern and southern New Mexico, southeastern Colorado, and has recently expanded into western Arizona.
- 32% of the region is experiencing extreme (D3) drought or worse.
- Extreme (D3) drought conditions have been in place in this region since May 2020.
- Moderate (D1) or worse drought has been in the region since August 2009.
U.S. Drought Monitor 4-Week Change Map
Current Snow Water Equivalent (SWE)
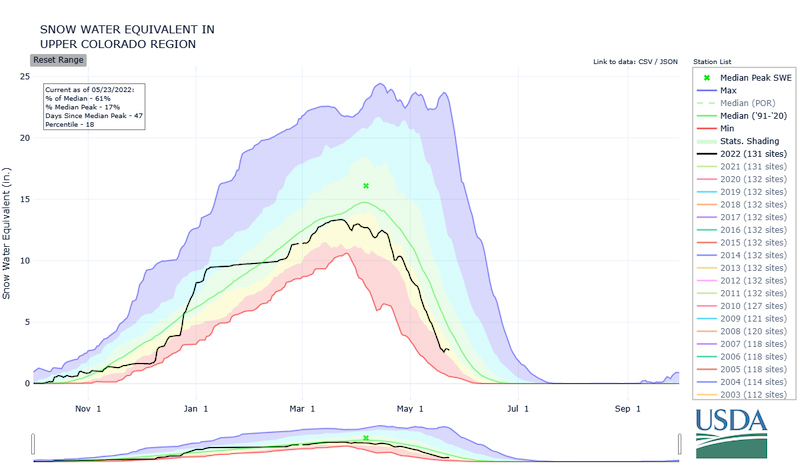
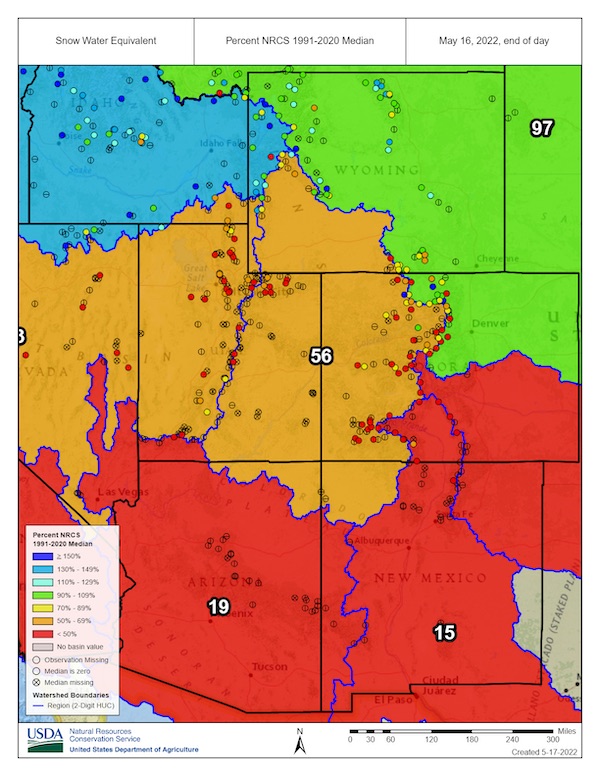
- Upper Colorado River SWE is currently at 54% of median for this time of year with about a month left in the melt season.
- Snowpack usually reaches its peak accumulation on April 6 in the Upper Colorado River Basin.
- The April and May melt period remained just below the long-term median. April–July water supply volume forecasts are near- to much-below average across the Upper Colorado River Basin. Mid-April Upper Colorado River Basin water supply guidance generally ranges between 45%–100% of the 1991–2020 historical average.
- Snowmelt across the West has begun a little earlier than usual.
Snow Water Equivalent: Upper Colorado
Snow Water Equivalent Percent of Median
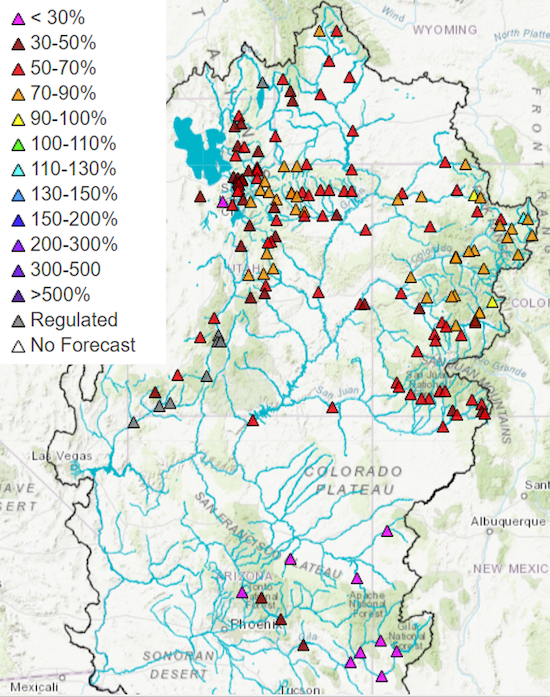
April–July Runoff Volume Guidance
Forecasts and Seasonal Outlooks
June 2022
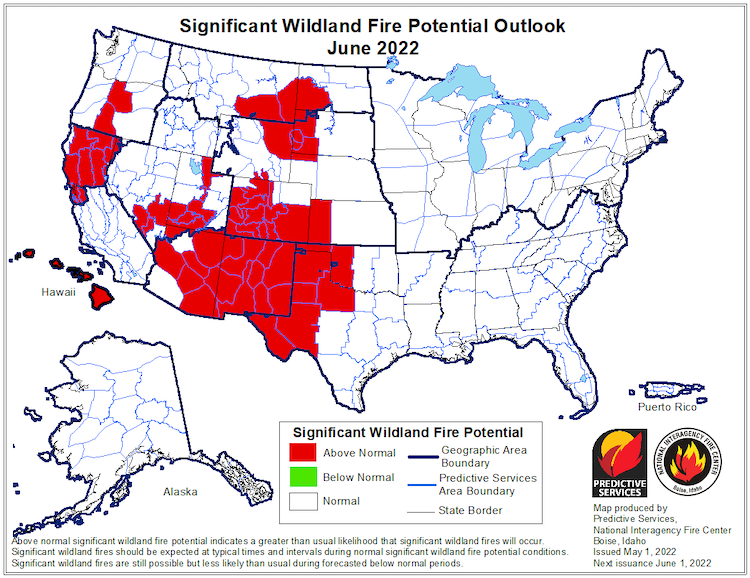
Fire risk is elevated for drought-stricken areas of the Intermountain West:
- Elevated fire risk is forecast to persist through at least June.
- Significant wildland fire potential is forecast for all of New Mexico, much of Arizona, southern Colorado, southern Utah, Utah's Wasatch Mountains, and northeastern Wyoming.
Significant Wildland Fire Potential Outlook: June 2022
According to the Climate Prediction Center's monthly outlook for June:
- Increased temperatures are likely across the whole Intermountain West region, with the highest odds over New Mexico and southern Colorado.
- Odds favor below-normal monthly precipitation for northern Utah and most of Wyoming, Colorado, and eastern New Mexico.
June 2022 Temperature Outlook
June 2022 Precipitation Outlook
3-Month Outlook for June–August 2022
Seasonal forecasts show a hot and dry season ahead for the Intermountain West, but hint at an active Southwest Monsoon through August:
- Odds favor increased temperatures through the remainder of summer 2022 for the Intermountain West region.
- Lower-than-normal precipitation is more likely than not for northern Wyoming, and odds slightly favor a drier-than-average season for northern Utah, most of Colorado, and eastern New Mexico.
- Summer is usually the driest time of the year for northern Utah and northern Colorado.
- The Southwest Monsoon usually runs from June 15 through September 30, and monsoonal rainfall is highly variable throughout the season.
Three-Month Temperature Outlook: June–August 2022
Three-Month Precipitation Outlook: June–August 2022
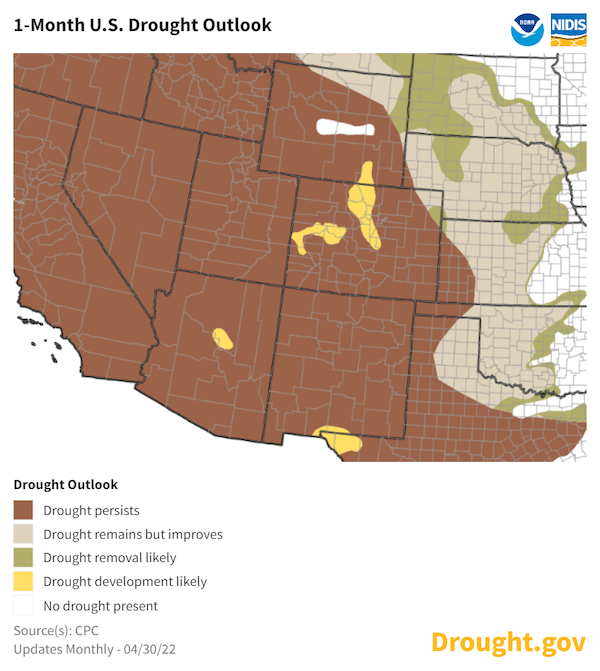
Seasonal Drought Outlook
- Drought is expected to continue for the Intermountain West through summer.
- June, July, and August are typically the driest months of the year for northern Utah and northern Colorado. It would be unusual for drought to be removed in these regions in the summer.
May 2022 Monthly Drought Outlook
La Niña Persists and May Impact Winter Weather
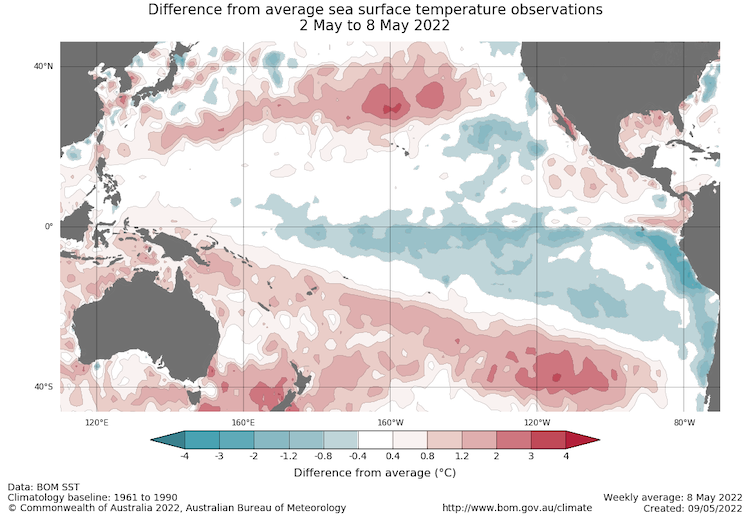
- One of the primary drivers of drought across the Southwest through winter and spring was a La Niña pattern in the Pacific.
- The May 16 weekly NINO3.4 value was −1.1 °C, indicating a La Niña pattern persists in the central Pacific.
- La Niña patterns do not usually persist into northern-hemisphere summer months, but the few historical events that have persisted experienced increased precipitation in Arizona and decreased precipitation in New Mexico in early summer, with no strong pattern in late summer. No two La Niña patterns are the same.
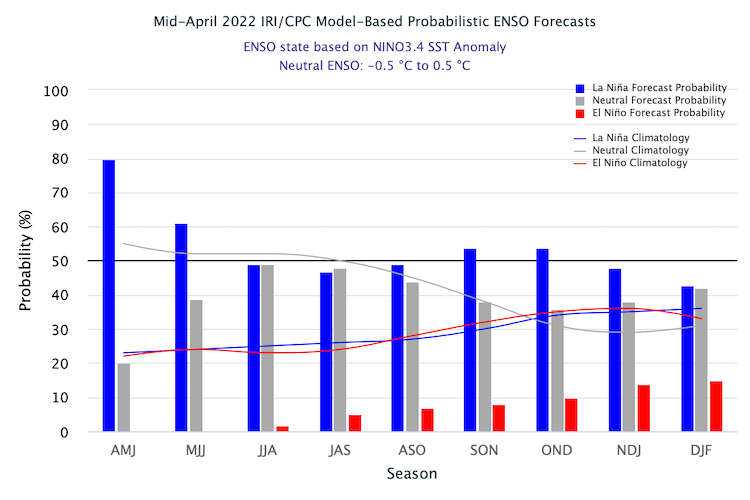
- The latest forecasts for winter 2022–23 indicate that another La Niña is slightly more likely to occur than a neutral pattern this winter, and an El Niño is unlikely. This means another dry winter is possible for the Southwest.
- For more information, please check out the NOAA El Niño–Southern Oscillation (ENSO) blog.
Sea Surface Temperature Anomalies (°C) for May 2–8, 2022
Probability of El Niño, La Niña, or Neutral Conditions
State-Based Conditions and Impacts
Arizona
- Exceptional (D4) drought returned in western Arizona (3% of the state). Extreme (D3) drought expanded to 18% of the state, moving deeper along western and southeastern Arizona and remaining in northeastern Arizona. The majority of the state (77%) is experiencing severe (D2) or moderate (D1) drought.
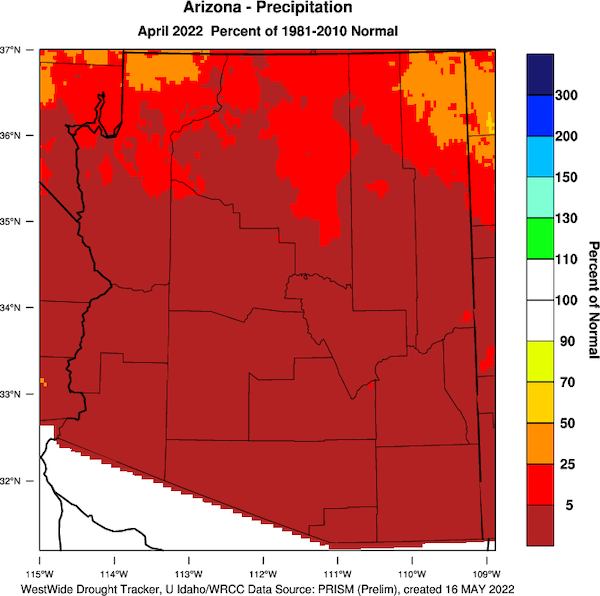
- April was the 6th driest April on record for the state, with only 0.04 inches of precipitation received largely in the north-central portion of the state (the statewide mean for April is 0.57 inches). The majority of the state had no measurable precipitation in April.
- Statewide temperatures remained warmer than normal for April, with central and southern counties ranking in their top ten warmest April temperatures.
April 2022 Percent of Normal Precipitation
Colorado
- April temperatures for Colorado were near normal.
- April was much drier and windier than normal as storm activity consistently missed to the north.
- Wind: Notwithstanding the shorter and sparser historical data record for wind when compared with temperature and moisture, it was the windiest April (and month in general) for some of Colorado’s mesonet sites.
- Northeast Colorado was the epicenter of anomalously windy conditions in the state.
- Precipitation: The statewide average precipitation total for April was 0.74 inches, making it the 5th driest April on record for the state.
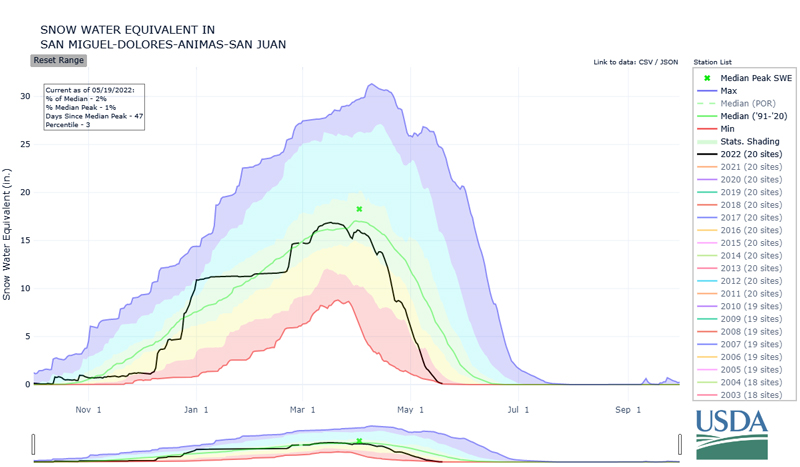
- Snowmelt rates have been higher than normal for southern Colorado.
- San Juan SNOTEL-measured snowpack was much higher than 2002 or 2018 (the two lowest years on record), but disappeared just as fast due to high temperatures, wind, and dust on snow.
- Timely early May snow has kept melt rates closer to normal in northern Colorado. We continue to watch the snowmelt cycle closely as early snowmelt is correlated with significant summer wildfires.
- May has started warmer than normal, but large changes are on the way. A potential hard freeze on Sunday, May 22 could damage crops, gardens, and small trees. If this happens and drought persists, it could impact agricultural yields later. Freeze impacts may end up conflated with drought impacts down the line.
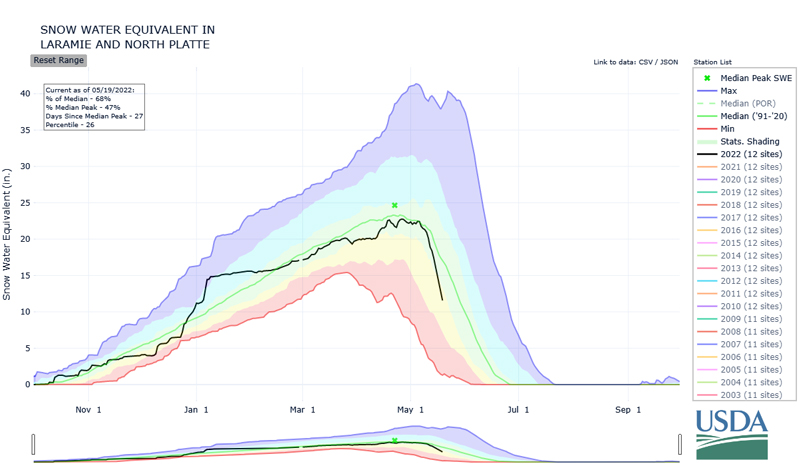
Snow Water Equivalent (SWE) for the North Platte and San Juan Basins
New Mexico
- Statewide, April 2022 tied April 1991 as the second driest April on record with only 0.06 inches of precipitation, all of which was confined to the northern counties. April 2022 was also the 11th warmest April on record and the warmest since 2012.
- With over 311,000 acres burned, the Hermits Peak/Calf Canyon Fire Complex is now the largest in modern records for the state of New Mexico.
- As of May 19, reservoir storage along the Rio Grande and Pecos River Basins are very low. Along the Rio Grande, Elephant Butte is at 13% full, and Caballo is at 14% full. On the Pecos River, Sumner is at 32%, Brantley is at 46%, and Avalon is at 20%.
Utah
- Southern Utah continues to experience worsening drought conditions from lack of precipitation and high evaporative demand.
- Snowpack across the state is nearly gone at all but the highest elevations in pockets of the state’s mountains.
- Recent precipitation events have benefited northern Utah, but statewide Standardized Precipitation Index (SPI) rankings remain below seasonal normals.
- The majority of reservoirs have seen year-over-year reductions while streamflow remains underwhelming.
- Urban water restrictions are beginning to be implemented across the state while agricultural sectors see water rationing and limited permitting.
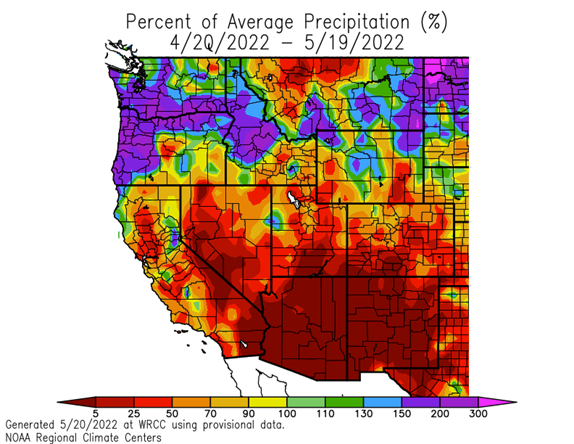
Percent of Average Precipitation: April 20–May 19
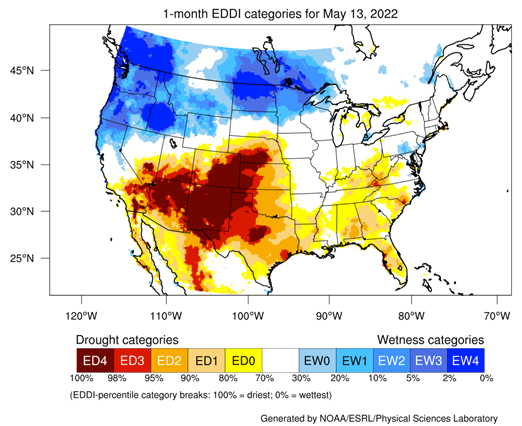
Evaporative Demand Drought Index (EDDI)
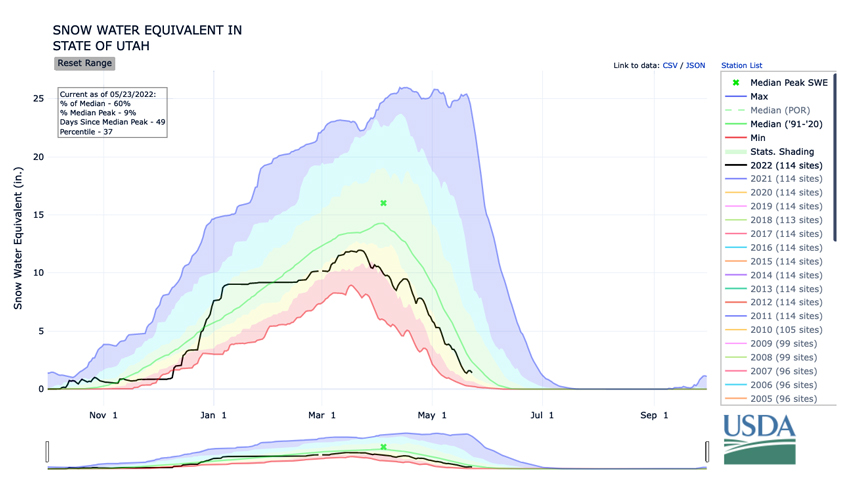
Utah Statewide Snow Water Equivalent
Wyoming
- Precipitation:
- The snowpack melt out is underway, although a late spring snowstorm in some areas may put a temporary hold on the current melt rate.
- At present, all basins in Wyoming had peak snowpack less than the median, though all but the Cheyenne, Belle Fourche, and South Platte in Wyoming peaked at a later date than the median.
- After some good precipitation in very early May, the situation has worsened. Only a few areas have seen very much above normal precipitation (greater than one inch anomaly) so far this month, such as central Park County and northeastern Weston County.
- Much of the rest of Wyoming has been an inch below normal, although a late season storm underway should help bring those numbers up.
- Soil Moisture:
- Soil moisture improvement peaked around the end of the first week in May and, with the exception of the far northwestern and northeastern corners of the state, has been steadily declining since. This decline is especially notable in the southern part of the state.
- Temperatures:
- Generally cooler than normal temperatures have prevailed in the western part of the state with temperatures around 3 ºF below normal.
- At higher elevations, mean temperatures for the month have been around 6 ºF below normal.
- Departures above normal exist in the eastern part of Wyoming, with parts of the far southeast being as much as 9 ºF above normal for the last two weeks.
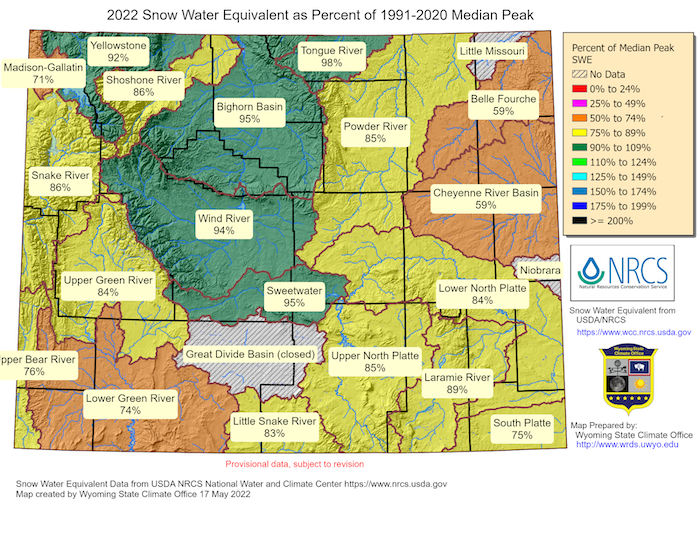
Wyoming Snow Water Equivalent
For More Information
More local information is available from the following resources:
- Your state climatologist
- Your local National Weather Service office
- Western Water Assessment: Intermountain West Climate Dashboard
- Climate Assessment for the Southwest: Southwest Climate Outlook
In Case You Missed It
- April 5, 2022: Southwest Drought Briefing: A Focus on Snowpack
Upcoming Events
- June 2, 2022: Drought Update and Wildfire Outlook Webinar for California and the Southwest
- June 7–8, 2022, Las Cruces, New Mexico: Southwest Drought Learning Network Annual Meeting
Prepared By
Joel Lisonbee
NOAA/National Integrated Drought Information System (NIDIS)
Erin Saffell
Arizona State Climatologist/Arizona State University
Peter Goble
Colorado Climate Center/Colorado State University
Jon Meyer
Utah Climate Center/Utah State University
Tony Bergantino
Water Resources Data System – Wyoming State Climate Office
This drought status update is issued in partnership between the National Oceanic and Atmospheric Administration (NOAA), and the offices of the state climatologist for Arizona, Colorado, New Mexico, Utah and Wyoming. The purpose of the update is to communicate a potential area of concern for drought expansion and/or development within the Intermountain West based on recent conditions and the upcoming forecast. NIDIS and its partners will issue future drought status updates as conditions evolve.