Drought Risk Atlas
National Drought Mitigation Center, U.S. Department of Agriculture, National Oceanic and Atmospheric Administration
The Drought Risk Atlas provides historic data about drought through 2017 for the most complete data for weather stations across the United States that have at least 40 years of record. Users can select a station and view data for several drought indices over time, frequency statistics for drought thresholds, drought period information, and index comparisons.
Where do these data come from?
The Drought Risk Atlas uses precipitation records from the National Weather Service Cooperative data (COOP) that is archived by the Regional Climate Centers (RCC) in their Applied Climate Information System (ACIS).
How to
What can I do with these data?
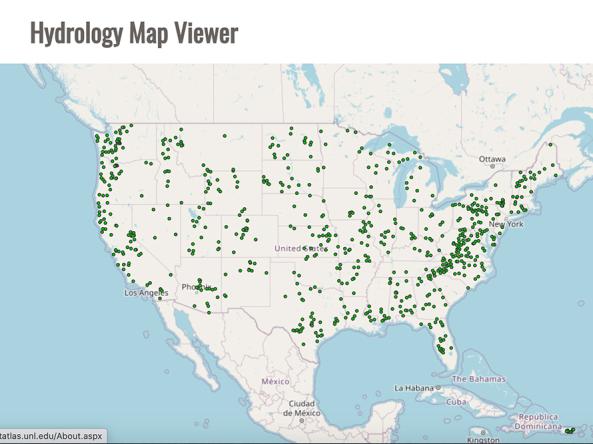
You can explore drought history at thousands of stations across the contiguous U.S. Values for several drought indices are pre-computed, and data are available for download. Within the Map Viewer, you can view U.S. Drought Monitor or Standardized Precipitation Index maps.
One application of the Drought Risk Atlas is the ability to explore trends in various drought indicators at stations. This not only allows one to explore differences in locations and regions, but also to adjust the period of reference by selecting different start dates from 1950 to 1985. The Drought Risk Atlas allows users to see trends on derived drought indicators, as well as the raw precipitation data, which is unique in trying to determine how drought is changing over areas. Users are able to analyze trends for precipitation, drought indices, dry days, and dry streaks to see how they are changing over time and with various reference periods and confidence levels.
How do I use the U.S. Drought Atlas site?
- See Help for the Map Viewer and the Data Tool on the Atlas site.
Access
Drought Risk Atlas: The home page for the Drought Risk Atlas.
Map Viewer: Access historical maps of drought.
Time Series Visualization and Data Download: Time series plots of historical drought and data downloads for specific stations.
Documentation
Svoboda, M., Fuchs, B., Poulsen, C., Nothwehr, J. 2015. The Drought Risk Atlas: Enhancing Decision Support for Drought Risk Management in the United States. Journal of Hydrology 526, 274–286.