Drought Impacts
Drought’s consequences are far-reaching, impacting water quality, public health, the economy, the natural environment, public infrastructure, and more. Understanding drought’s potential impacts enables drought planners and decision makers to better address those impacts and, ultimately, improve their communities' preparedness to cope with drought.
Data and Maps
To monitor and respond to drought, its impacts on a community must be fully understood. Immediate drought impacts can include visibly dry vegetation and lower water levels in lakes and reservoirs. Longer-term impacts, such as land subsidence, seawater intrusion, and damage to ecosystems, can be harder to see, but more costly to manage in the future.
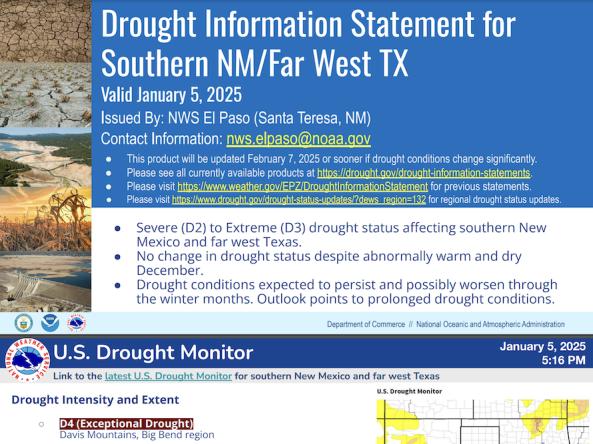
National Weather Service drought information statements provide up-to-date reports on the current drought situation for a Weather Forecast Office’s county warning and forecast area. These statements summarize recent weather and hydrologic conditions, discuss local drought impacts, and provide a local drought outlook.
This map shows all active drought information statements published within the last 35 days.
Periods of drought can lead to inadequate water supply, threatening the health, safety, and welfare of communities. Streamflow, groundwater, reservoir, and snowpack data are key to monitoring and forecasting water supply.
Learn MoreDrought can reduce the water availability and water quality necessary for productive farms, ranches, and grazing lands, resulting in significant negative direct and indirect economic impacts to the agricultural sector. Monitoring agricultural drought typically focuses on examining levels of precipitation, evaporative demand, soil moisture, and surface/groundwater quantity and quality.
Learn MoreDrought can cause significant human health outcomes that can challenge public health departments, emergency managers, and healthcare providers. Drought can lead to decreased water quantity and quality, increased incidence of illness or disease, increased mortality rates, and adverse mental health outcomes as livelihoods are challenged.
Learn MoreDuring drought conditions, fuels for wildfire, such as grasses and trees, can dry out and become more flammable. Drought can also increase the probability of ignition and the rate at which fire spreads. Temperature, soil moisture, humidity, wind speed, and fuel availability (vegetation) are all factors that interact to influence the frequency of large wildfires.
Learn MoreDrought Information Statements
U.S. Drought Monitor
D0 - Abnormally Dry
Abnormally Dry (D0) indicates a region that is going into or coming out of drought, according to the U.S. Drought Monitor. View typical impacts by state.
D1 – Moderate Drought
Moderate Drought (D1) is the first of four drought categories (D1–D4), according to the U.S. Drought Monitor. View typical impacts by state.
D2 – Severe Drought
Severe Drought (D2) is the second of four drought categories (D1–D4), according to the U.S. Drought Monitor. View typical impacts by state.
D3 – Extreme Drought
Extreme Drought (D3) is the third of four drought categories (D1–D4), according to the U.S. Drought Monitor. View typical impacts by state.
D4 – Exceptional Drought
Exceptional Drought (D4) is the most intense drought category, according to the U.S. Drought Monitor. View typical impacts by state.
National Weather Service drought information statements provide up-to-date reports on the current drought situation for a Weather Forecast Office’s county warning and forecast area. These statements summarize recent weather and hydrologic conditions, discuss local drought impacts, and provide a local drought outlook.
This map shows all active drought information statements published within the last 35 days.
Weather Forecast Offices issue drought information statements as needed based on local conditions. This map is updated daily.
Periods of drought can lead to inadequate water supply, threatening the health, safety, and welfare of communities. Streamflow, groundwater, reservoir, and snowpack data are key to monitoring and forecasting water supply.
Learn MoreDrought can reduce the water availability and water quality necessary for productive farms, ranches, and grazing lands, resulting in significant negative direct and indirect economic impacts to the agricultural sector. Monitoring agricultural drought typically focuses on examining levels of precipitation, evaporative demand, soil moisture, and surface/groundwater quantity and quality.
Learn MoreDrought can cause significant human health outcomes that can challenge public health departments, emergency managers, and healthcare providers. Drought can lead to decreased water quantity and quality, increased incidence of illness or disease, increased mortality rates, and adverse mental health outcomes as livelihoods are challenged.
Learn MoreDuring drought conditions, fuels for wildfire, such as grasses and trees, can dry out and become more flammable. Drought can also increase the probability of ignition and the rate at which fire spreads. Temperature, soil moisture, humidity, wind speed, and fuel availability (vegetation) are all factors that interact to influence the frequency of large wildfires.
Learn More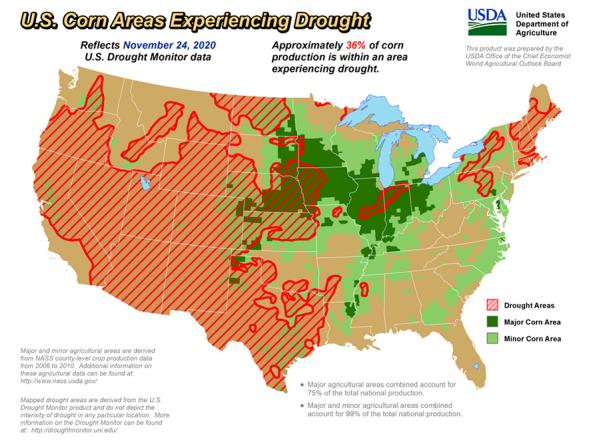
The U.S. Department of Agriculture produces weekly maps and charts displaying locations and percentages of drought-affected areas corn, soybeans, hay, cattle, and winter wheat.
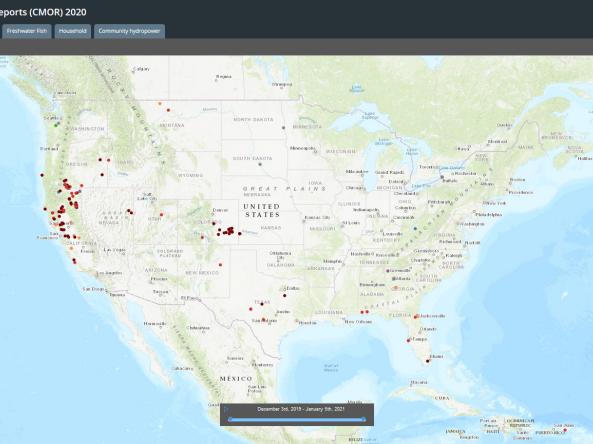
Condition Monitoring Observer Reports on Drought (CMOR-Drought) is a tool that allows citizen scientists to submit obse
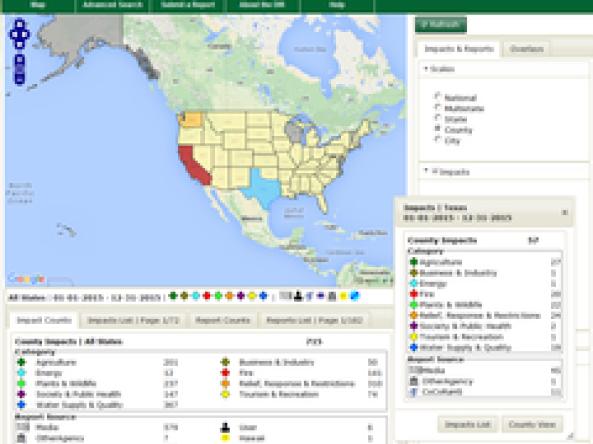
Drought Impacts Reporter (DIR): an interactive database of drought impacts in the U.S., by location, data, type, and cost built from stakeholder, government, media and other reports.
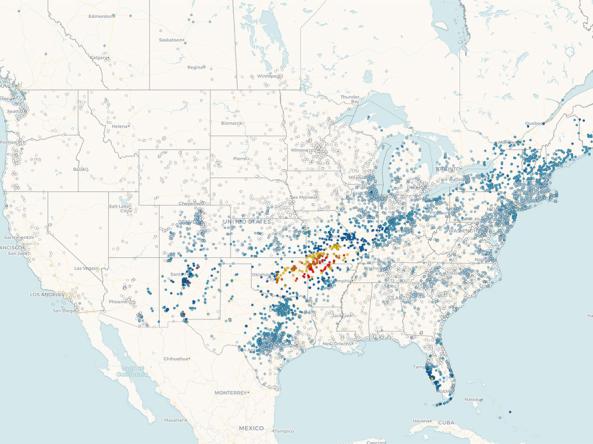
Precipitation data from CoCoRaHS: a non-profit, community-based network of volunteers of all ages and backgrounds working together to measure and map precipitation (rain, hail, and snow) acros
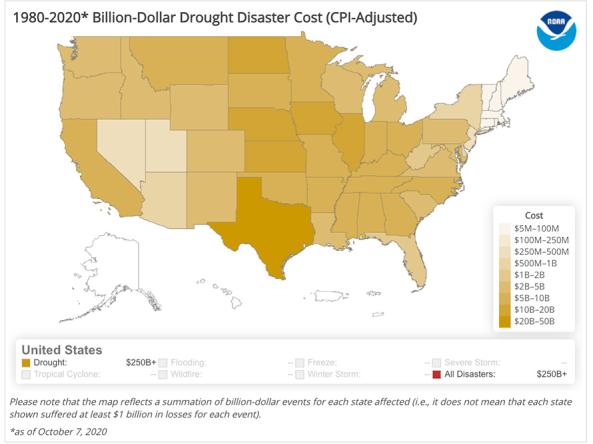
The National Centers for Environmental Information's Billion-Dollar Weather and Climate Disasters shows the weather and climate events that have had the greatest economic impact from 1980
National Weather Service drought information statements provide up-to-date reports on the current drought situation for a Weather Forecast Office’s county warning and forecast area.
Drought Impacts by State and U.S. Drought Monitor Category
No two states experience the same set of impacts during a drought. Drought in Alaska looks different than drought in Arizona. The following state-specific drought impacts were compiled by the National Drought Mitigation Center. While these impacts are not exhaustive, they can help provide a clearer picture of drought across the United States.