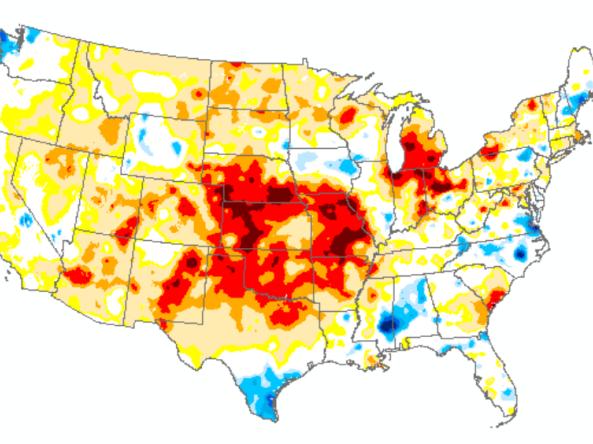
Drought in Texas has expanded and worsened during early 2022. As of April 12, the U.S. Drought monitor showed nearly 50% (49.1%) of the state in extreme (D3) or exceptional (D4) drought, the highest percentage since February of 2012. During this webinar, John Nielsen-Gammon, the Texas State Climatologist, and Victor Murphy, from the National Weather Service, talked about current drought conditions, the long-range forecast, and the impact recent precipitation might have on drought conditions across the state.

The U.S. Geological Survey and National Integrated Drought Information System hosted a series of listening sessions to seek input on priorities and needs related to predicting water availability changes under drought conditions at national and regional scales. This webinar included an overview and synthesis of key take-aways from the series of listening sessions, discussion of next steps, and time for Q&A and participant feedback.
The U.S. Geological Survey and NOAA’s National Integrated Drought Information System are pleased to announce a series of listening sessions to seek input on priorities and needs related to predicting water availability changes under drought conditions at national and regional scales. This listening session, held on September 8, 2022, included a short introduction to water availability prediction products for ecosystems, followed by guided discussions with participants on research priorities for product development or improvement at the national and/or regional scale.
The U.S. Geological Survey and NOAA’s National Integrated Drought Information System are pleased to announce a series of listening sessions to seek input on priorities and needs related to predicting water availability changes under drought conditions at national and regional scales. This listening session, held on July 14, 2022, included a short introduction to water use information products, followed by guided discussions with participants on research priorities for product development or improvement at the national and/or regional scale.