River DroughtCast
U.S. Geological Survey
The U.S. Geological Survey’s River DroughtCast is an interactive online tool that delivers current streamflow drought conditions and weekly forecasts of streamflow drought at approximately 3,000 USGS streamgages with more than 40 years of data across the lower 48 states. Users can view current observed or forecast conditions up to 13 weeks out using an interactive map.
Each streamgage site on the map is shown as a circle, and the color of the circle indicates what category of streamflow drought is observed or forecast: moderate (streamflow in the 20th percentile or below of historical conditions for that site), severe (10th percentile), extreme (5th percentile), or no streamflow drought.
Streamflow drought occurs when streamflow at a particular location drops to levels that are unusually low for the time of year. While lack of rain typically comes first, factors like soil moisture, snowpack, and groundwater all influence how dry conditions translate into reduced river flows. This makes streamflow drought particularly difficult to predict but critically important for water resource planning.
River DroughtCast uses machine learning models trained on data from thousands of USGS streamgages (some with more than 100 years of continuous records) from 1981-2020 to forecast when rivers and streams will drop to abnormally low levels. Users can choose any length of forecast between 1 and 13 weeks, though the tool is most reliable in the first 4 to 6 weeks. Regardless of the length of the current drought, the first week of severe or extreme drought conditions were correctly predicted approximately 75% of the time. This reliability drops to approximately 55% by week 13. All forecasts include confidence estimates so users can understand the reliability of predictions during different timeframes.
USGS created River DroughtCast in partnership with NOAA’s National Integrated Drought Information System, which supported the project throughout its development.
Access
How To
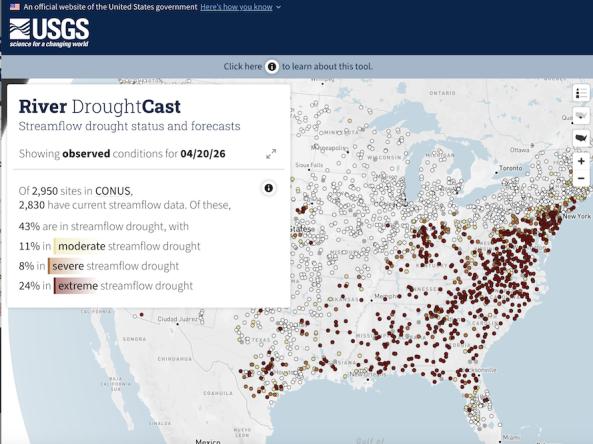
On page load, the map displays current conditions at approximately 3,000 USGS streamgage sites across the conterminous United States (CONUS).To view forecast conditions, select a future date using the date slider on the right.
- Nationwide Summary: By default, the main panel shows a summary of streamflow drought conditions for all of CONUS, indicating what percentage of gages is/is forecast to be in streamflow drought, and what percentage is/is forecast to be in each of three categories of streamflow drought. The reported percentages for each category are categorical, not cumulative.
- State Summaries: To view a summary for an individual state, use the state picker button in the upper right (above the zoom controls) to select a state to view. The map will zoom to that state, show only gages located in that state, and provide a summary of streamflow drought conditions for gages in that state.
- Individual Sites: To view recent, current, and forecast conditions at an individual site, click on the circle for the site. This will populate the main panel with a streamflow drought summary for the selected site over the last 90 days and 13 weeks into the future.
- Interpreting Streamflow Drought Forecasts: When you click on a site, the main panel also highlights four categories of sites where there may be additional considerations for interpreting streamflow drought forecasts with nuance: non-perennial, highly regulated, snow-dominated, and ice-impacted. Hover over these icons to learn more.
- You can also use the "i" and "?" icons throughout the site to view FAQs and tooltips.
Documentation & Metadata
- USGS data release pages and metadata:
- Model inputs for machine learning models forecasting streamflow drought across the conterminous United States (ver. 2.0, September 2025)
- Model output and code for a long short-term memory model forecasting streamflow drought across the Conterminous United States by focusing on percentiles below 50 percent
- What is streamflow drought?
- Modeling streamflow drought
- Technical documentation of modeling methods and model evaluation