TroutCast
U.S. Geological Survey, Montana State University, Montana Fish, Wildlife, and Parks, NOAA's National Integrated Drought Information System
TroutCast is an interactive tool that helps users explore the projected impacts of drought on valuable trout fisheries across Montana's blue-ribbon rivers. As droughts become more frequent and severe, reduced streamflows and rising water temperatures threaten cold-water trout species—impacting populations, fishing opportunities, and local economies. TroutCast provides seasonal and long-term forecasts to inform proactive decision-making for fisheries management, drought response, and recreational angling opportunities.
Developed through a partnership among the U.S. Geological Survey (USGS), Montana State University, the National Oceanic and Atmospheric Administration National Integrated Drought Information System (NOAA/NIDIS), and Montana Fish, Wildlife, & Parks (MFWP), TroutCast integrates long-term trout population monitoring data from MFWP, USGS streamflow records, and weather information to generate seasonal (1–3 month) and long-term (1–3 year) forecasts of trout population trends and drought risk. The tool also estimates the likelihood of fisheries management actions triggered by drought-related low streamflows or elevated water temperatures.
The team has quantified how specific streamflow levels translate into trout production and trout abundance in Montana’s rivers. TroutCast uses these relationships to support water planning and management by linking hydrologic conditions directly to ecological eutcomes. Beyond fisheries conservation, the tool can benefit local and regional economies by helping sustain recreational fishing opportunities and improving predictability around drought-related management decisions.
The tool currently focuses on Montana’s rivers, with planned expansion to the Upper Snake River Basin in Idaho and Wyoming.
How to
- Choose either “management forecasts” or “population forecasts” from the top menu bar.
- Select “Management Forecasts” to view the probability of exceeding high temperature (hoot owl) and/or low flow management thresholds over the next 1-4 weeks.
- Select a fish species from the dropdown menu, then click the buttons to select a management threshold type (low flow, high temperature, or either) and a forecast period.
- Click on a marker on the interactive map to view detailed probabilities and historical flow and temperature data.
- Click “Forecast Table” to view the forecasts in a table format.
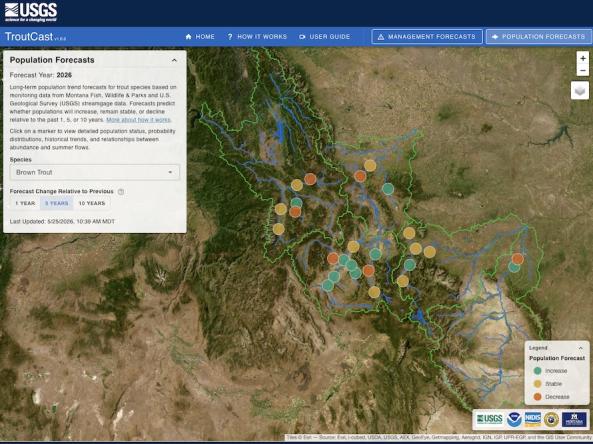
Select “Population Forecasts” in the top menu to view long-term population trend forecasts for trout species. Forecasts predict whether populations will increase, remain stable, or decline relative to the past 1, 5, or 10 years.
- Select a fish species from the dropdown menu and select a time range (1 year, 5 year, 10 years).
- Click on a marker on the interactive map to view detailed population status, probability distributions, historical trends, and relationships between abundance and summer flows.
Documentation