U.S. flag

An official website of the United States government

DATA & MAPS

Select categories to browse data

Looking to Download Data? The Drought.gov team reformats data from multiple partners into web- and GIS-ready formats, which we use throughout Drought.gov. These data are free for all to download.
Search Results(15)

The U.S. Department of Agriculture produces weekly maps and charts displaying locations and percentages of drought-affected areas corn, soybeans, hay, cattle, and winter wheat. 

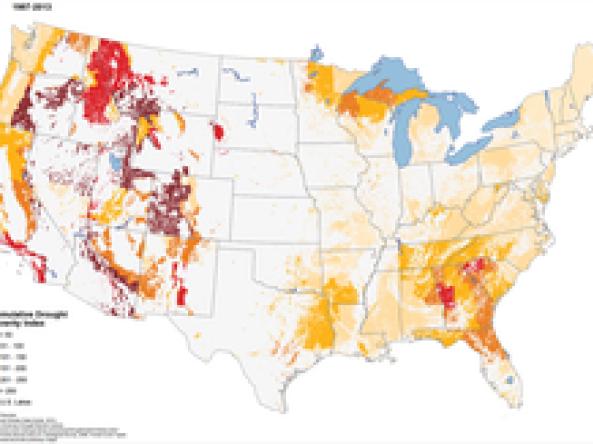
U.S Forest Service Cumulative Drought Severity Index (CDSI): allows users to compare the severity of droughts experienced by different forest ecosystems between two periods, 1960-1986 & 1987-2013.

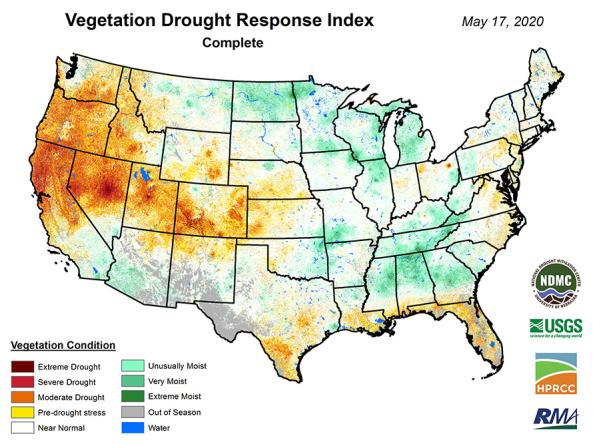
VegDRI: a weekly depiction of vegetation stress across the contiguous United States.