U.S. flag

An official website of the United States government

DATA & MAPS

Select categories to browse data

Looking to Download Data? The Drought.gov team reformats data from multiple partners into web- and GIS-ready formats, which we use throughout Drought.gov. These data are free for all to download.
Search Results(28)

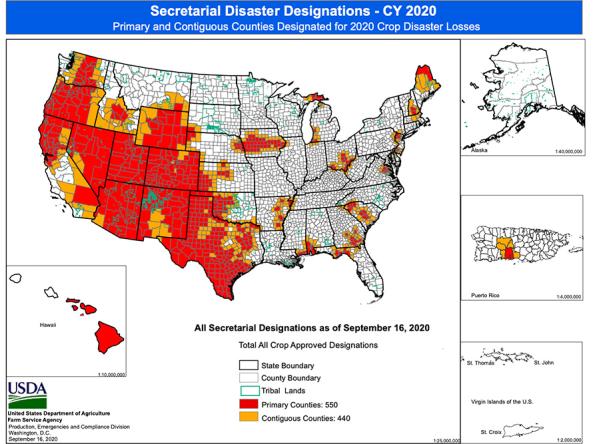
The U.S. Department of Agriculture produces weekly maps and charts displaying locations and percentages of drought-affected areas corn, soybeans, hay, cattle, and winter wheat. 

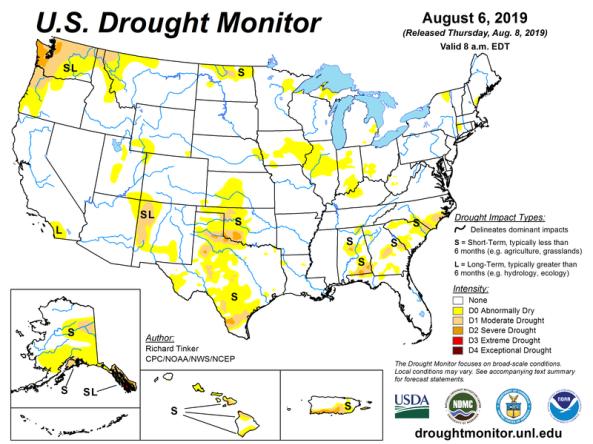
The U.S. Drought Monitor is a map updated each Thursday to show the location and intensity of drought across the country. 

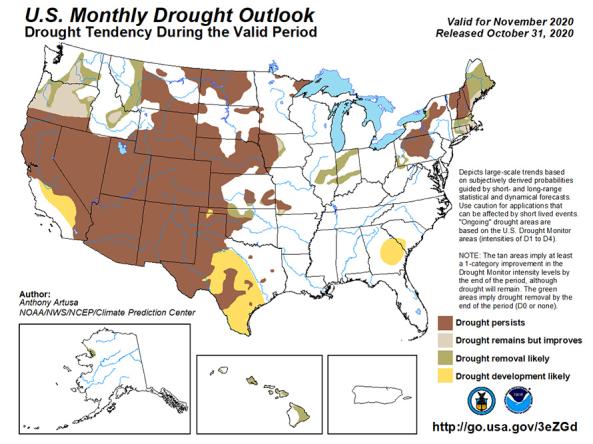
The U.S. Monthly Drought Outlook predicts whether drought will emerge, stay the same or get better over the next 30 days or so.

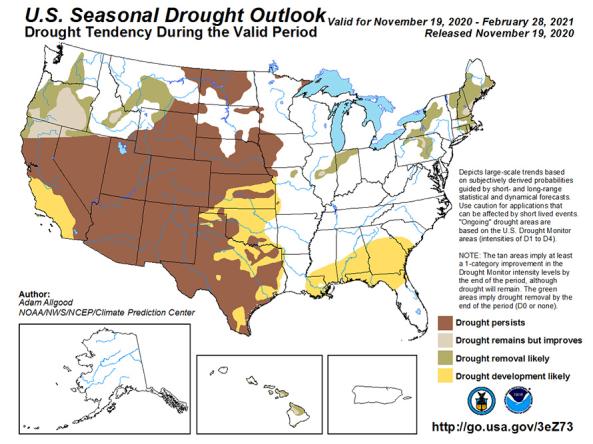
The U.S. Seasonal Drought Outlook depicts large-scale trends based on subjectively derived probabilities guided by short- and long-range statistical and dynamical forecasts.