Recent Series of Atmospheric Rivers Alleviate—But Don’t Eliminate—Drought
Register here for the March 27 California-Nevada Drought & Climate Outlook Webinar.
Key Points
- The series of nine atmospheric rivers in December and January helped to alleviate drought in the region. Currently the region is free from exceptional drought (D4), and only 3% of the region is in extreme drought (D3).
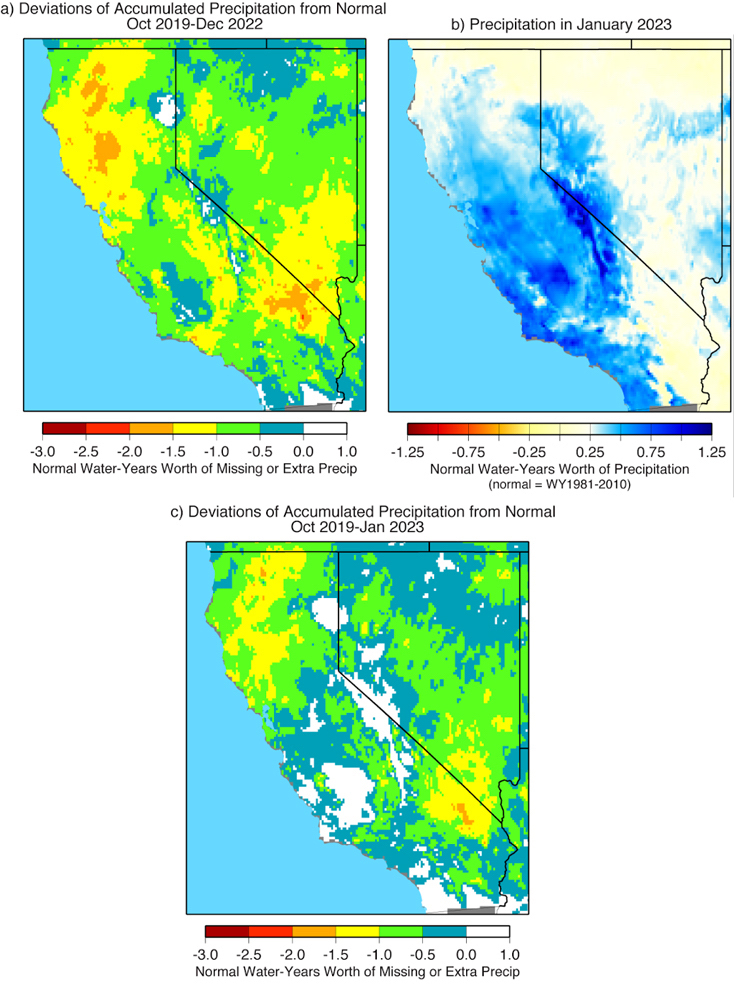
- The precipitation deficits accumulated over the past 3 years were undone in areas of coastal southern California, central California, and the eastern Sierras in Nevada by the storms of January 2023.
- The impacts of the rain and snowfall from December and January were varied throughout the region. Northern and southeastern California and large parts of Nevada didn't get as much precipitation as the central Sierras and central/southern California coasts. Groundwater levels and how much of the snow will run off into reservoirs remain to be determined, leaving the full impact on the drought recovery from these storms still an open question.
- The Colorado Basin 24-month study by the Bureau of Reclamation no longer indicates Lake Powell dropping below the power pool, but Lake Mead could drop below 1,000 feet in the summer of 2024 in the minimum probable inflow scenario.
The U.S. Drought Monitor (USDM) is updated each Thursday to show the location and intensity of drought across the country. Drought categories show experts’ assessments of conditions related to dryness and drought including observations of how much water is available in streams, lakes, and soils compared to usual for the same time of year.
California/Nevada conditions as of February 14, 2023:
- 84.6% of California is experiencing Moderate (D1) to Exceptional (D4) Drought (0% in D3, 0% in D4)
- California population in drought: 33,411,791
- 87.4% of Nevada is experiencing Moderate (D1) to Exceptional (D4) Drought (6.13% in D3, 0% in D4)
- Nevada population in drought: 2,602,413
U.S. Drought Monitor Categories
Abnormally Dry (D0)
Abnormally Dry (D0) indicates a region that is going into or coming out of drought. View typical impacts by state.
Moderate Drought (D1)
Moderate Drought (D1) is the first of four drought categories (D1–D4), according to the U.S. Drought Monitor. View typical impacts by state.
Severe Drought (D2)
Severe Drought (D2) is the second of four drought categories (D1–D4), according to the U.S. Drought Monitor. View typical impacts by state.
Extreme Drought (D3)
Extreme Drought (D3) is the third of four drought categories (D1–D4), according to the U.S. Drought Monitor. View typical impacts by state.
Exceptional Drought (D4)
Exceptional Drought (D4) is the most intense drought category, according to the U.S. Drought Monitor. View typical impacts by state.
The U.S. Drought Monitor (USDM) is updated each Thursday to show the location and intensity of drought across the country. Drought categories show experts’ assessments of conditions related to dryness and drought including observations of how much water is available in streams, lakes, and soils compared to usual for the same time of year.
California/Nevada conditions as of February 14, 2023:
- 84.6% of California is experiencing Moderate (D1) to Exceptional (D4) Drought (0% in D3, 0% in D4)
- California population in drought: 33,411,791
- 87.4% of Nevada is experiencing Moderate (D1) to Exceptional (D4) Drought (6.13% in D3, 0% in D4)
- Nevada population in drought: 2,602,413
Current Conditions
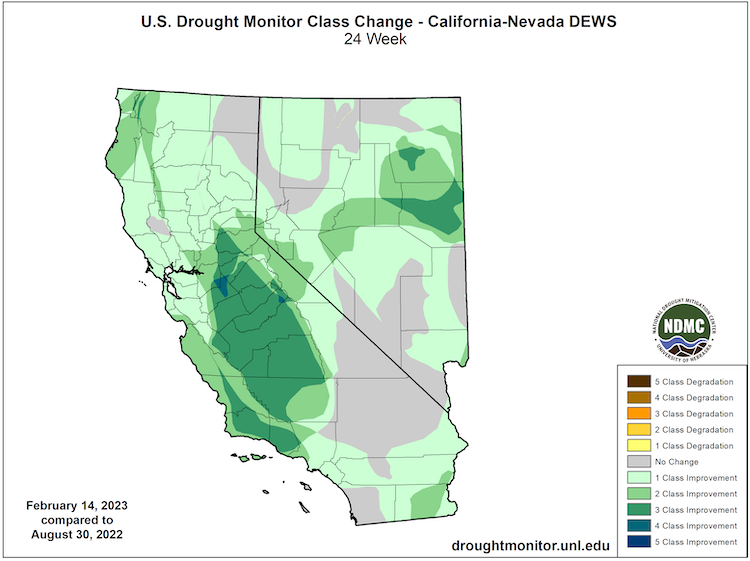
- According to the U.S. Drought Monitor, the series of 9 atmospheric rivers alleviated the drought throughout much of the region with 1–3 class improvements throughout much of California and Nevada. The largest improvements are in Central California and in the Reno/Carson City area.
- The impacts of the rain and snowfall from December and January were varied throughout the region. Northern and southeastern California and large parts of Nevada didn't get as much precipitation as the central Sierras and central/southern California coasts. Groundwater levels and how much of the snow will run off into reservoirs remains to be determined, leaving the full impact on the drought recovery from these storms still an open question.
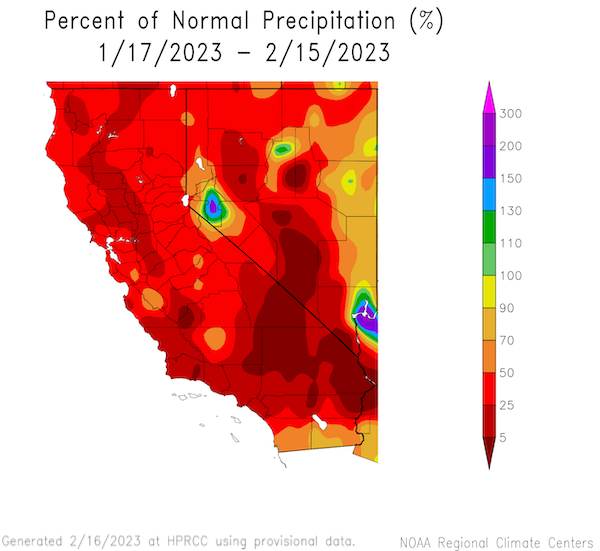
- Since the family of atmospheric rivers ended in January, there has been little precipitation throughout the region.
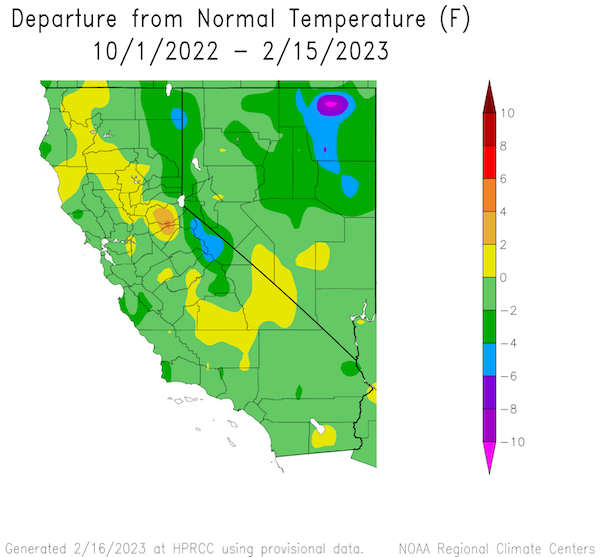
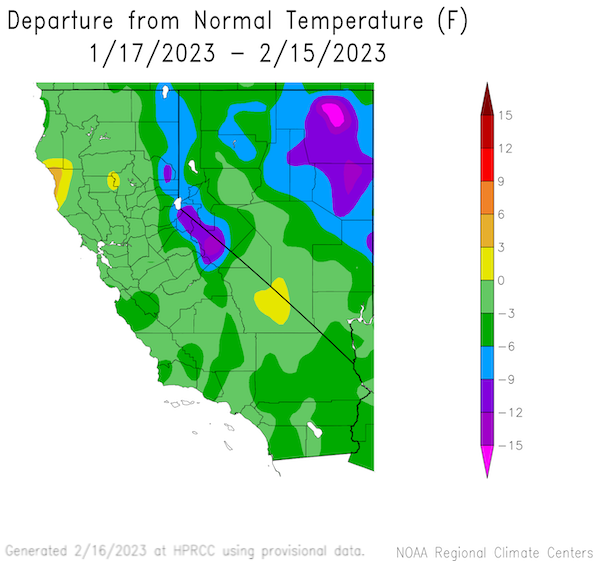
- A cooler than average water year has helped to preserve the snowpack and minimize evaporative demand (the “thirst” of the atmosphere).
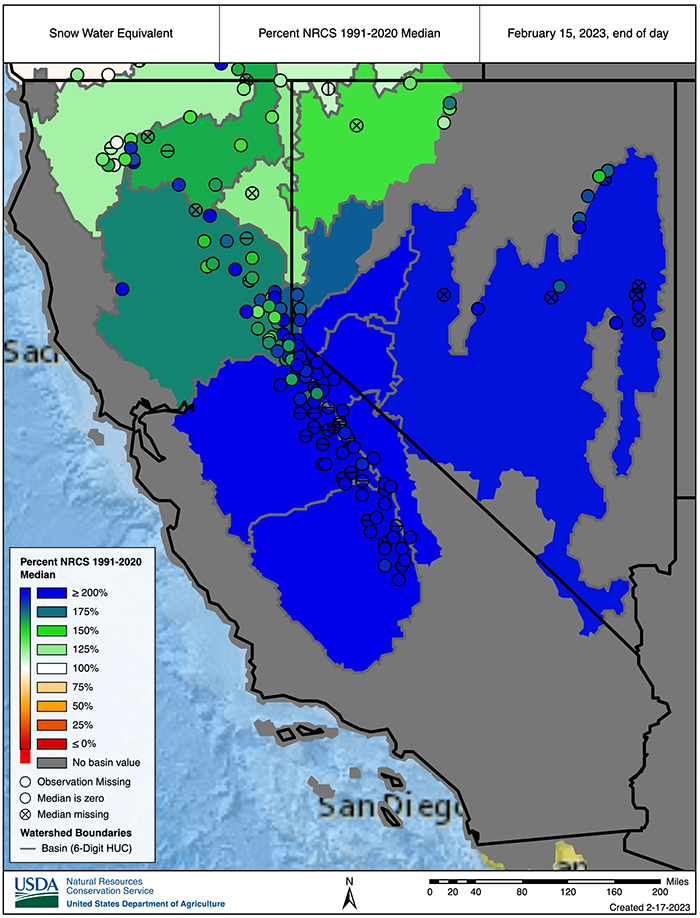
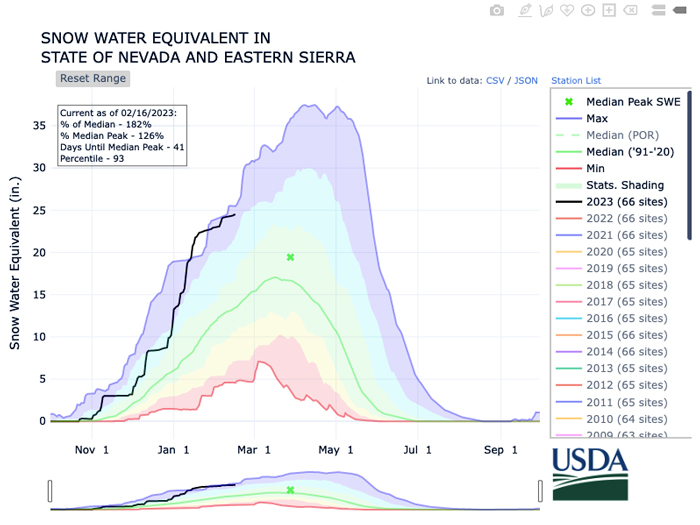
- Snowpack remains well above normal for this time of year—over 200% of normal in many parts of the region.
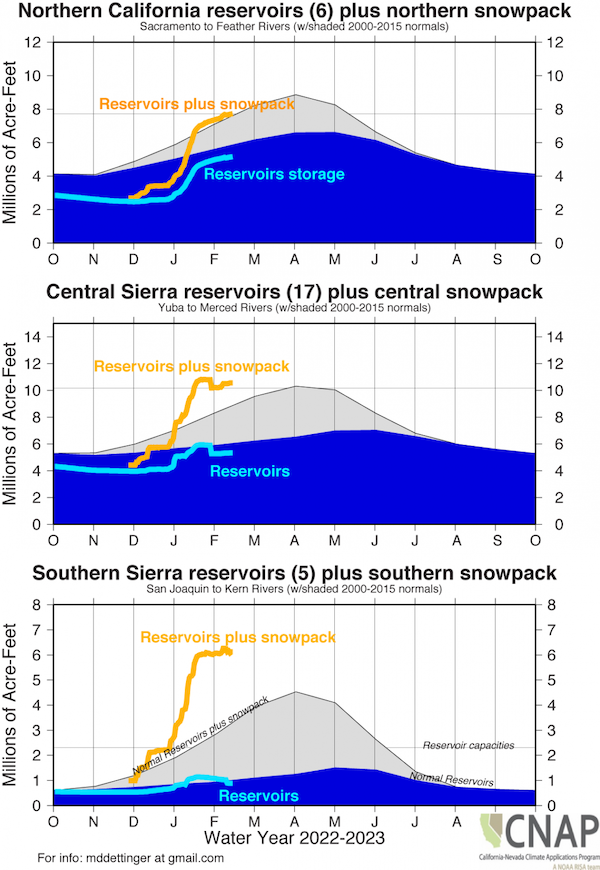
- Western Sierra reservoirs’ reservoir storage plus snowpack is above normal for this time of year. The Northern Sierra reservoir storage + snowpack is near normal while the Southern Sierra reservoir storage + snowpack is ~50% above normal.
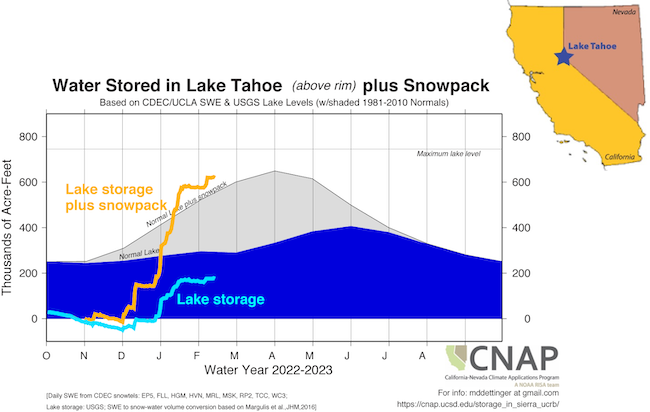
- In Nevada, reservoirs are at 29% of capacity, which is 80% of the median. Lake Tahoe is above the rim and at 22% of capacity. However, the reservoir storage + snowpack is above normal for this time of year and near the April 1st peak.
- Soil moisture in Nevada is near the record maximum, in the 93rd percentile.
- The most recent 24-month study for the Colorado River under the minimal probable inflow scenario shows Lake Powellno longer dropping below the power pool, but Lake Mead could drop below 1,000 feet by summer of 2024.
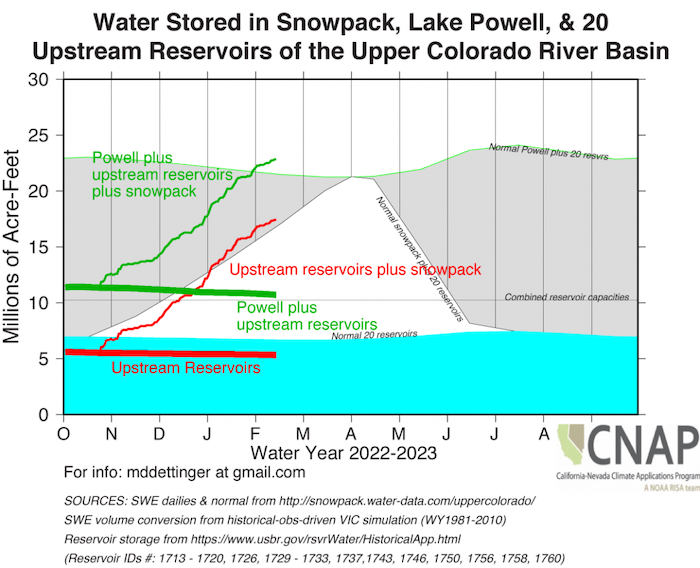
- In the Upper Colorado, the combined snowpack and storage of the 20 upstream reservoirs of Lake Powell are slightly above normal for this time of year.
- For more information, check out Living with Drought in Nevada and the California Water Watch.
How is drought affecting your neighborhood? Click to see drought indicators, outlooks, and historical conditions by city, county, and state, as well as sign up for alerts.
U.S. Drought Monitor 6-Month Change Map
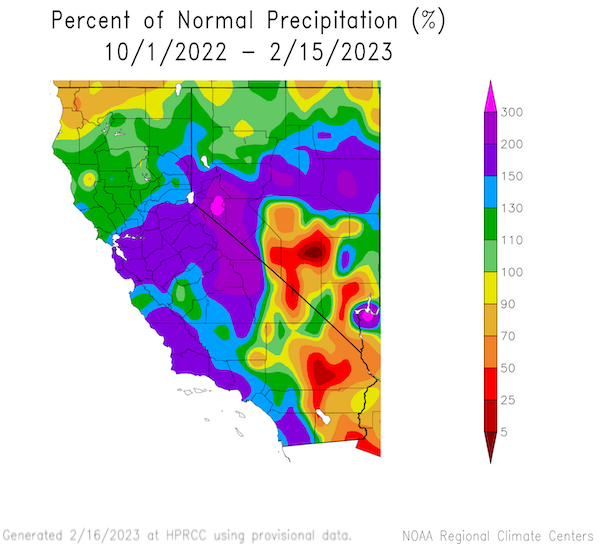
Percent of Normal Precipitation: Water Year and Last 30 Days
Departure from Normal Temperature: Water Year and Last 30 Days
Snow Water Equivalent (SWE)
Accumulated Precipitation Deficits
Snow Water Equivalent in Nevada and the Eastern Sierra
Water Storage + Snowpack
Upper Colorado River Basin Water Storage
Drought & Climate Outlook
El Niño–Southern Oscillation (ENSO)
NOAA’s ENSO alert system status is currently a La Niña Advisory. La Niña is expected to transition to ENSO-neutral conditions in the next couple of months. In February–April 2023, there is an 83% chance of ENSO-neutral. For more information, check out the NOAA ENSO blog or current status presentation and how La Niña impacts the Western U.S.
Subseasonal to Seasonal Drought, Temperature, and Precipitation Outlooks
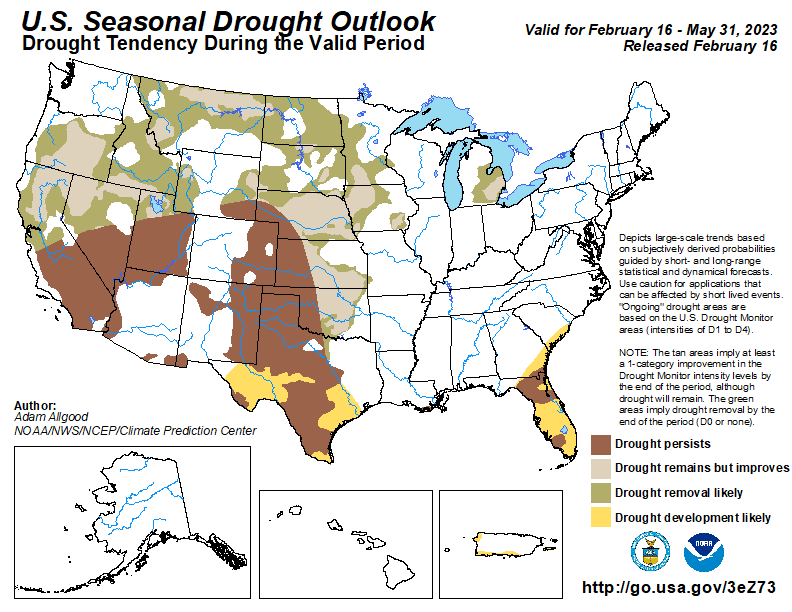
The next 1–3 month forecast shows drought improving or even being removed in northern parts of the region, with drought persisting in central and southern parts of the region. The March outlook from the National Weather Service's Climate Prediction Center predicts below-normal temperatures in the northern part of the region, with equal chances of above- to below-normal temperatures for the southern part of the region. The March precipitation outlook shows a greater likelihood of above-normal precipitation in the northern part of the region. Week three forecasts valid in early March currently do not agree on the sign of atmospheric river activity for the region. More information can be found at the latest CW3E Subseasonal to Seasonal Outlook
Seasonal (3-Month) Drought Outlook
March 2023 Temperature and Precipitation Outlooks
Drought Early Warning Resources
Prepared By
Julie Kalansky
Program Manager, California-Nevada Adaptation Program (A NOAA CAP/RISA team)
This drought status update is issued in partnership between the National Oceanic and Atmospheric Administration (NOAA), the California-Nevada Adaptation Program (a NOAA CAP/RISA team), and the Western Regional Climate Center at the Desert Research Institute to communicate the current state of drought conditions in California-Nevada based on recent conditions and the upcoming forecast. NIDIS and its partners will issue future drought status updates as conditions evolve.