Water Year 2023 Recap: An Extreme Drought Buster
Register here for the November 27 California-Nevada Drought & Climate Outlook Webinar.
Key Points
- According to the U.S. Drought Monitor, the California-Nevada Drought Early Warning System region began Water Year 2023 100% in drought and ended with less than 1% of the region in drought.
- Cool, wet conditions throughout the year led to a record snowpack in the Southern Sierra Nevada and the reemergence of Tulare Lake.
- Responsive actions to the wet conditions included a California executive order to maximize the opportunity for groundwater recharge.
- El Niño is here and expected to persist and peak in winter, although outlooks currently suggest equal chances of above-, below-, and near-normal conditions. This is in contrast to the traditional El Niño precipitation pattern of a normal to wet southern portion of the California-Nevada region.
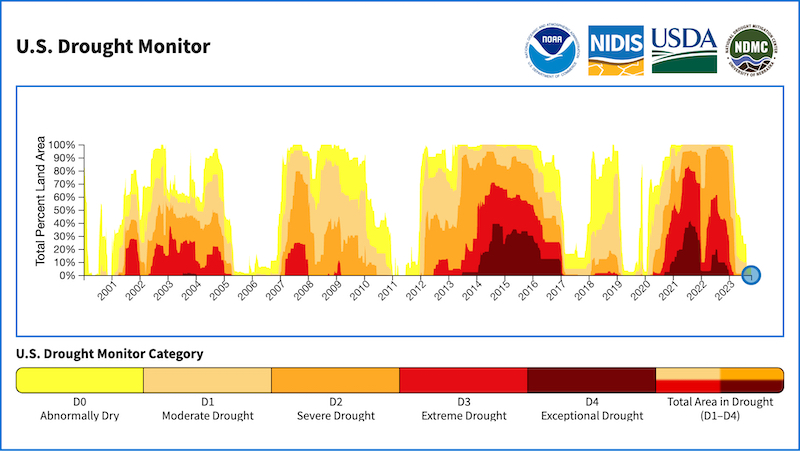
The U.S. Drought Monitor (USDM) is updated each Thursday to show the location and intensity of drought across the country. Drought categories show experts’ assessments of conditions related to dryness and drought including observations of how much water is available in streams, lakes, and soils compared to usual for the same time of year.
California/Nevada conditions as of October 17, 2023:
- 5.68% of California is experiencing Abnormally Dry (D0) conditions
- 1.6% of Nevada is experiencing Moderate (D1) drought
- 4.12% of Nevada is experiencing Abnormally Dry (D0) conditions
U.S. Drought Monitor Categories
Abnormally Dry (D0)
Abnormally Dry (D0) indicates a region that is going into or coming out of drought. View typical impacts by state.
Moderate Drought (D1)
Moderate Drought (D1) is the first of four drought categories (D1–D4), according to the U.S. Drought Monitor. View typical impacts by state.
Severe Drought (D2)
Severe Drought (D2) is the second of four drought categories (D1–D4), according to the U.S. Drought Monitor. View typical impacts by state.
Extreme Drought (D3)
Extreme Drought (D3) is the third of four drought categories (D1–D4), according to the U.S. Drought Monitor. View typical impacts by state.
Exceptional Drought (D4)
Exceptional Drought (D4) is the most intense drought category, according to the U.S. Drought Monitor. View typical impacts by state.
The U.S. Drought Monitor (USDM) is updated each Thursday to show the location and intensity of drought across the country. Drought categories show experts’ assessments of conditions related to dryness and drought including observations of how much water is available in streams, lakes, and soils compared to usual for the same time of year.
California/Nevada conditions as of October 17, 2023:
- 5.68% of California is experiencing Abnormally Dry (D0) conditions
- 1.6% of Nevada is experiencing Moderate (D1) drought
- 4.12% of Nevada is experiencing Abnormally Dry (D0) conditions
Current Conditions
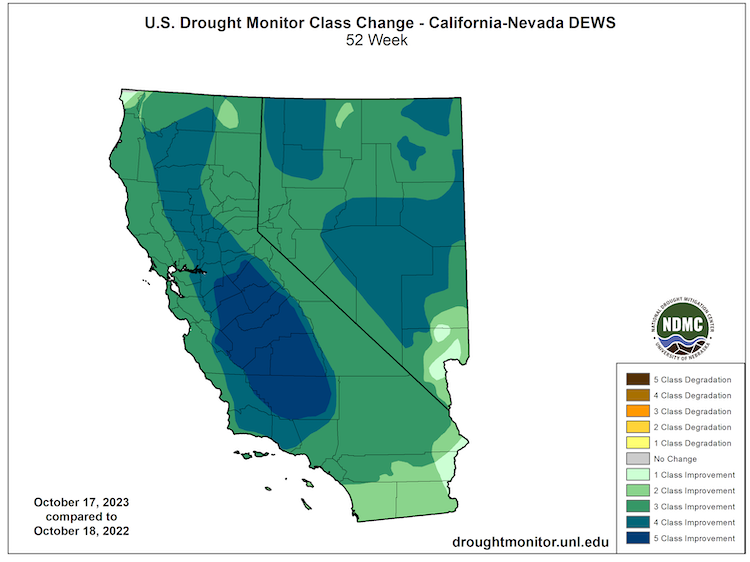
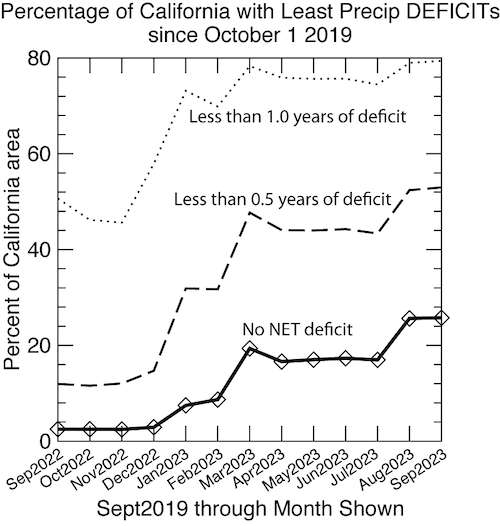
- According to the U.S. Drought Monitor, less than 1% of California-Nevada remains in drought, compared to 100% a year ago. This means a 5-drought class improvement in areas such as the Central Valley.
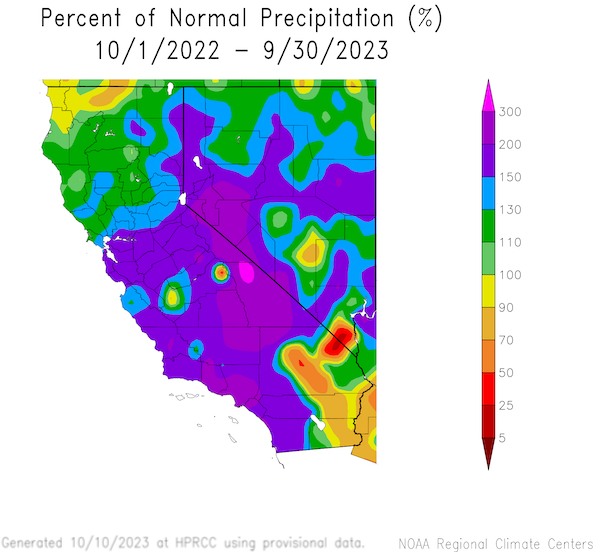
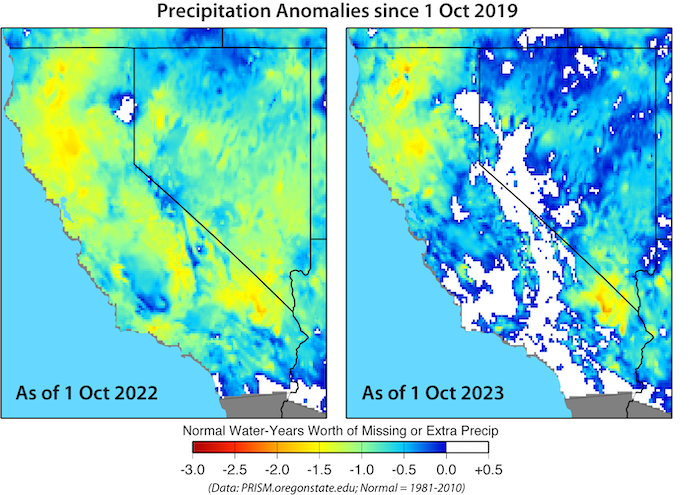
- Wetter than normal conditions—greater than 150% of normal for many areas—brought the end of the 4th multi-year drought period in the last two decades.
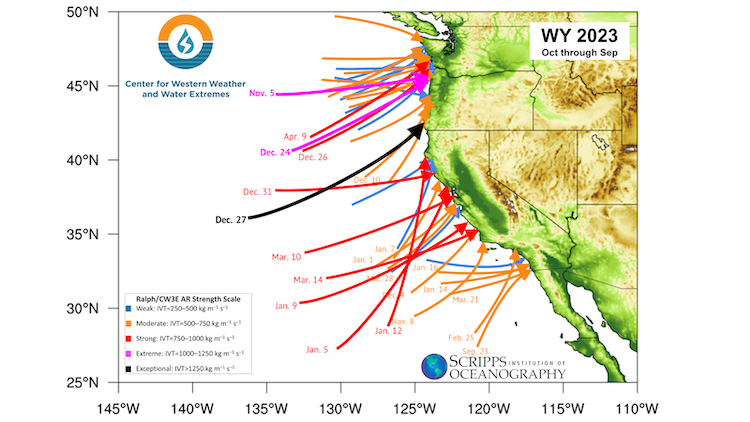
- Over Water Year 2023, California experienced 31 atmospheric rivers (ARs) (many penetrating into Nevada), based on CW3E analysis. Cumulatively, precipitation reduced or eliminated precipitation deficits that have been building since Water Year 2020.
- Most recently, parts of southeastern California and adjacent Nevada and Utah saw drought removal/improvement due to heavy rainfall from Hurricane Hilary and its remnants.
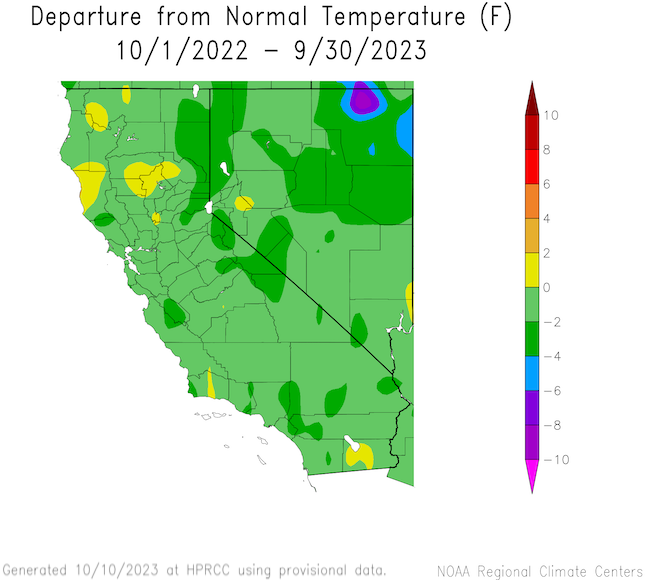
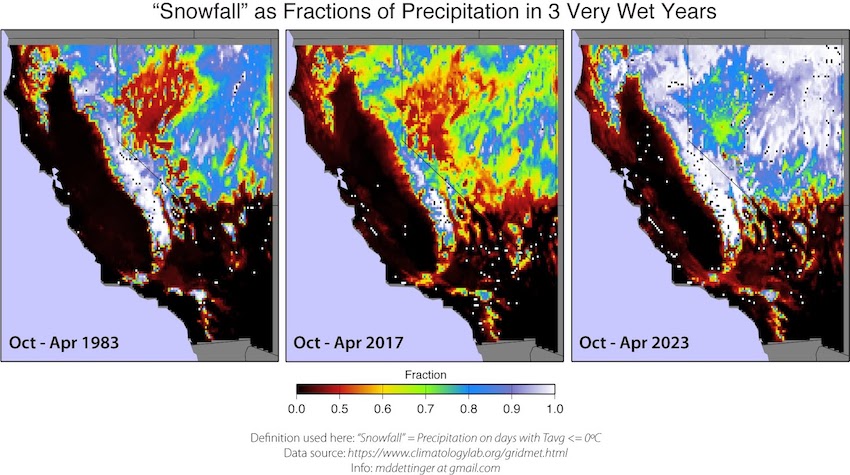
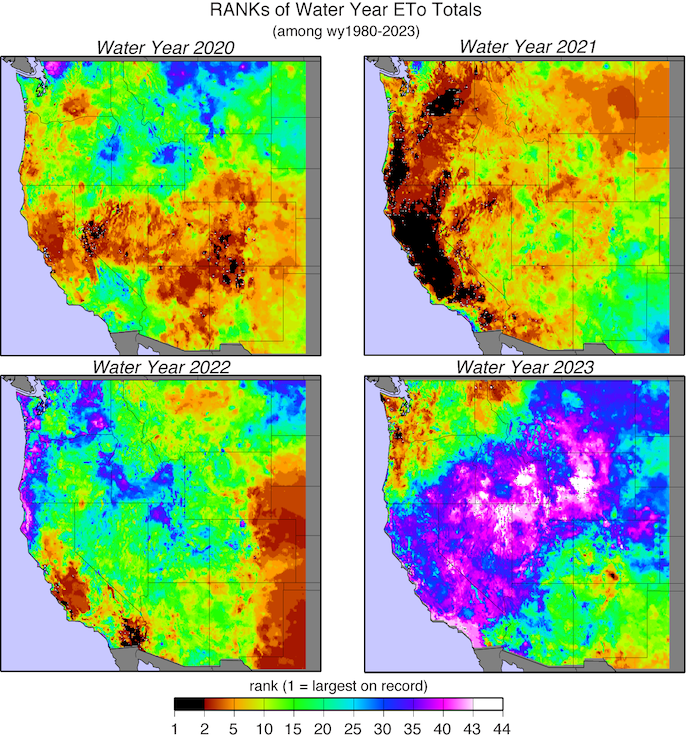
- Water Year 2023 was also one of the coolest in the last 40 years, resulting in more precipitation falling as snow instead of rain in the Sierra Nevada and much of Nevada, even compared to other wet years like 1983 and 2017. The cool spring resulted in a slow spring melt of the massive snowpack that accumulated in January and March.
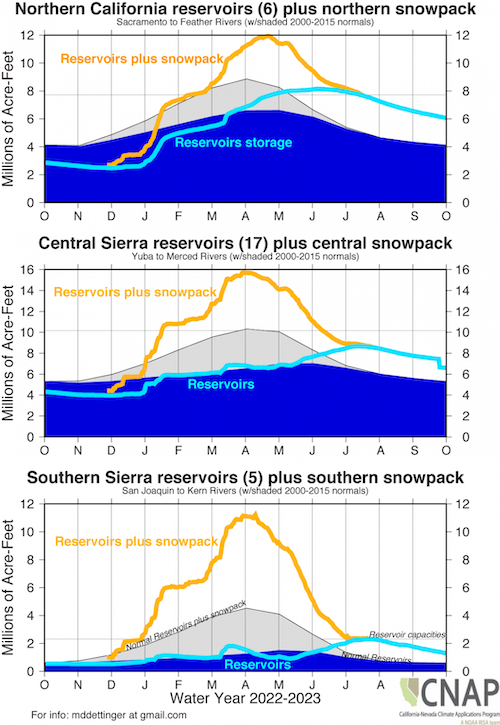
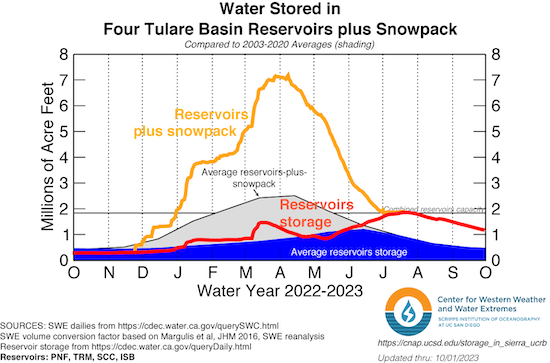
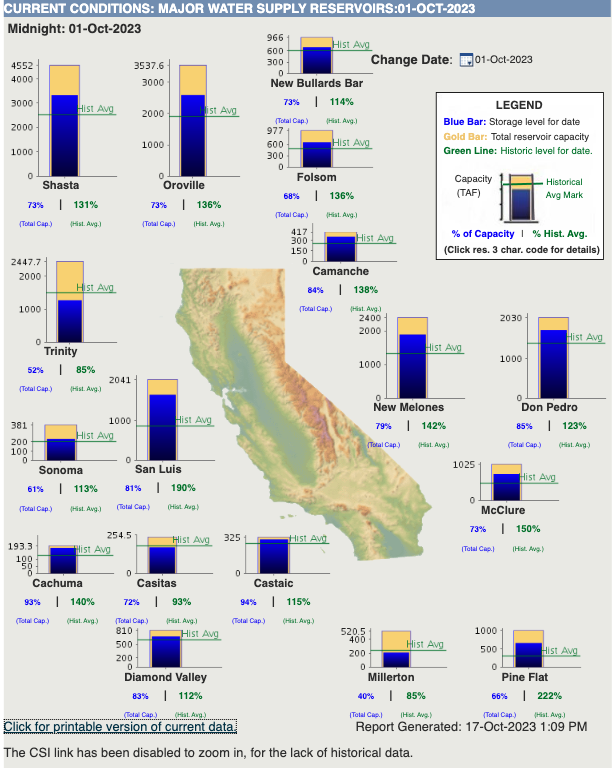
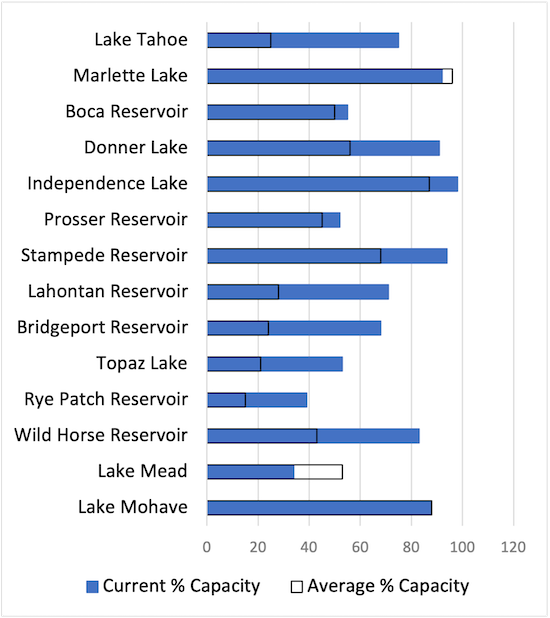
- Reservoirs throughout the region are at or above historical averages going into Water Year 2024.
- The Colorado River Basin experienced a wet year as well, with Lake Powell plus upstream reservoirs increasing by about 5 million acre-feet (maf) during Water Year 2023. Based on the current forecast of 9.40 maf unregulated inflow for Water Year 2024, the October 24-Month Study projects Lake Powell elevation will end calendar year 2024 near 3582.86 feet with approximately 9.52 maf in storage (41% of capacity)
- Thus far this fire season, fire activity has been relatively low with the exception of northwest California in August, requiring extra resources in the region.
- For more information, check out Living with Drought in Nevada and the California Water Year 2023 Brochure.
How is drought affecting your neighborhood? Click to see drought indicators, outlooks, and historical conditions by city, county, and state, as well as sign up for alerts.
View local drought information
U.S. Drought Monitor 52-Week Change Map
Historical U.S. Drought Monitor Conditions for California-Nevada
Percent of Normal Precipitation: Water Year 2023
Departure from Normal Temperature: Water Year 2023
Atmospheric River Landfall Events
California-Nevada Precipitation Anomalies Since October 1, 2019
Percentage of California with Lowest Precipitation Deficits Since October 2019
Fraction of Precipitation That Fell as Snow: October–April 1983, 2017, 2023
Evaporative Demand Rankings for the Last 4 Water Years
Water Storage in the Sierra and Tulare Basin
California Major Water Supply Reservoirs
Nevada Reservoir Levels
Water Year 2023 Drought Impact Summary
At the start of Water Year 2023, drought continued to impact California and Nevada water supply, agriculture, ecosystems and more. Extremely wet conditions, in part due to 32 atmospheric rivers, shifted the region’s focus from drought concerns to flooding within months. Actions included California Governor Newsom issuing an Executive Orders enabling more recharge of flood water to test a drought adaptation strategy. In the Colorado River System, the Inflation Reduction Act and Bipartisan Infrastructure Law together include $15.4 billion to enhance the West’s resilience to drought.
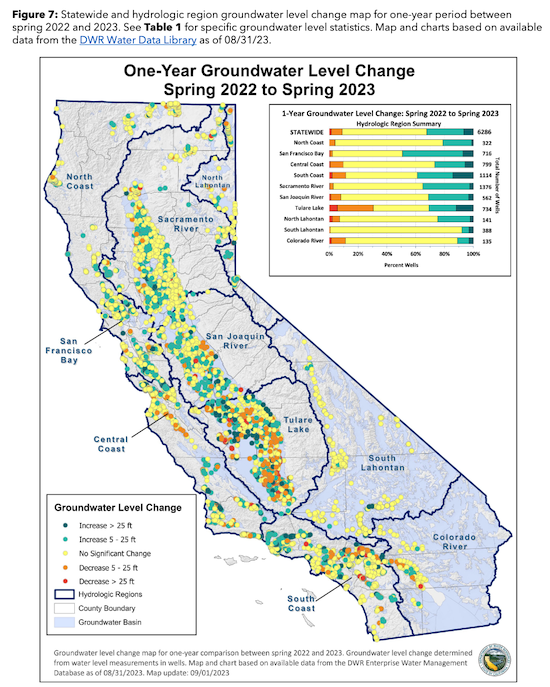
However, long-term drought impacts remain. For example, there are limits to groundwater recovery despite a wet year. According to the California Natural Resources Agency semi-annual groundwater conditions update, “It will likely require several more wet years and more focused efforts to increase recharge and reduce pumping to recover from the most recent drought and the cumulative depletion of groundwater aquifers that has occurred over decades.” Managing water and farmland transitions in the San Joaquin Valley with Sustainable Groundwater Management Act will also be key (Public Policy Institute of California). The California Department of Water Resources also awarded $187 million to 32 groundwater subbasins through the Sustainable Groundwater Management Grant Program in September.
California Groundwater Level Change: Spring 2022–Spring 2023
Recent and Potential Drought Impacts
Find additional impacts through the National Drought Mitigation Center’s Drought Impact Reporter.
Drought & Climate Outlook
El Niño–Southern Oscillation (ENSO)
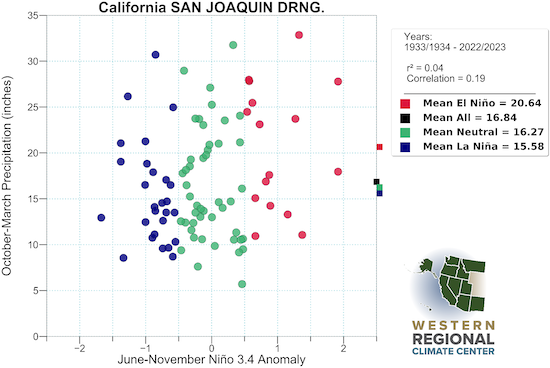
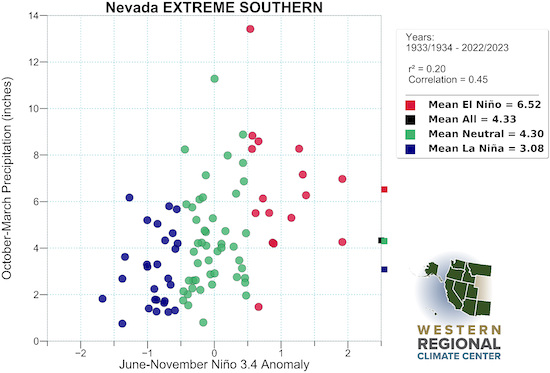
NOAA’s ENSO alert system status is currently an El Niño Advisory. El Niño is anticipated to continue through the Northern Hemisphere spring (with an 80% chance during March–May 2024). At its peak (November–January), nearly all models suggest a moderate-to-strong El Niño. For more information, check out the NOAA ENSO blog and current status presentation. Note, not all El Niños elicit the same response in California and Nevada and can vary. Explore this more for your region of interest with the newly updated Western Regional Climate Center ENSO Precipitation tool.
Past ENSO Conditions vs. October–March Precipitation
Subseasonal to Seasonal Drought, Temperature, Precipitation, and Fire Outlooks
The autumn and early winter months are a highly transitional time of year, as the wet season begins to ramp up along the West Coast. Current conditions have led to a normal or below-normal fire potential outlook for California-Nevada. Despite current ENSO conditions, it remains to be seen if we can expect canonical El Niño impacts in the U.S., including in California and Nevada.
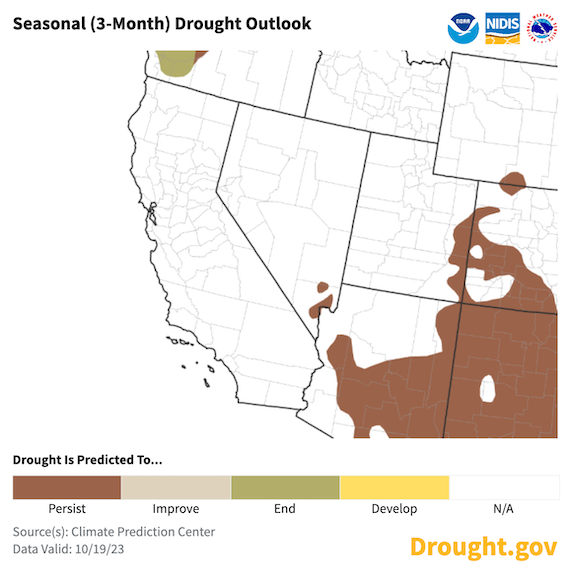
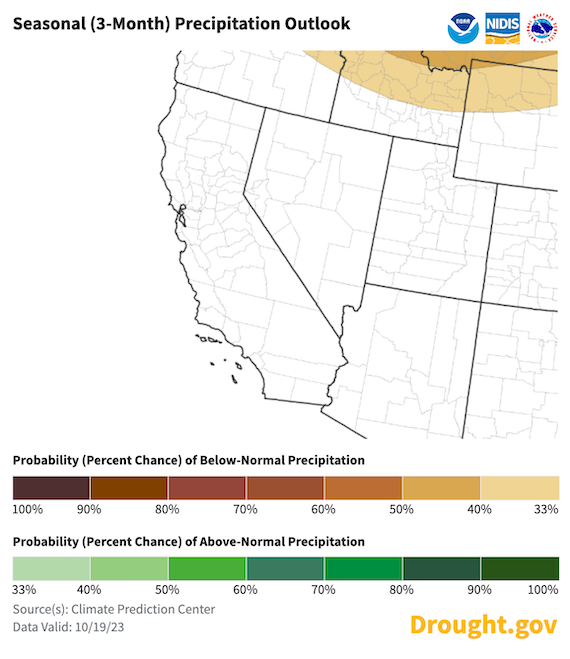
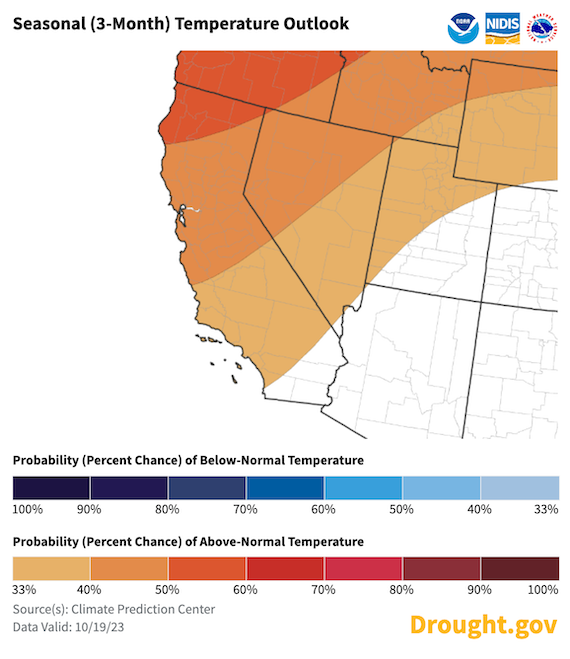
Short term forecasts (<2 weeks) show the potential for a cooler, wetter period for California and Nevada. However, over the next 3 months, the National Weather Service’s Climate Prediction Center seasonal forecast leans towards warmer than normal conditions with an equal chance of above-normal, normal, or below-normal precipitation. Given this, the seasonal drought outlook primarily shows no drought development for the region and drought persistence in the small area of remaining drought in southern Nevada.
Seasonal Drought Outlook: October 19–January 31
Seasonal (3-Month) Outlooks Temperature and Precipitation Outlooks
Drought Early Warning Resources
Prepared By
Amanda Sheffield
NOAA/NIDIS California-Nevada DEWS Regional Drought Information Coordinator, Cooperative Institute for Research in Environmental Sciences (CIRES)
Julie Kalansky
Program Manager, California-Nevada Adaptation Program (A NOAA CAP/RISA team)
This drought status update is issued in partnership between the National Oceanic and Atmospheric Administration (NOAA), the California-Nevada Adaptation Program (a NOAA CAP/RISA team), and the Western Regional Climate Center at the Desert Research Institute to communicate the current state of drought conditions in California-Nevada based on recent conditions and the upcoming forecast. NIDIS and its partners will issue future drought status updates as conditions evolve.
