This Year’s Snow Season Wipes Away Drought in Much of the West with the Exception of the Pacific Northwest
Key Points
- An above-normal start to winter precipitation in the West—with the exception of the Pacific Northwest—accelerated when a series of 9 atmospheric rivers over a 3 week period brought significant amounts of rain and snow. The precipitation pattern this year was unlike that of last year, when the fire hose of storms shut off in January.
- In the Sierra Nevada, Great Basin, and Colorado River Basin, the cool, wet, and snowy year brought major drought relief. As of mid-June, observed water year runoff has been above normal, and forecasts indicate that above-normal summer flows will persist. It is important to note that any potential groundwater infiltration and recharge takes longer to respond.
- Higher-elevation snowpack across the West remains, and is remarkably deep for mid-June in parts of the Sierra Nevada and southern Cascades.
- Persistent and widespread anomalously cold winter temperatures, which have not occurred in recent years, aided snowpack development.
- Lakes Powell and Mead, the two largest reservoirs in the country, have benefited this year, but it will take much more than one wet year to refill them after over 20 years of decreasing water levels.
- Rapid snowmelt and early melt out have been problematic in parts of the Pacific Northwest. Abnormal dryness (D0) and moderate drought (D1) reappeared in Washington and Oregon over the past three weeks.
- El Niño conditions have developed and are expected to gradually strengthen into winter. A stronger El Niño means global temperature, precipitation, and other patterns are more likely to reflect the expected El Niño impacts, such as wetter conditions in the southern U.S. and warmer conditions in the northern U.S. Historically, impacts from the transition to El Niño begin to be felt in early fall.
Snow Telemetry (SNOTEL) snow water equivalent (SWE) values (inches) for June 5, 2023. Only stations with at least 20 years of data are included in the station averages.
For an interactive version of this map, please visit NRCS.
Snow Telemetry (SNOTEL) snow water equivalent (SWE) water year peak as a percentage of the USDA Natural Resources Conservation Service (NRCS) 1991–2020 median for June 5, 2023. Only stations with at least 20 years of data are included in the station averages.
For an interactive version of this map, please visit NRCS.
Snow Water Equivalent Values (Inches)
Percent of Median Snow Water Equivalent
< 50% of Median
Current snow water equivalent (SWE) is less than 50% of the median SWE value for this day of the year, compared to historical conditions from 1991–2020.
50%–70% of Median
Current snow water equivalent (SWE) is between 50%–70% of the median SWE value for this day of the year, compared to historical conditions from 1991–2020.
70%–90% of Median
Current snow water equivalent (SWE) is between 70%–90% of the median SWE value for this day of the year, compared to historical conditions from 1991–2020.
90%–110% of Median
Current snow water equivalent (SWE) is between 90%–110% of the median SWE value for this day of the year, compared to historical conditions from 1991–2020.
110%–130% of Median
Current snow water equivalent (SWE) is between 110%–130% of the median SWE value for this day of the year, compared to historical conditions from 1991–2020.
130%–150% of Median
Current snow water equivalent (SWE) is between 130%–150% of the median SWE value for this day of the year, compared to historical conditions from 1991–2020.
>150% of Median
Current snow water equivalent (SWE) is greater than 150% of the median SWE value for this day of the year, compared to historical conditions from 1991–2020.
Snow Telemetry (SNOTEL) snow water equivalent (SWE) values (inches) for June 5, 2023. Only stations with at least 20 years of data are included in the station averages.
For an interactive version of this map, please visit NRCS.
Snow Telemetry (SNOTEL) snow water equivalent (SWE) water year peak as a percentage of the USDA Natural Resources Conservation Service (NRCS) 1991–2020 median for June 5, 2023. Only stations with at least 20 years of data are included in the station averages.
For an interactive version of this map, please visit NRCS.
An updated, interactive version of this map is available through the USDA's Natural Resources Conservation Service.
An updated, interactive version of this map is available through the USDA's Natural Resources Conservation Service.
Water Year 2023 Snow Drought Conditions Summary
The 2022–2023 snow season started off relatively active across the West, with a few modest storms bringing snow accumulations to the mountains in early November. By the start of December, snow water equivalent (SWE) across much of the region was above normal. Starting in early December, several storm cycles brought moisture-laden families of atmospheric rivers to the West Coast. Most of the landfalls occurred in California. The strongest series of storms occurred steadily from December 27 through January 17. By the end of January, SNOTEL sites across much of the Sierra Nevada, Great Basin, Utah, Arizona, and western Colorado were at >150% of normal SWE. Unlike the 2021–2022 water year, in which snowfall was abundant early in winter but scarce after early January, the storm train continued with another series of strong storms across the West from late February through mid-March. By April 1, snowpack was above normal across nearly the entire West, with few areas of snow drought. In some parts of the Sierra Nevada, Great Basin, Utah, Arizona, and western Colorado, SWE reached 200%–300% of normal and, in certain locations, set records. The northern Pacific Northwest and northwestern Montana was on the periphery of the storm track during most of winter. In these areas, snow drought developed as snowmelt began, and summer drought conditions are developing or seem likely to develop.
During the past winter, unlike many recent years, anomalously cold temperatures were persistent and widespread. November through March temperatures were among the lowest third of all years since 1895 across much of the West. Temperatures in parts of California, Nevada, Oregon, and Idaho were among the coldest ten percent. Impacts of the cold temperatures included an unusual proportion of precipitation falling as snow compared to rain, snow persisting at lower elevations for longer than usual, and little mid-winter snow melt at higher elevations.
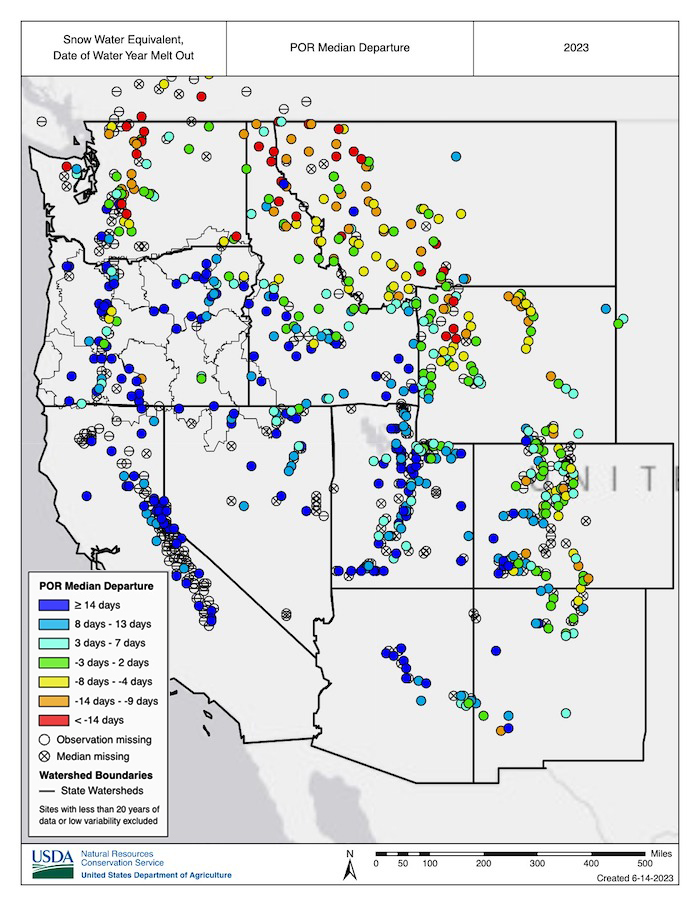
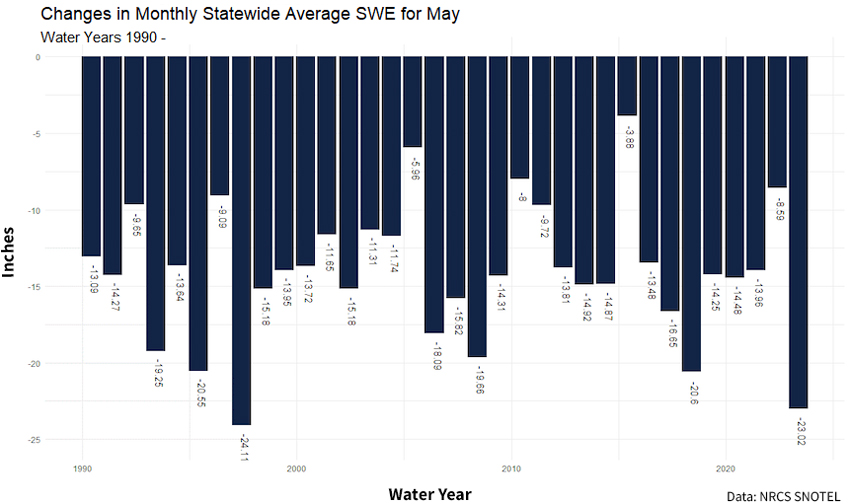
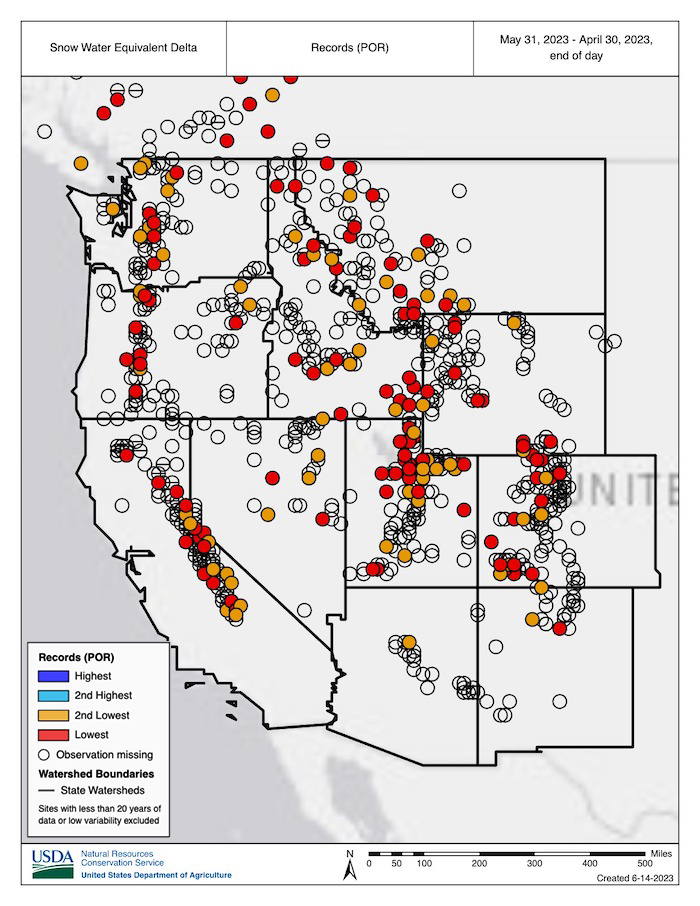
April brought a drying and warming trend to the Southwest and above-normal precipitation and cooler temperatures to Oregon and Washington, reducing some of the snowpack deficits in the Cascade Range. However, the cool and wet conditions in the Pacific Northwest were short-lived. Throughout May and into early June, temperatures across the Pacific Northwest and northern Rocky Mountains were above normal, with record warmth in parts of northern Oregon, Washington, northern Idaho, and northwestern Montana. The warm temperatures combined with relatively dry conditions have led to rapid snow loss across the region, and snow has melted one to three weeks early at many SNOTEL stations (70 sites in Oregon, Washington, Idaho, and Montana melted out more than a week early). May snowmelt reached record highs across many western regions, not just the Pacific Northwest. However, in terms of drought development, the early snowmelt was only problematic for parts of the Pacific Northwest and northern Rocky Mountains, where snowpack at the beginning of May was near normal or below normal (unlike the near-record snowpack in the Sierra Nevada, Utah, and western Colorado). The rapid snow loss, low winter precipitation, and forecasted below-normal summer runoff have renewed concerns about drought in the Pacific Northwest, with abnormal dryness (D0) and moderate drought (D1) reappearing in portions of western Washington and Oregon over the past three weeks.
Currently, snowpack persists at higher elevations throughout the West and remains remarkably deep for mid-June in parts of the Sierra Nevada and southern Cascade Range. A few notable locations include Leavitt Lake in the central Sierra Nevada, with 92 inches of SWE remaining as of June 12; Lower Lassen Peak in the southern Cascade Range, with 82 inches of SWE remaining; and Mount Rose Ski Area near Lake Tahoe, with 43 inches of SWE remaining.
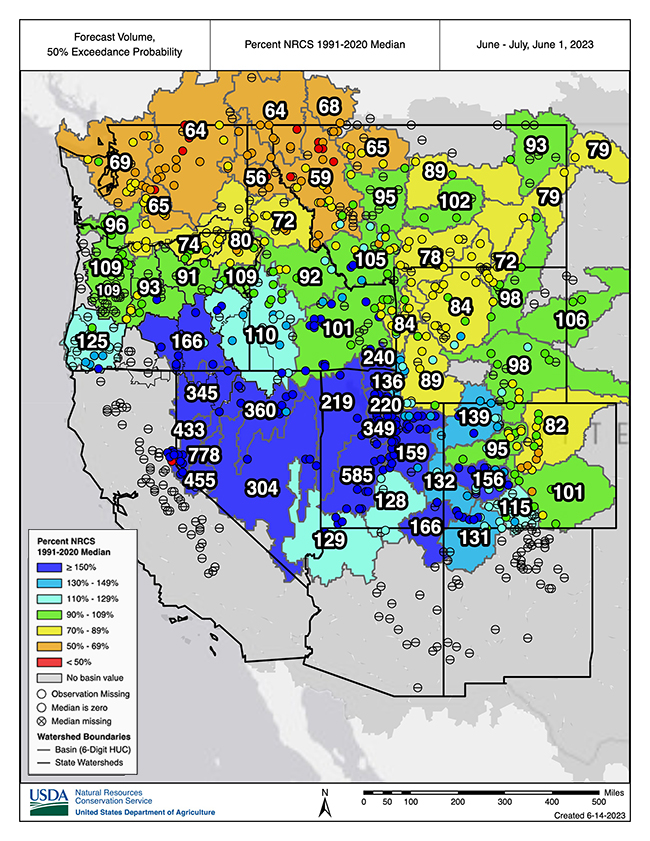
For California, the Great Basin, and the Colorado River Basin, the cool, wet, and snowy year brought major drought relief after three consecutive dry years. Observed water year runoff in these regions was above normal through early June, and the forecasts indicate above-normal flows persisting throughout summer. Major reservoirs, with the exception of Lakes Powell and Mead, have already filled or are expected to fill by the end of summer. This year was still beneficial for Lakes Powell and Mead, the two largest reservoirs in the country, but it will take much more than one wet year to refill these reservoirs after over 20 years of falling water levels. The June 12th update from the U.S. Bureau of Reclamation indicated that Lake Powell was at 37% of capacity and Lake Mead was at 31% of capacity, with forecasted April–July inflows into Powell at 167% of normal. Wet years like this one are not unprecedented in the context of the current multidecadal drought. Long-term drought recovery is complex, and it is important to note that groundwater infiltration and recharge of aquifers, which is impacted by the characteristics of snowmelt, can take longer to respond and require more than one good year of precipitation.
Median Departure from the Date of SWE Water Year Melt Out
Washington Statewide Average SWE for May
SNOTEL SWE Delta Records: April 30–May 31
June–July Streamflow Forecast Volume
For More Information, Please Contact:
Daniel McEvoy
Western Regional Climate Center
Daniel.McEvoy@dri.edu
Amanda Sheffield
NOAA/NIDIS California-Nevada Regional Drought Information Coordinator
Amanda.Sheffield@noaa.gov
Britt Parker
NOAA/NIDIS Pacific Northwest Regional Drought Information Coordinator
Britt.Parker@noaa.gov
NIDIS and its partners launched this snow drought effort in 2018 to provide data, maps, and tools for monitoring snow drought and its impacts as well as communicating the status of snow drought across the United States, including Alaska. Thank you to our partners for your continued support of this effort and review of these updates. If you would like to report snow drought impacts, please use the link below. Information collected will be shared with the states affected to help us better understand the short term, long term, and cumulative impacts of snow drought to the citizens and the economy of the regions reliant on snowpack.
Report Your Snow Drought Impacts
Data and Maps | Snow Drought
Research and Learn | Snow Drought


