2023 Winter Deluge Provides Relief Across Much of the West, But Long-Term Drought Questions Remain
- The total area of the western U.S. that is in drought is nearly 50% less than at the beginning of the water year (October 2022), according to the U.S. Drought Monitor.
- Wetter and cooler-than-normal conditions have pivoted the focus from drought to flood, snowmelt, and runoff management.
- The Pacific Northwest did not benefit from the winter deluge as much as the rest of the West, and spring and summer outlooks point to the potential for drought development.
- Wet years like this one (and 2016–2017) are not unprecedented in the context of the current multidecadal drought. As such, all 11 western states still report some degree of drought.
The U.S. Drought Monitor depicts the location and intensity of drought across the country. The map uses 5 classifications: Abnormally Dry (D0), showing areas that may be going into or are coming out of drought, and four levels of drought (D1–D4).
View more current conditions maps.
This U.S. Drought Monitor change map shows where drought and abnormal dryness have improved, remained the same, or worsened from the start of the water year (October 1, 2022) to May 9, 2023. Yellow/orange hues show areas where drought worsened, while green hues show drought improvement.
U.S. Drought Monitor
D0 - Abnormally Dry
Abnormally Dry (D0) indicates a region that is going into or coming out of drought, according to the U.S. Drought Monitor. View typical impacts by state.
D1 – Moderate Drought
Moderate Drought (D1) is the first of four drought categories (D1–D4), according to the U.S. Drought Monitor. View typical impacts by state.
D2 – Severe Drought
Severe Drought (D2) is the second of four drought categories (D1–D4), according to the U.S. Drought Monitor. View typical impacts by state.
D3 – Extreme Drought
Extreme Drought (D3) is the third of four drought categories (D1–D4), according to the U.S. Drought Monitor. View typical impacts by state.
D4 – Exceptional Drought
Exceptional Drought (D4) is the most intense drought category, according to the U.S. Drought Monitor. View typical impacts by state.
Drought Degradation
5-Category Degradation
Drought/dryness has worsened by 5 categories, according to the U.S. Drought Monitor.
4-Category Degradation
Drought/dryness has worsened by 4 categories, according to the U.S. Drought Monitor.
3-Category Degradation
Drought/dryness has worsened by 3 categories, according to the U.S. Drought Monitor.
2-Category Degradation
Drought/dryness has worsened by 2 categories, according to the U.S. Drought Monitor.
1-Category Degradation
Drought/dryness has worsened by 1 category, according to the U.S. Drought Monitor.
Drought Improvement
1-Category Improvement
Drought/dryness has improved by 1 category, according to the U.S. Drought Monitor.
2-Category Improvement
Drought/dryness has improved by 2 categories, according to the U.S. Drought Monitor.
3-Category Improvement
Drought/dryness has improved by 3 categories, according to the U.S. Drought Monitor.
4-Category Improvement
Drought/dryness has improved by 4 categories, according to the U.S. Drought Monitor.
5-Category Improvement
Drought/dryness has improved by 5 categories, according to the U.S. Drought Monitor.
The U.S. Drought Monitor depicts the location and intensity of drought across the country. The map uses 5 classifications: Abnormally Dry (D0), showing areas that may be going into or are coming out of drought, and four levels of drought (D1–D4).
View more current conditions maps.
This U.S. Drought Monitor change map shows where drought and abnormal dryness have improved, remained the same, or worsened from the start of the water year (October 1, 2022) to May 9, 2023. Yellow/orange hues show areas where drought worsened, while green hues show drought improvement.
The U.S. Drought Monitor map is updated weekly on Thursday mornings, with data valid through the previous Tuesday at 7 am Eastern.
The U.S. Drought Monitor and its change maps areupdated weekly on Thursday mornings, with data valid through the previous Tuesday at 7 am Eastern.
How much precipitation has fallen and where? What does this mean for western drought?
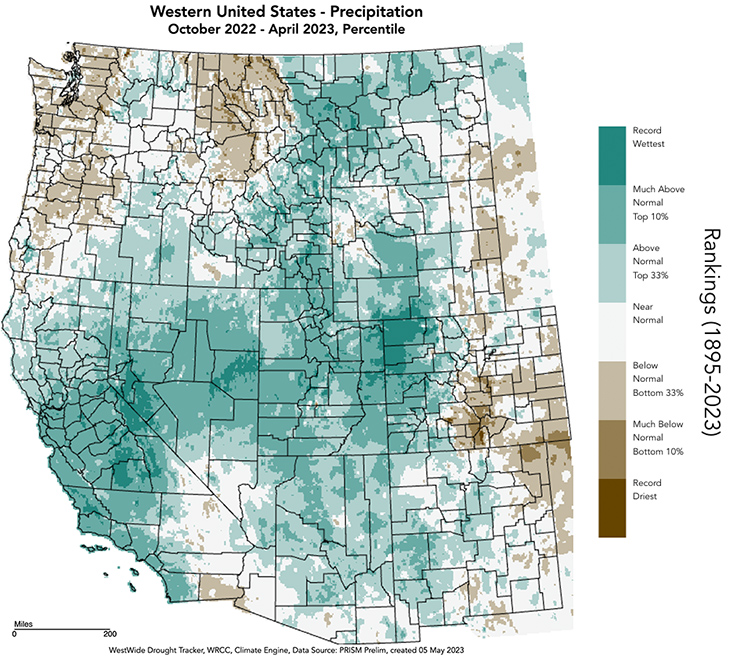
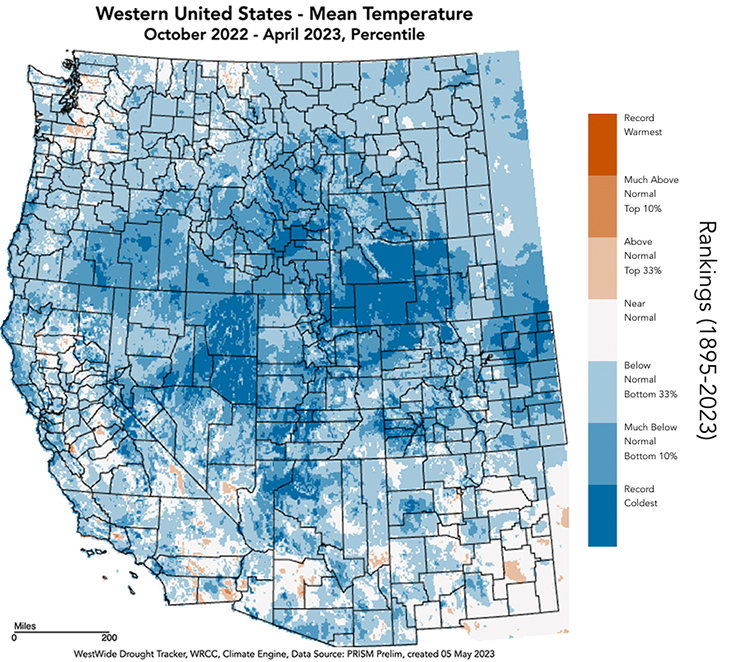
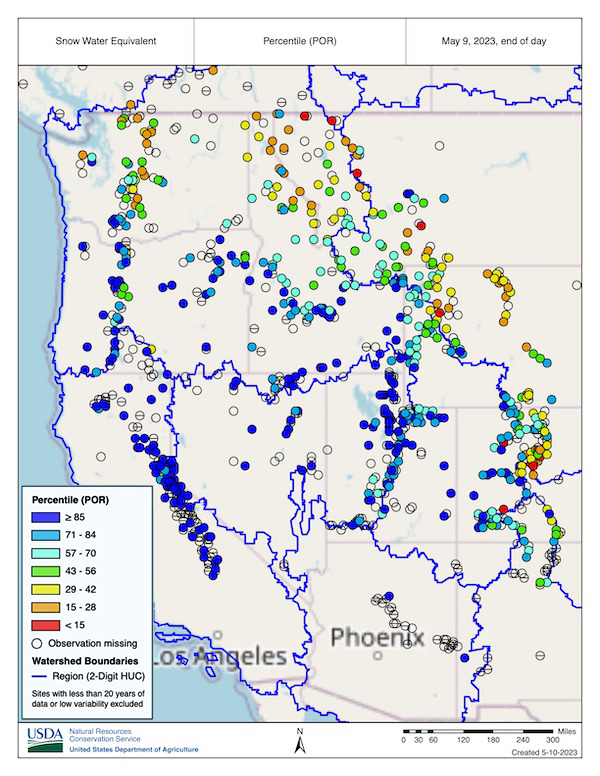
Since the start of Water Year 2023 (October 1, 2022), precipitation has been well above normal across much of the western U.S. (Fig. 1), leading to a 1 to 5 drought class improvement across most western states according to the U.S. Drought Monitor. Combined with below-normal temperatures (Table 1, Fig. 1), records have been broken for peak snow water equivalent (SWE) (Fig. 2) in some regions, such as the Sierra Nevada and areas of the Upper Colorado River Basin. However, not all of the West set SWE records or benefited as much from this welcome reprieve.
As of early May, SWE percentiles (Fig. 2) are still high across some western basins (50% to >85%), except for parts of the Pacific Northwest. Runoff from the snowpack has caused major flooding in many areas, including California, Arizona, western Colorado, Idaho, Wyoming, and Utah. Flooding could continue as spring warming accelerates snowmelt. High SWE and runoff have improved surface water storage in reservoirs, boosting water supply. However, the extent to which these conditions will bolster groundwater recharge is dependent on various factors, including rate and velocity of runoff and water demand. Risk of flooding and runoff management are likely to continue through summer, impacting agriculture, human health, infrastructure, and recreation. Another important component to this record-setting year is the potential benefits to ecosystems, native plants and animals, and commercial and recreational fisheries.
Key Points by Region
Pacific Northwest
- In much of the Pacific Northwest, and in contrast to many other parts of the West, Water Year 2023 has been drier than normal (Fig. 1, Table 1). These dry conditions persisted despite the presence of La Niña, which often is associated with above-average precipitation in the Pacific Northwest. As a result, according to the U.S. Drought Monitor, there was sustained drought or minor drought development in parts of the region but some drought relief elsewhere.
- Despite this dryness, which was accentuated by an unseasonably dry March in the northern parts of the region, cooler than normal temperatures have sustained the slightly below-normal to normal SWE (Fig. 2) up until recently. The last two weeks have seen rapid snowmelt in the region with an early season heatwave forecasted that could accelerate melting rates and drought development, particularly in Washington.
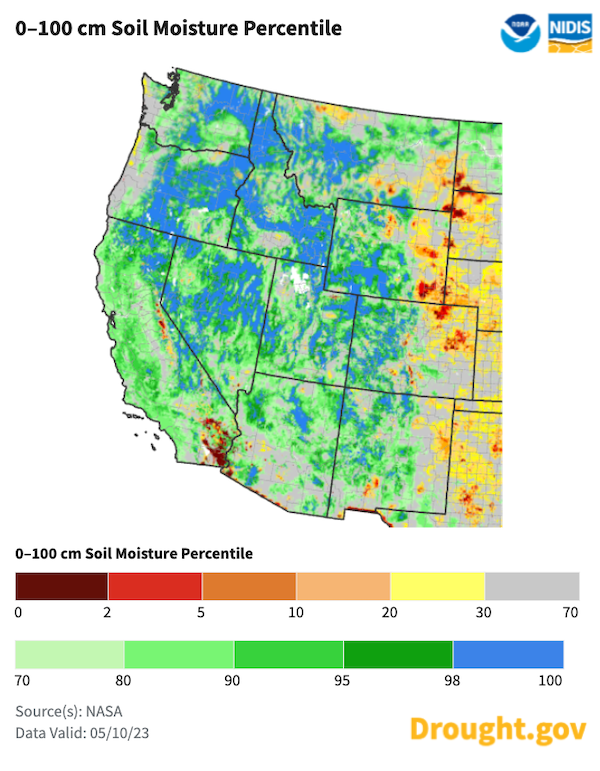
- Progressing into spring and summer, it is key to monitor the rate, timing, and amount of snowmelt along with antecedent soil moisture (Fig. 4), which is currently low throughout the region given previous dry conditions. Soil moisture is an important driver of instream flows because dry soils can absorb more water to revitalize shallow groundwater stores, leaving less water to run off into rivers and streams.
- While Oregon has had the strongest snowpack in the Pacific Northwest this year compared with historical standards, it may not be enough to alleviate long-term precipitation and soil moisture deficits that have accumulated during the last several years in central Oregon. Since fall 2019, the precipitation deficit in parts of central Oregon has been equivalent to a full year. The south-central Oregon climate division is now facing its fourth consecutive summer with more than half its area in the severe drought (D2) category or worse as depicted by the U.S. Drought Monitor. At the same time, temperatures and evaporation in central Oregon have been much higher than normal.
- Reservoir levels in central Oregon continue to be low and reflect these long-term precipitation deficits. Consequently, the Governor has declared drought in 6 counties in central and eastern Oregon as of early May, and 2 additional counties in these regions have since requested drought declarations.
Intermountain West
- Drought conditions across much of the region have improved over the water year, but have not been alleviated. As of May 11, 2023, 17.13% of the region is in drought, according to the U.S. Drought Monitor.
- Much of the Intermountain West received record snowfall over Water Year 2023. This culminated in record-high April 1 SWE levels in Utah and western Colorado. Utah surpassed the 1983 record for total snowfall statewide. Above-normal precipitation (Fig. 1) continued through early spring in Arizona, Utah, and western Colorado (150%–400% of normal during March) and in western Wyoming. However, snowfall in portions of Colorado and Wyoming east of the Continental Divide was only 25%–75% of normal.
- Streamflow volume forecasts are above and much-above average for the Upper Colorado River Basin and the Great Basin (132%–145% of normal), with forecasted volumes reaching 80%–280% of average. Below normal (60%–90%) to near-normal (90%–110%) seasonal streamflow volumes are forecasted for the Arkansas, South Platte, Shoshone, Tongue, and Yellowstone Rivers. Above-normal seasonal streamflow (110%-130%) is forecasted for the Bighorn, Laramie, Powder, and Wind Rivers. Much-above normal seasonal streamflow (>130%) is forecasted for the remaining regional river basins, with streamflow forecasts ranging from 160% to 280% for the Lower Green, Provo and Utah Lake, Sevier, Six Creeks, Virgin, and Weber Rivers. Additionally, Rio Grande streamflows are forecasted to reach twice the 2022 levels.
- Seasonal streamflow forecasts for most large Upper Colorado River Basin reservoirs are much-above normal, with near-to-above normal forecasts for Green Mountain, Fontenelle, and Flaming Gorge Reservoirs. The forecast for inflow into Lake Powell is 172% of average, which will provide some reprieve from record-low water levels.
- While wetter soils and heavy snowpack benefit water supply, this year’s record-setting precipitation has already led to increased flood risk in Utah and Arizona. As temperatures warm, streamflows throughout the Colorado River Basin and Great Basin are forecasted to be well above normal, with increased flood risk in northern areas of the Great Basin, Yampa River Basin, Gunnison River Basin, Dolores River Basin, and Sevier River Basin.
California-Nevada
- After more than 3 years of drought, the U.S. Drought Monitor shows that drought primarily remains in parts of southeastern California and southern Nevada, which did not receive above-normal precipitation.
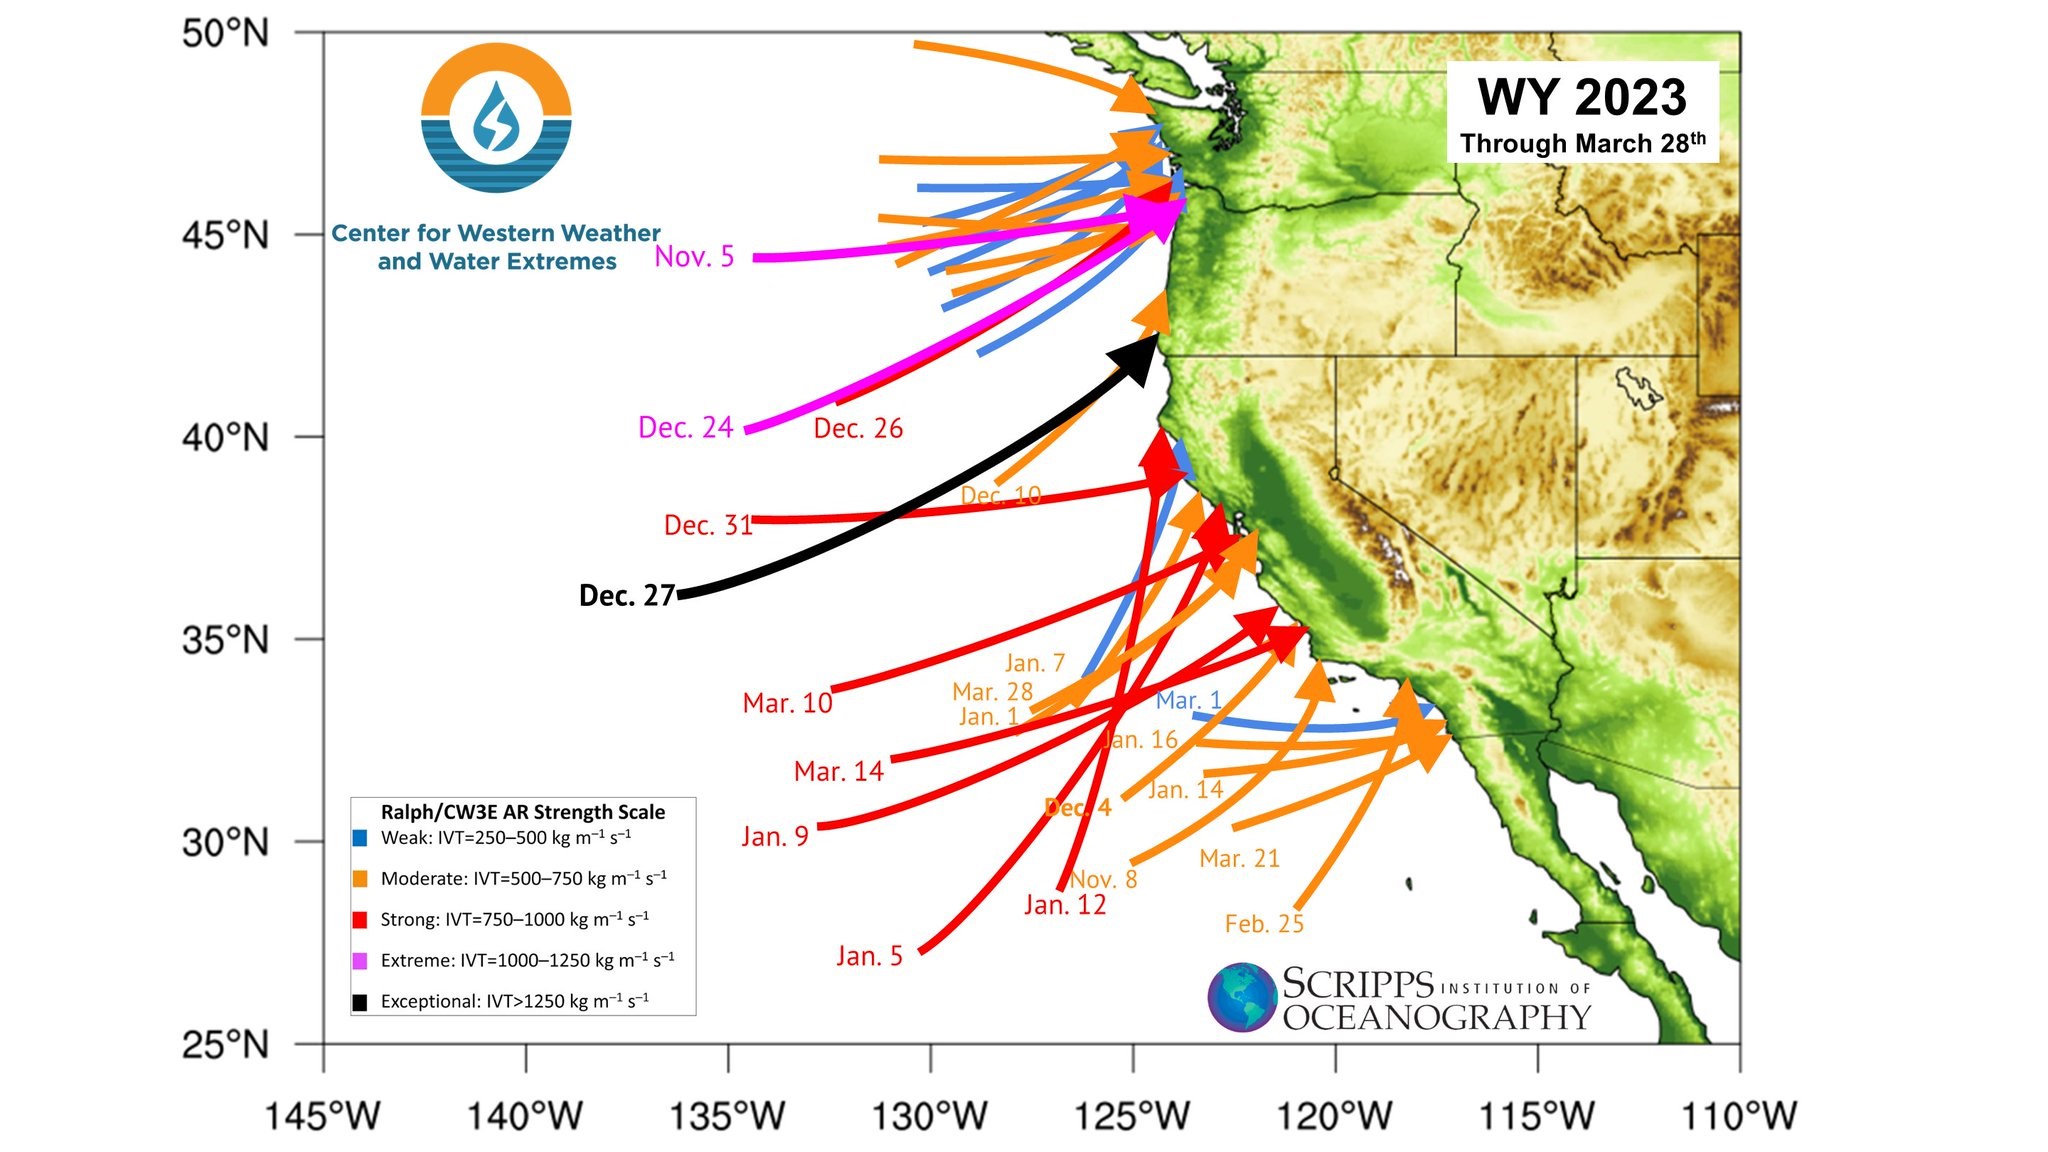
- The region benefited from 31 atmospheric rivers (ARs) since the start of the water year. While this number of ARs is not unheard of, 5 of this water year’s 7 strong or extreme ARs fell over the 3-week period from December 27 to January 17. Additional ARs, other storms, and cooler-than-normal temperatures (Table 1) combined to create a historic Sierra Nevada snowpack and record SWE across the Great Basin. As of May 9, 191% of April 1 Sierra snowpack remains.
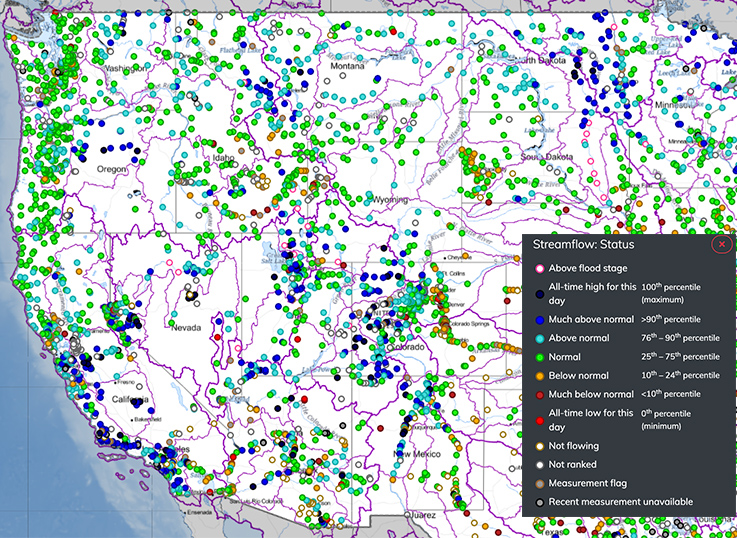
- Sierra Nevada water storage in reservoirs and the snowpack remains well above normal. Streamflow remains above normal (Fig. 3) with the exception of southern Nevada and southeastern California, and some streams are flowing at all-time high levels.
- In Nevada, end of April observations reported that reservoirs were at 33% of capacity, which is 59% of average. Many of California’s major reservoirs are near or above historical averages.
- California’s Department of Water Resources (DWR) reported a slower than normal statewide snowpack melt in April due to cool temperatures and cloud cover. Sustained high flows are a concern for people in the San Joaquin and Tulare Basins, and observational data are being incorporated into California DWR models to provide the most accurate snowmelt runoff forecasts currently possible to inform water supply and flood control planning.
- Despite the immediate benefits of the winter precipitation, the lingering effects of the recent drought cycle have led to closure of the chinook fishery through at least spring in Oregon and northern California. The fishery will take multiple years to recover.
Explore more current conditions & outlooks by state on Drought.gov’s new state pages:
View State Drought Information
|
Current % in Drought (Difference from Start of Water Year) |
Total Precipitation |
Ranking (of 128 years) |
Precipitation Anomaly |
Average Temperature |
Ranking (of 128 years) |
Temperature Anomaly |
|
|---|---|---|---|---|---|---|---|
|
Western U.S. |
22.64% (Δ51.26%) |
16.61” |
30th Wettest |
1.74” |
38.3°F |
30th Coldest |
-0.9°F |
|
California-Nevada DEWS |
|||||||
|
California |
5.95% (Δ94.05%) |
27.87” |
14th Wettest |
7.53” |
48.4°F |
36th Coldest |
-0.6°F |
|
Nevada |
22.11% (Δ77.89%) |
9.35” |
12th Wettest |
2.43” |
37.3°F |
20th Coldest |
-1.4°F |
|
Pacific Northwest DEWS |
|||||||
|
Idaho |
23.59% (Δ65.94%) |
16.55” |
61st Driest |
-0.54” |
30.3°F |
25th Coldest |
-1.4°F |
|
Montana |
33.79% (Δ66.21%) |
8.88” |
62nd Driest |
-0.14” |
27.6°F |
36th Coldest |
-1.2°F |
|
Oregon |
51.86% (Δ16.19%) |
24.46” |
51st Driest |
-1.80” |
37.0°F |
32nd Coldest |
-0.7°F |
|
Washington |
2.71% (Δ14.62%) |
30.94” |
41st Driest |
-3.18” |
36.8°F |
48th Coldest |
-0.2°F |
|
Intermountain West DEWS |
|||||||
|
Arizona |
1.46% (Δ55.26%) |
8.56” |
27th Wettest |
1.67” |
48.4°F |
33rd Coldest |
-0.7°F |
|
Colorado |
29.51% (Δ16.14%) |
9.76” |
46th Wettest |
0.78” |
32.3°F |
31st Coldest |
-0.9°F |
|
New Mexico |
32.10% (Δ44.7%) |
5.49” |
48th Wettest |
0.23” |
42.9°F |
54th Warmest |
0.5°F |
|
Utah |
19.26% (Δ80.74%) |
11.70” |
5th Wettest |
3.31” |
34.3°F |
26th Coldest |
-1.5°F |
|
Wyoming |
26.05% (Δ26.47%) |
8.55” |
57th Wettest |
0.26” |
26.9°F |
21st Coldest |
-1.8°F |
What is the current drought and climate outlook?
The NOAA National Weather Service Climate Prediction Center's outlooks for spring 2023 show either continuing cool, wet conditions or equal chances of below-, normal, or above-average temperature and precipitation across the West, with the exception of the Pacific Northwest. The seasonal forecast shows warm and dry conditions in the Pacific Northwest through the end of July, which will likely lead to drought development in Washington (Fig. 6). Drought is forecasted to persist in most of the remainder of the West with the exception of New Mexico, where forecasted warm, dry conditions may lead to further drought development in the western part of the state.
Given these outlooks and current conditions, flood risk over the coming months remains a concern for some areas, while National Interagency Fire Center Outlooks show normal or below-normal significant wildland fire potential until July. An El Niño Watch (indicating the development of an El Niño within the next 6 months) has been issued for summer and beyond (including a >90% chance of El Niño persisting into the Northern Hemisphere winter), but the timeline and potential strength of El Niño are still uncertain. If El Niño develops this year, it increases the odds of record-warm global temperatures. Upcoming summer, fall, and winter climate forecasts will include more information on El Niño development. See the NOAA ENSO blog for more information.

What does this mean for long-term drought?
Since the beginning of Water Year 2023 (October 2022), more than 3 dozen atmospheric rivers hit the West Coast and subsequently moved east, contributing to extremely wet conditions in many western states.While these storms didn’t deliver an equal share of precipitation to all western states, they shifted the focus from decadal drought to flooding and mud and debris slides. Wet years like this one (and 2016-2017) are not unprecedented in the context of the current multidecadal drought. As such, all 11 states still report some degree of drought.
In addition, although many surface water storage reservoirs across the western states have reported replenished water levels, the two largest reservoirs in the West (and the nation), Lake Powell and Lake Mead, are still at critically low levels despite the inflows to date and predicted inflows. The rate and timing of the snowmelt and runoff will drive instream flow levels and the amount of water that reaches conveyance and delivery systems. The runoff characteristics also drive how much of the melt water will reach storage reservoirs and irrigation ditches. Additionally, runoff rates influence the capability of stormwater management systems to channel melt water into catchment and management systems or cause flooding. Furthermore, the characteristics of the snowmelt impact whether the runoff rate and quantities allow for infiltration and recharge of underground aquifers.
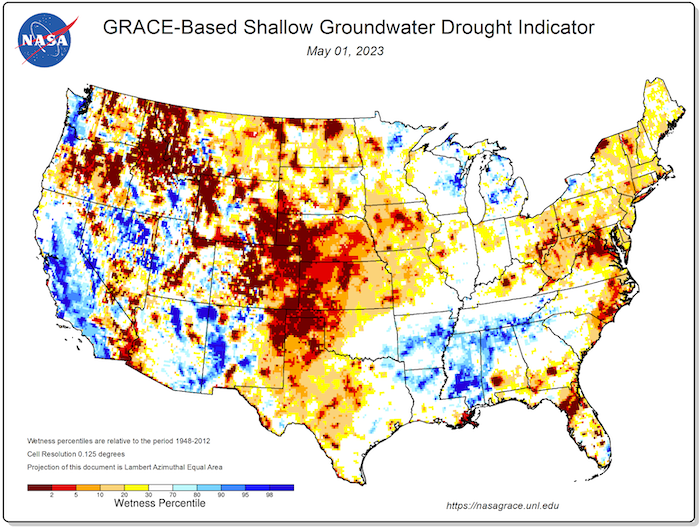
Groundwater infiltration will also benefit from record-setting snowpack, particularly if there is a slow melt. Some areas in the West have seen groundwater recovery (Fig. 5) this year, but many areas are still reporting below-average groundwater levels. Sustained presence of snow on the ground and in natural river channels allows for much-needed seep into unconstrained aquifers. Deep, constrained aquifers will not benefit from one banner snow year because recharge of those deep aquifers takes thousands of years. From this perspective, the multidecadal drought in the West has driven extensive depletion of deep aquifers. These aquifers, unlike smaller storage systems, will not receive a reprieve from this year’s snowpack. Also, over the past 25 years, only nine were wet years (normal to above normal). In the 20th century, by contrast, the ratio of wet to dry years was closer to 1:1. Experts estimate that the Colorado River storage system will need several additional years of precipitation levels comparable to those during Water Year 2023 to bring water levels in Lakes Powell and Mead to the historic average needed for consumptive and nonconsumptive uses.
Additional components of long-term drought are the rates and ranges of both seasonal and annual temperatures along with evaporative demand (i.e., temperature, humidity, wind speed, and incoming solar radiation), also known as atmospheric "thirst." While this year was anomalously cold, it is well documented that average temperatures are rising across the West and driving evaporation of surface water, evapotranspiration by vegetation, reduction in soil moisture, and drying of grasslands, shrublands, and forests. The timing, volume, and rate of snowmelt and runoff have also changed. These indicators of drought contribute to monitoring and managing long-term drought, onset and amelioration of drought, and wildfire risk. This year’s record-setting precipitation provides an opportunity to improve understanding of how a warming climate will impact water yields.
Prepared By
Amanda Sheffield, PhD
NOAA/NIDIS California-Nevada DEWS Regional Drought Information Coordinator, Cooperative Institute for Research in Environmental Sciences (CIRES)
Gretel Follingstad, PhD
NOAA/NIDIS Intermountain West DEWS Regional Drought Information Coordinator, Cooperative Institute for Research in Environmental Sciences (CIRES)
Adam Lang
NOAA/NIDIS Communication Coordinator, Cooperative Institute for Research in Environmental Sciences (CIRES)
This special edition drought status update is issued with partners from across the PNW, Intermountain West, and CA-NV Drought Early Warning Systems to communicate the current state of drought conditions in the seven westernmost CONUS states on the basis of recent conditions and the upcoming forecast. The contribution of partners is integral to understanding the nuances of drought and its impacts within the states and to ensuring early warning and updated information gets into the hands of those impacted on the ground. NIDIS and its partners will issue future drought updates as conditions evolve.


