Halfway through the water year, California-Nevada precipitation is near-normal, with above-normal snowpack.
Key Points
- After two normal to wet winters, less than 1% of California-Nevada is in drought.
- At the end of the climatological wet season (the first half of the water year) much of the region has received near-normal precipitation.
- February and March storms brought snow water equivalent near normal, mitigating any risk of snow drought in the region.
- As the region enters its climatological dry season (with the exception of monsoon-impacted areas), temperatures are leaning toward above normal in the short and long term with the potential to affect run-off from snowmelt.
- Fire risk throughout the region is predicted to be near- or below-normal from April through June.
This graph shows water storage—a combination of both snowpack and reservoir storage—in millions of acre-feet for 28 reservoirs in the Western Sierra Nevada for Water Year 2024 (October 1, 2023–April 11, 2024). This water year's reservoir (blue line) and reservoir + snowpack (orange line) storage are compared to normal conditions for 1985–2010 (blue and gray shading). Additional regions are available from CNAP Water Storage Tracking.
As of April 11, the Western Sierra reservoir plus snowpack storage is slightly above the typical peak April 1 total, with reservoir storage just below normal and snowpack just above normal.
Provided by M. Dettinger. This map is based on California Data Exchange Center (CDEC)/UCLA snow water equivalent (SWE) data and CDEC reservoir data.
Snow drought is a period of abnormally low snowpack for the time of year. Snowpack typically acts as a natural reservoir, providing water throughout the drier summer months. Lack of snowpack storage, or a shift in timing of snowmelt, can be a challenge for drought planning.
Learn MorePeriods of drought can lead to inadequate water supply, threatening the health, safety, and welfare of communities. Streamflow, groundwater, reservoir, and snowpack data are key to monitoring and forecasting water supply.
Learn MoreCurrent Water Storage (Water Year 2024)
Normal Water Storage (1985–2010)
This graph shows water storage—a combination of both snowpack and reservoir storage—in millions of acre-feet for 28 reservoirs in the Western Sierra Nevada for Water Year 2024 (October 1, 2023–April 11, 2024). This water year's reservoir (blue line) and reservoir + snowpack (orange line) storage are compared to normal conditions for 1985–2010 (blue and gray shading). Additional regions are available from CNAP Water Storage Tracking.
As of April 11, the Western Sierra reservoir plus snowpack storage is slightly above the typical peak April 1 total, with reservoir storage just below normal and snowpack just above normal.
Provided by M. Dettinger. This map is based on California Data Exchange Center (CDEC)/UCLA snow water equivalent (SWE) data and CDEC reservoir data.
Provided by M. Dettinger. This map is based on California Data Exchange Center (CDEC)/UCLA snow water equivalent (SWE) data and CDEC reservoir data.
Snow drought is a period of abnormally low snowpack for the time of year. Snowpack typically acts as a natural reservoir, providing water throughout the drier summer months. Lack of snowpack storage, or a shift in timing of snowmelt, can be a challenge for drought planning.
Learn MorePeriods of drought can lead to inadequate water supply, threatening the health, safety, and welfare of communities. Streamflow, groundwater, reservoir, and snowpack data are key to monitoring and forecasting water supply.
Learn MoreCurrent Conditions
- At the end of the first six months of the water year (October 1, 2023 to March 31, 2024), much of California and Nevada had 70%–130% of normal precipitation for this time of year.
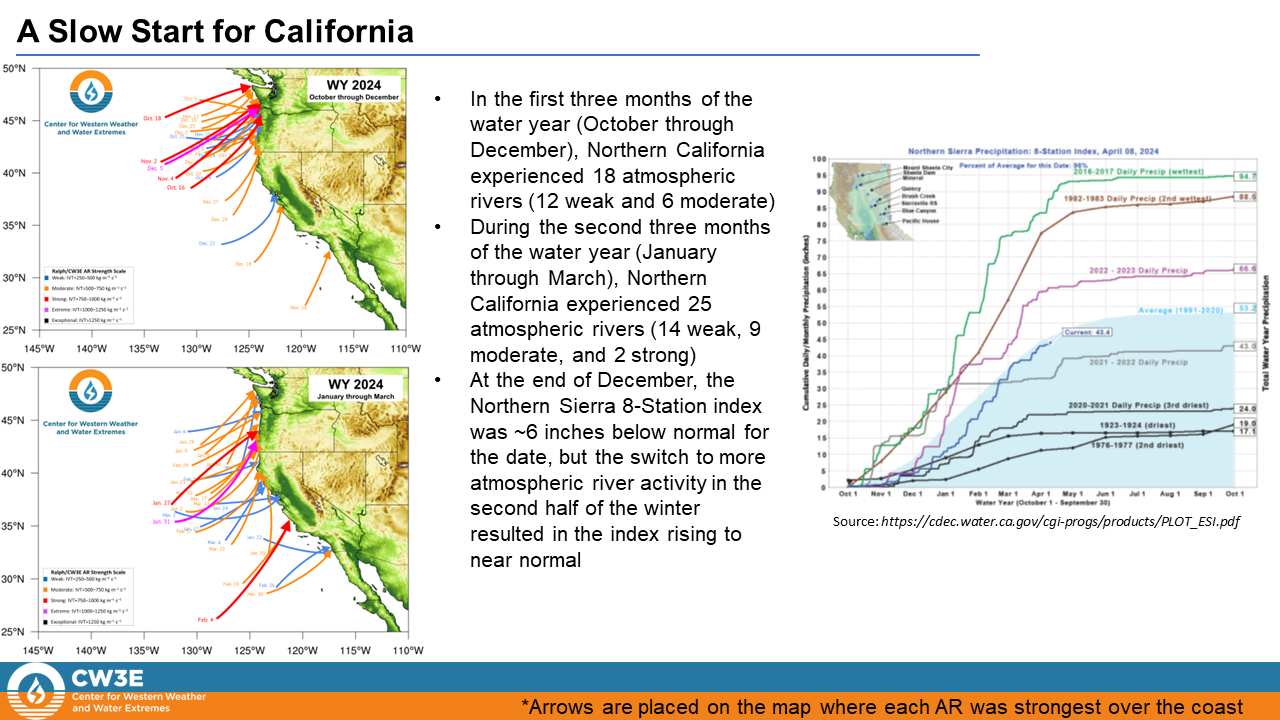
- More atmospheric rivers made landfall along the California coast between late January and March than October–December, which helped mitigate a dry start to the water year. Read more from the Center for Western Weather and Water Extremes (CW3E).
- Storms throughout February and March pushed snowpack over the April 1 median snow water equivalent (SWE) and mitigated risk of a snow drought. Read more from NIDIS.
- Soil moisture remains above normal throughout much of the region, benefitting from carryover from a wet last year and the recent storms.
Figure 1. Percent of Normal Water Year to Date Precipitation: First Half of Water Year (October-March)
Key Takeaway: The climatologically wet part of the water year ended with much of California-Nevada having near-normal precipitation (within about 30% of normal).
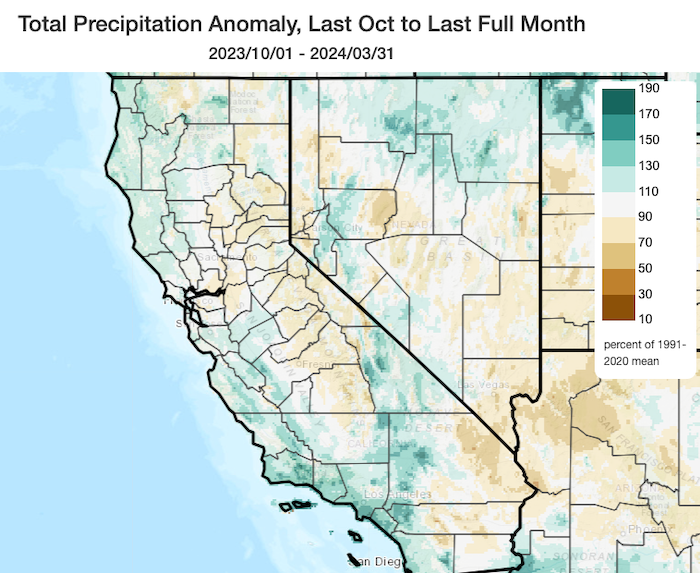
Figure 2. Current Snow Conditions in In the Sierra Nevada Mountains
Key Takeaway: Snowpack throughout much of the Sierra Nevada Mountains is above normal, with about 125% of normal snow water equivalent (SWE) for this time of year. As of April 1, SWE is well above normal in much of northern Nevada.
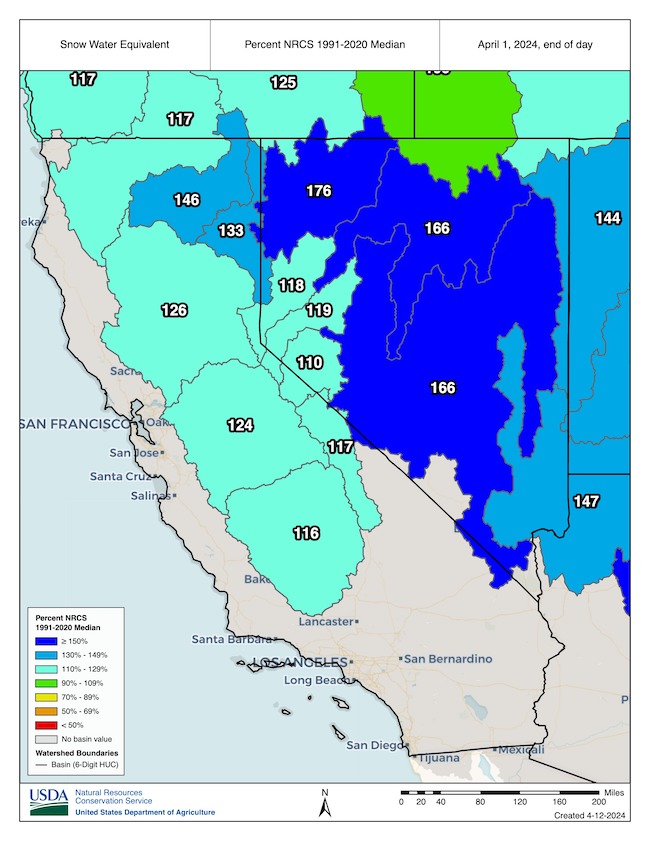
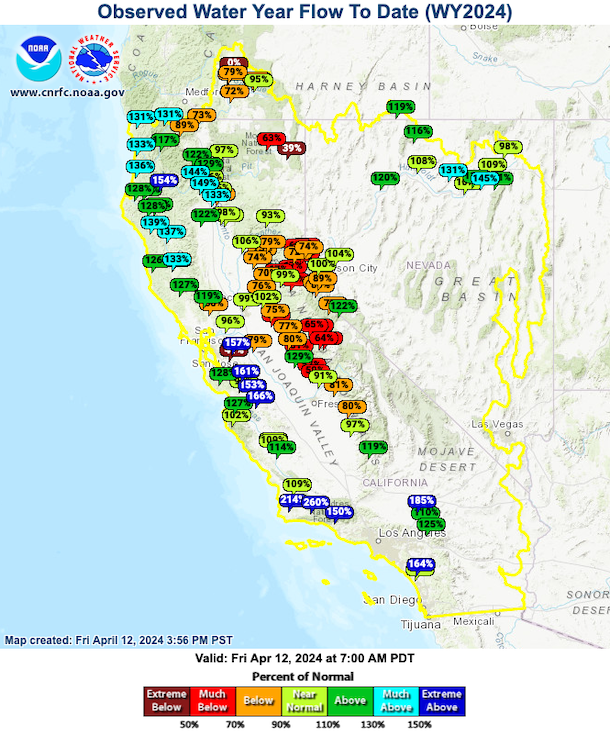
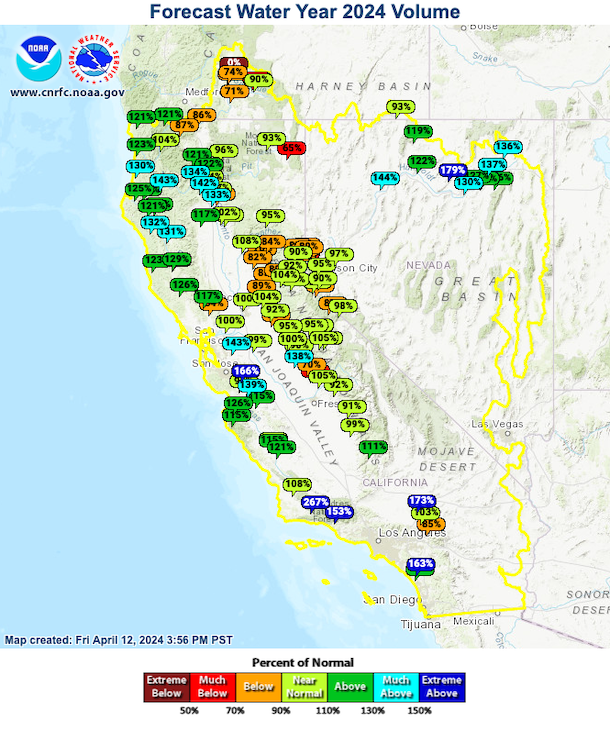
Figure 3. Observed and Forecasted Water Year 2024 Streamflow Volumes
Key Takeaway: Observed streamflow volumes throughout the region are currently above normal in the coastal region and in northern Nevada. The Sierra Nevada water year streamflow is forecasted to be above normal with the snow melt.
California-Nevada Drought Impacts
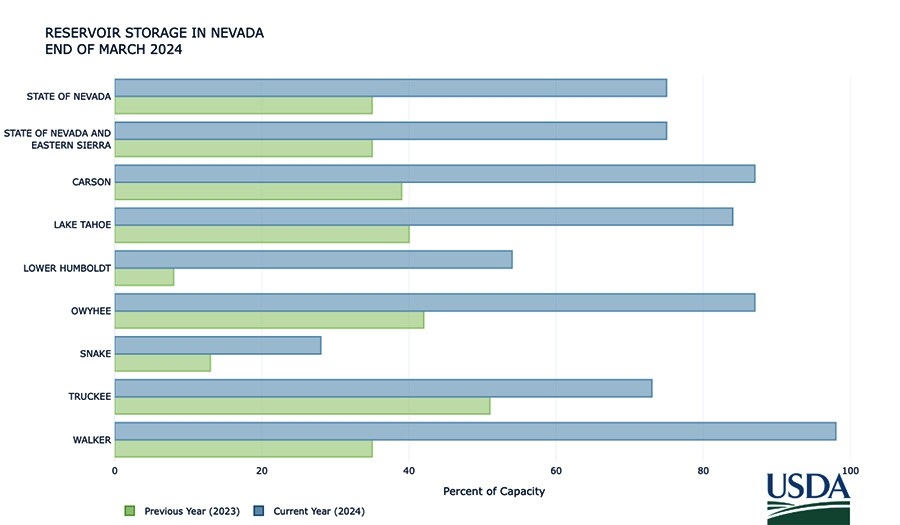
- The state of Nevada total reservoir storage is 75% of capacity and well above the median (Figure 4). This is much higher than last year.
- Reservoir storage plus snowpack in the western Sierras is above normal. The northern Sierra reservoir plus snowpack is the most above normal, with the central and southern Sierra being closer to normal (Figure 5). California reservoir levels are primarily above historical averages.
- Upper Colorado River Basin precipitation and snowpack conditions are near normal. Lake Powell and Lake Mead levels are above what they were at this time last year, with Powell 33% full and Mead 36% full.
Report your local drought impacts through a Condition Monitoring Observer Report:
Figure 4. Reservoir Storage in Nevada
Key Takeaway: Nevada’s end of March total reservoir storage capacity is 75%—more than double what it was at this time last year.
Outlooks and Forecasts for California-Nevada
- Relatively cool temperatures are forecast for the next week, delaying melting of the snowpack. However, above-normal temperatures are forecast for the 8–14 day and seasonal (3-month) time periods (Figure 5).
- Forecast days of peak flow are between late April and mid-May in the Sierras and late May to early June in Northern Nevada (Figure 6).
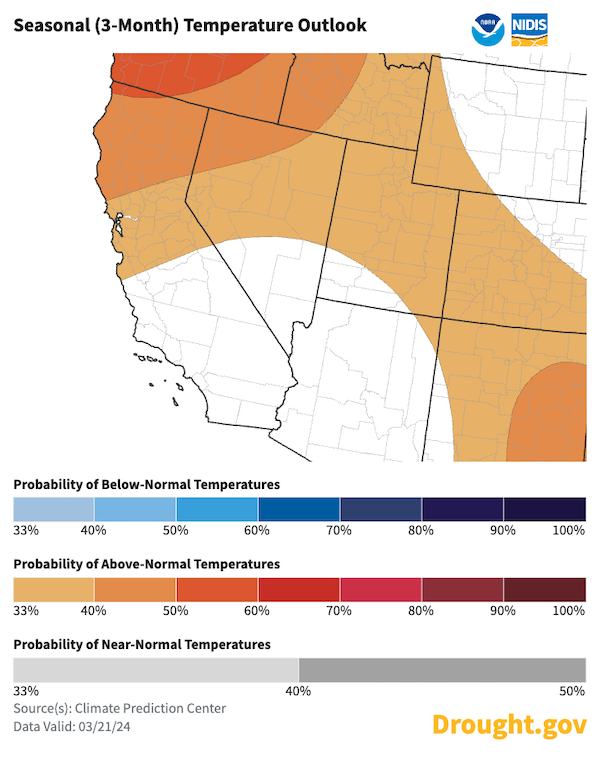
- The Climate Prediction Center’s seasonal outlooks (April through June) favor above-normal temperatures in northern California-Nevada and equal chances of above-, below-, and near-normal precipitation across the region (Figures 7, 8).
- NOAA’s El Niño–Southern Oscillation (ENSO) alert system status is currently an El Niño Advisory/La Niña Watch. A transition from El Niño to ENSO-neutral is likely by April–June 2024 (85% chance), with increasing odds of La Niña developing in June–August 2024 (60% chance). For more information, check out the NOAA ENSO blog.
- Fire risk is normal to below normal for April, May, and June in the region. Read more from NIFC Predictive Services.
- Drought conditions are not expected to develop in the next three months.
Figure 5. 8–14 Day Temperature Outlook (April 22–28)
Key Takeaway: The Climate Prediction Center’s 8–14 day outlook (valid April 22–28) favors near- to above-normal temperatures across much of the region. Increased temperatures could lead to snow loss.
Figure 6. Forecast Date of Peak Streamflow
Key Takeaway: Prediction of the date of peak streamflow related to snow melt is in late April and May for the Sierra Nevadas and in late May/early June for northern Nevada.
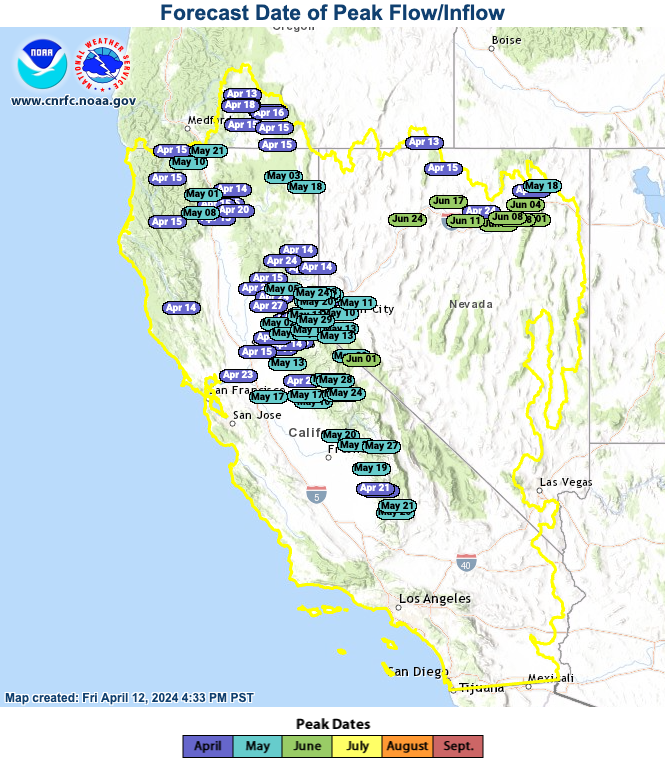
Figure 7. Seasonal (3-Month) Precipitation Outlook
Key Takeaway: NOAA Climate Prediction Center’s seasonal outlooks favor equal chances of above-, below-, and near-normal precipitation in California-Nevada through spring.
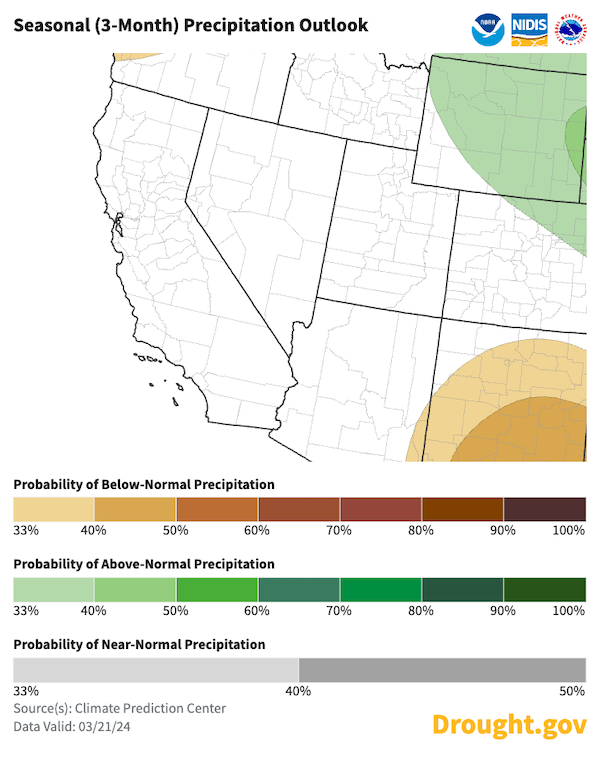
Figure 8. Seasonal (3-Month) Temperature Outlook
Key Takeaway: Seasonal forecasts favor above-normal temperatures in Northern California-Nevada through spring.
Drought Early Warning Resources
Explore regional and state drought information:
Register for the May 28 California-Nevada Drought and Climate Outlook Webinar, which will provide an overview of climate and drought conditions, impacts, and outlooks.
Read the latest Western regional Snow Drought Status Update.
Prepared By
Amanda Sheffield
California-Nevada DEWS Regional Drought Information Coordinator
Cooperative Institute for Research in Environmental Sciences (CIRES)/CU Boulder
NOAA's National Integrated Drought Information System
Julie Kalansky
Principal Investigator
California-Nevada Adaptation Program (A NOAA CAP/RISA team)
This drought status update is issued in partnership between the National Oceanic and Atmospheric Administration (NOAA), the California-Nevada Adaptation Program (a NOAA CAP/RISA team), and the Western Regional Climate Center at the Desert Research Institute to communicate the current state of drought conditions in California-Nevada based on recent conditions and the upcoming forecast. NIDIS and its partners will issue future drought status updates as conditions evolve.
