Wet Start to Water Year Improves Drought, But Snowpack Lags
Key Points
- Water Year 2026 (October 1, 2025–September 20, 2026) began very differently than Water Year 2025. Drought developed in the first few months of the last water year and expanded over the region. This water year, over the course of 2 months, drought across California-Nevada has improved by 1-3 categories, according to the U.S. Drought Monitor.
- Since the start of the 2026 Water Year on October 1, several areas of California-Nevada have received more than 300% of normal water year to date precipitation, improving soil moisture conditions. Snowpack is starting to build, albeit slowly due to much-above-normal temperatures.
- Long-term drought (according to the U.S. Drought Monitor) lingers from central-southern Nevada to the California border, an extension of drought conditions from the Southwestern U.S.
- Extended range outlooks remain uncertain for December. NOAA’s National Weather Service forecasts a break in precipitation over the next two weeks, with slight indications for Southern California to be drier than normal through February.
- NOAA’s National Integrated Drought Information System (NIDIS) and partners will continue to provide the latest information on conditions, outlooks, and impacts through the water year.
This update is based on data available as of Thursday, December 4, 2025 at 7:00 a.m. PT. We acknowledge that conditions are evolving.
The U.S. Drought Monitor depicts the location and intensity of drought across the country. The map uses 5 classifications: Abnormally Dry (D0), showing areas that may be going into or are coming out of drought, and four levels of drought (D1–D4).
The U.S. Drought Monitor is a joint effort of the National Oceanic and Atmospheric Administration, U.S. Department of Agriculture, and National Drought Mitigation Center.
This water year to date U.S. Drought Monitor change map shows where drought has improved, degraded, or remained the same from September 30–December 2, 2025. Yellow shades indicate drought degradation, while green shades indicate drought improvement, according to the U.S. Drought Monitor.
A time series of the U.S. Drought Monitor showing 2024-2025 drought conditions over California-Nevada. The vertical axis shows the total percent land area in drought, while the horizontal axis shows the date.
A drought index combines multiple drought indicators (e.g., precipitation, temperature, soil moisture) to depict drought conditions. For some products, like the U.S. Drought Monitor, authors combine their analysis of drought indicators with input from local observers. Other drought indices, like the Standardized Precipitation Index (SPI), use an objective calculation to describe the severity, location, timing, and/or duration of drought.
Learn MorePeriods of drought can lead to inadequate water supply, threatening the health, safety, and welfare of communities. Streamflow, groundwater, reservoir, and snowpack data are key to monitoring and forecasting water supply.
Learn MoreDrought can reduce the water availability and water quality necessary for productive farms, ranches, and grazing lands, resulting in significant negative direct and indirect economic impacts to the agricultural sector. Monitoring agricultural drought typically focuses on examining levels of precipitation, evaporative demand, soil moisture, and surface/groundwater quantity and quality.
Learn MoreA drought index combines multiple drought indicators (e.g., precipitation, temperature, soil moisture) to depict drought conditions. For some products, like the U.S. Drought Monitor, authors combine their analysis of drought indicators with input from local observers. Other drought indices, like the Standardized Precipitation Index (SPI), use an objective calculation to describe the severity, location, timing, and/or duration of drought.
Learn MorePeriods of drought can lead to inadequate water supply, threatening the health, safety, and welfare of communities. Streamflow, groundwater, reservoir, and snowpack data are key to monitoring and forecasting water supply.
Learn MoreDrought can reduce the water availability and water quality necessary for productive farms, ranches, and grazing lands, resulting in significant negative direct and indirect economic impacts to the agricultural sector. Monitoring agricultural drought typically focuses on examining levels of precipitation, evaporative demand, soil moisture, and surface/groundwater quantity and quality.
Learn MoreDrought & Dryness Categories
% AreaD0 – Abnormally Dry
Abnormally Dry (D0) indicates a region that is going into or coming out of drought.
D1 – Moderate Drought
Moderate Drought (D1) is the first of four drought categories (D1–D4), according to the U.S. Drought Monitor.
D2 – Severe Drought
Severe Drought (D2) is the second of four drought categories (D1–D4), according to the U.S. Drought Monitor.
D3 – Extreme Drought
Extreme Drought (D3) is the third of four drought categories (D1–D4), according to the U.S. Drought Monitor.
D4 – Exceptional Drought
Exceptional Drought (D4) is the most intense drought category, according to the U.S. Drought Monitor.
Total Area in Drought (D1–D4)
Percent area of the California–Nevada region that is currently in drought (D1–D4), according to the U.S. Drought Monitor.
Drought Degradation
5-Category Degradation
Drought/dryness has worsened by 5 categories, according to the U.S. Drought Monitor.
4-Category Degradation
Drought/dryness has worsened by 4 categories, according to the U.S. Drought Monitor.
3-Category Degradation
Drought/dryness has worsened by 3 categories, according to the U.S. Drought Monitor.
2-Category Degradation
Drought/dryness has worsened by 2 categories, according to the U.S. Drought Monitor.
1-Category Degradation
Drought/dryness has worsened by 1 category, according to the U.S. Drought Monitor.
Drought Improvement
1-Category Improvement
Drought/dryness has improved by 1 category, according to the U.S. Drought Monitor.
2-Category Improvement
Drought/dryness has improved by 2 categories, according to the U.S. Drought Monitor.
3-Category Improvement
Drought/dryness has improved by 3 categories, according to the U.S. Drought Monitor.
4-Category Improvement
Drought/dryness has improved by 4 categories, according to the U.S. Drought Monitor.
5-Category Improvement
Drought/dryness has improved by 5 categories, according to the U.S. Drought Monitor.
The U.S. Drought Monitor depicts the location and intensity of drought across the country. The map uses 5 classifications: Abnormally Dry (D0), showing areas that may be going into or are coming out of drought, and four levels of drought (D1–D4).
The U.S. Drought Monitor is a joint effort of the National Oceanic and Atmospheric Administration, U.S. Department of Agriculture, and National Drought Mitigation Center.
This water year to date U.S. Drought Monitor change map shows where drought has improved, degraded, or remained the same from September 30–December 2, 2025. Yellow shades indicate drought degradation, while green shades indicate drought improvement, according to the U.S. Drought Monitor.
A time series of the U.S. Drought Monitor showing 2024-2025 drought conditions over California-Nevada. The vertical axis shows the total percent land area in drought, while the horizontal axis shows the date.
This U.S. Drought Monitor is released every Thursday morning, with data valid through Tuesday at 7 a.m. ET.
This U.S. Drought Monitor (USDM) and USDM change maps are released every Thursday morning, with data valid through Tuesday at 7 a.m. ET.
This U.S. Drought Monitor (USDM) is released every Thursday morning, with data valid through Tuesday at 7 a.m. ET.
A drought index combines multiple drought indicators (e.g., precipitation, temperature, soil moisture) to depict drought conditions. For some products, like the U.S. Drought Monitor, authors combine their analysis of drought indicators with input from local observers. Other drought indices, like the Standardized Precipitation Index (SPI), use an objective calculation to describe the severity, location, timing, and/or duration of drought.
Learn MorePeriods of drought can lead to inadequate water supply, threatening the health, safety, and welfare of communities. Streamflow, groundwater, reservoir, and snowpack data are key to monitoring and forecasting water supply.
Learn MoreDrought can reduce the water availability and water quality necessary for productive farms, ranches, and grazing lands, resulting in significant negative direct and indirect economic impacts to the agricultural sector. Monitoring agricultural drought typically focuses on examining levels of precipitation, evaporative demand, soil moisture, and surface/groundwater quantity and quality.
Learn MoreA drought index combines multiple drought indicators (e.g., precipitation, temperature, soil moisture) to depict drought conditions. For some products, like the U.S. Drought Monitor, authors combine their analysis of drought indicators with input from local observers. Other drought indices, like the Standardized Precipitation Index (SPI), use an objective calculation to describe the severity, location, timing, and/or duration of drought.
Learn MorePeriods of drought can lead to inadequate water supply, threatening the health, safety, and welfare of communities. Streamflow, groundwater, reservoir, and snowpack data are key to monitoring and forecasting water supply.
Learn MoreDrought can reduce the water availability and water quality necessary for productive farms, ranches, and grazing lands, resulting in significant negative direct and indirect economic impacts to the agricultural sector. Monitoring agricultural drought typically focuses on examining levels of precipitation, evaporative demand, soil moisture, and surface/groundwater quantity and quality.
Learn MoreA drought index combines multiple drought indicators (e.g., precipitation, temperature, soil moisture) to depict drought conditions. For some products, like the U.S. Drought Monitor, authors combine their analysis of drought indicators with input from local observers. Other drought indices, like the Standardized Precipitation Index (SPI), use an objective calculation to describe the severity, location, timing, and/or duration of drought.
Learn MorePeriods of drought can lead to inadequate water supply, threatening the health, safety, and welfare of communities. Streamflow, groundwater, reservoir, and snowpack data are key to monitoring and forecasting water supply.
Learn MoreDrought can reduce the water availability and water quality necessary for productive farms, ranches, and grazing lands, resulting in significant negative direct and indirect economic impacts to the agricultural sector. Monitoring agricultural drought typically focuses on examining levels of precipitation, evaporative demand, soil moisture, and surface/groundwater quantity and quality.
Learn MoreCalifornia-Nevada Current Drought Conditions and Impacts
- The prior water year (October 1, 2024–September 30, 2025) ended with precipitation divided between the north and south. Southern California-Nevada did not receive as much atmospheric river activity as the northern part of the region. Water Year 2025 started dry in the southern region due to a weak summer 2024 monsoon, and drought conditions continued to degrade. Southern California did not receive any precipitation until the end of January after the devastating Los Angeles fires.
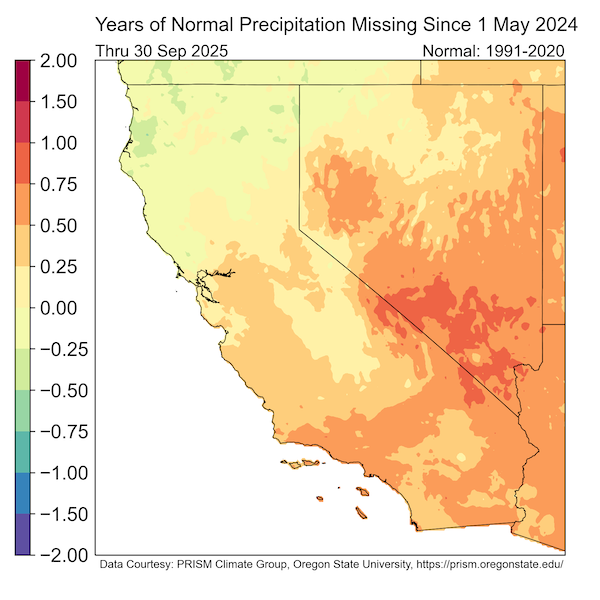
- This contributed to a significant portion of the region missing one-half to almost a full year of precipitation between May 1, 2024 (before the start of monsoon season) and the start of this water year (October 1, 2025).
- Unlike last water year, California-Nevada has had a wet start to Water Year 2026, helping to mitigate this deficit. Since October 1, 2025, some areas of California-Nevada have received more than 300% of normal water year to date precipitation and more than 40% of normal total water year precipitation. This has improved soil moisture conditions and started to build the Sierra Nevada snowpack. Downtown Los Angeles had its wettest November in nearly 60 years.
- However, the snowpack remains low, except in the southern Sierra Nevada and Spring Mountains, due to much-above-normal temperatures. Tracking the potential of snow drought development over the next month will be important for assessing water supply. On December 1, the California Department of Water Resources announced an initial State Water Project allocation of 10% of requested supplies.
- Recent storms on November 16-23 have continued to improve drought conditions. By November 25, no Extreme Drought (D3) remained in the region. The most intense drought conditions (Moderate to Severe Drought [D1-D2]) linger in central/eastern Nevada.
- Major California water supply reservoirs remain near or above their historical averages. Reservoirs in almost all regions of Nevada are generally below this time last year, with the biggest difference in Lake Tahoe. However, they are still near or above median for this date. Both Lake Powell and Lake Mead are at 27% and 32% of storage capacity, respectively.
Much of California-Nevada began Water Year 2026 with Large Precipitation Deficits
Water Year 2026 Is Off to a Wet Start in California and Western and Southern Nevada

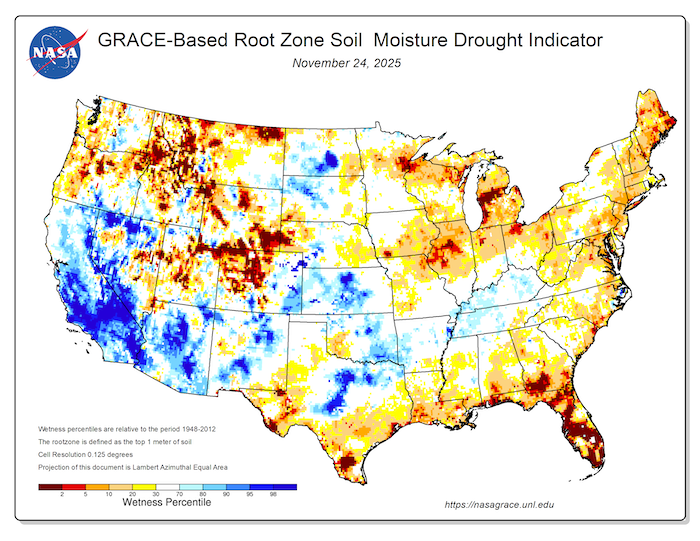
Root Zone Soil Moisture (Top 1 Meter of Soil) Shows Significant Improvements over California-Nevada

Outlooks and Potential Impacts for California-Nevada
- La Niña continued over the last month and is favored to continue into the Northern Hemisphere winter, with a transition to El Niño–Southern Oscillation (ENSO) neutral conditions most likely in January-March (61% probability). La Niña conditions have historically increased the chances of normal to dry winters in southern California and southern Nevada.
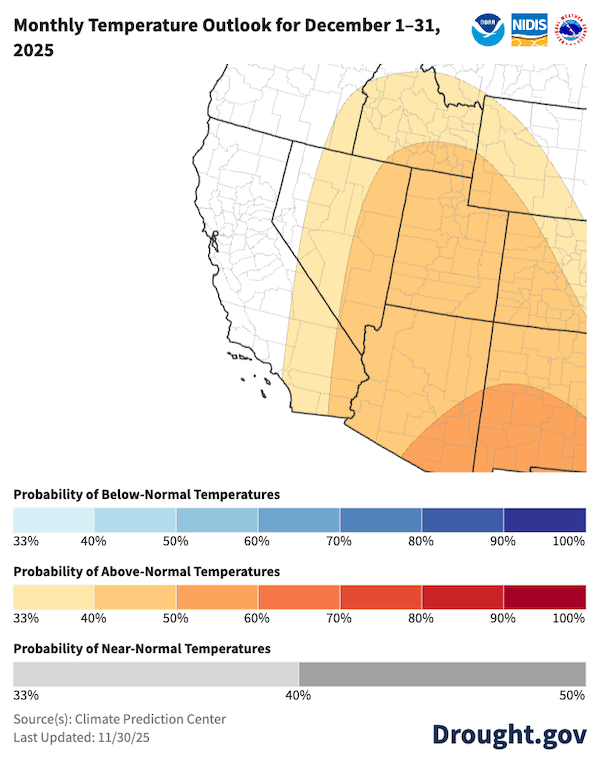
- National Weather Service extended range forecasts over the next two weeks indicate there may be a break in the precipitation for the region, along with warmer-than-normal temperatures. Over the next month, the National Weather Service Climate Prediction Center’s (CPC’s) outlooks show equal chances of above-, near-, or below-normal precipitation in December, with slightly increased odds of warmer-than-normal temperatures in Southern California and Nevada.
- As we head into the new year, CPC’s seasonal outlooks for December–February suggest a more typical La Niña pattern—with slight chances of below-normal precipitation in the Southwestern U.S.
- Existing drought conditions are forecast to persist over the next one to three months.
December Temperature Outlooks Lean Towards Above-Normal Temperatures in Nevada and Southern California
December Precipitation Outlooks Show Equal Chances of Above-, Below-, or Near-Normal Conditions

Resources
- Explore regional and state drought information:
- NIDIS and partners are piloting a series of Southern California Sector-Specific Drought Early Warning Outlooks in Water Year 2025–2026. Learn more and get involved by contacting Amanda Sheffield (amanda.sheffield@noaa.gov).
Save the date for the January 26 California-Nevada Drought and Climate Outlook Webinar, which will provide an overview of climate and drought conditions, impacts, and outlooks.
Prepared By
Amanda Sheffield
California-Nevada DEWS Regional Drought Information Coordinator
Cooperative Institute for Research in Environmental Sciences (CIRES), University of Colorado Boulder
NOAA’s National Integrated Drought Information System
Julie Kalansky
Principal Investigator
California-Nevada Adaptation Program (a NOAA CAP/RISA team)
This Drought Status Update is issued in partnership between the National Oceanic and Atmospheric Administration (NOAA), the California-Nevada Adaptation Program (a NOAA CAP team), and the Western Regional Climate Center at the Desert Research Institute to communicate a potential area of concern for drought expansion and/or development within the California-Nevada DEWS region based on recent conditions and the upcoming forecast. NIDIS and its partners will issue future Drought Status Updates as conditions evolve. NIDIS is an interagency program within the Climate Program Office, which is part of NOAA's Office of Oceanic and Atmospheric Research.


