Heat Compounds Drought Impacts as Wildfire Season Starts.
Register here for the Western Drought Webinar, July 20 at 10 a.m. PDT. This webinar is in lieu of the July CA-NV Drought and Climate Outlook Webinar, which will return in September.
Key Points
- After 2 water years of dry conditions, both California and Nevada are 100% in moderate-to-exceptional drought.
- Reservoirs throughout California and Nevada are low, though the total reservoir storage is not as low as during the 2012–2016 drought.
- Continued drying increases wildfire risk throughout the region, reflected in several recent large wildfire incidents in northern California.
- Nevada and California had record warm temperatures in June, escalating drought-related impacts, including fire potential, water temperature impacts on fish, and increased evaporative demand.
- Drought impacts (e.g., pasture conditions, ecosystem health, water supply, recreation, fire potential) have intensified and expanded given back-to-back dry years. Drought preparedness is key.
The U.S. Drought Monitor (USDM) is updated each Thursday to show the location and intensity of drought across the country. Drought categories show experts’ assessments of conditions related to dryness and drought including observations of how much water is available in streams, lakes, and soils compared to usual for the same time of year.
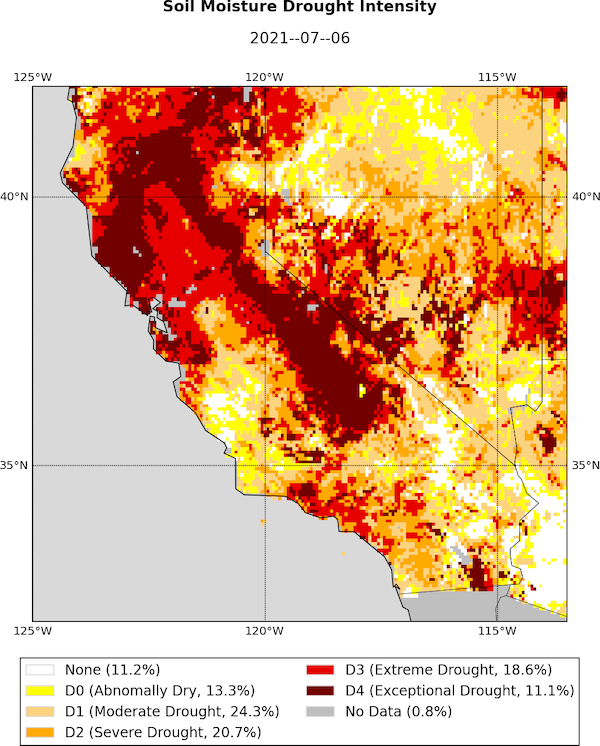
California/Nevada conditions as of July 6, 2021:
- 100% of California is experiencing Moderate (D1) to Exceptional (D4) Drought (52% in D3, 33% in D4)
- California population in drought: 37,250,607
- 100% of Nevada is experiencing Moderate (D1) to Exceptional (D4) Drought (36% in D3, 41% in D4)
- Nevada population in drought: 2,700,554
U.S. Drought Monitor Categories
The U.S. Drought Monitor (USDM) is updated each Thursday to show the location and intensity of drought across the country. Drought categories show experts’ assessments of conditions related to dryness and drought including observations of how much water is available in streams, lakes, and soils compared to usual for the same time of year.
California/Nevada conditions as of July 6, 2021:
- 100% of California is experiencing Moderate (D1) to Exceptional (D4) Drought (52% in D3, 33% in D4)
- California population in drought: 37,250,607
- 100% of Nevada is experiencing Moderate (D1) to Exceptional (D4) Drought (36% in D3, 41% in D4)
- Nevada population in drought: 2,700,554
Current Conditions
- According to the U.S. Drought Monitor, over the last 4–8 weeks, drought conditions continued to worsen across all of California, including (most recently) the central coast. Both California and Nevada continue to be 100% in drought, with D4 (D3) present in California for 29 (63) weeks and Nevada for 42 (49) weeks.
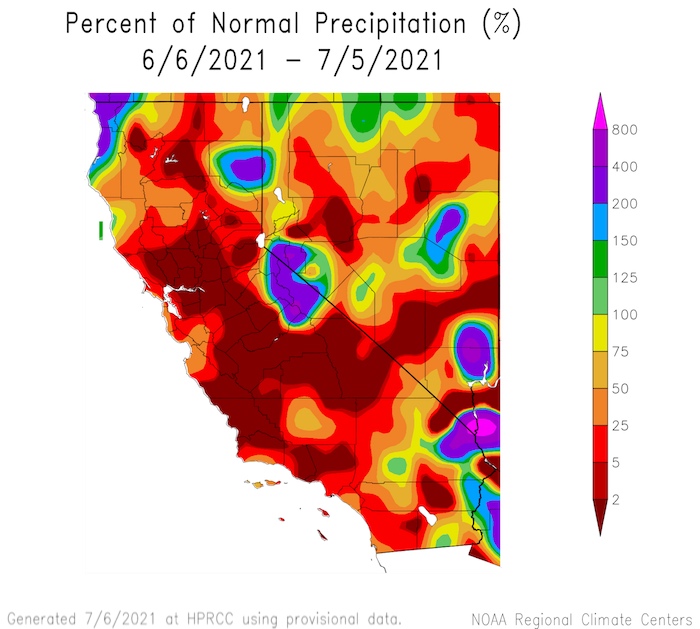
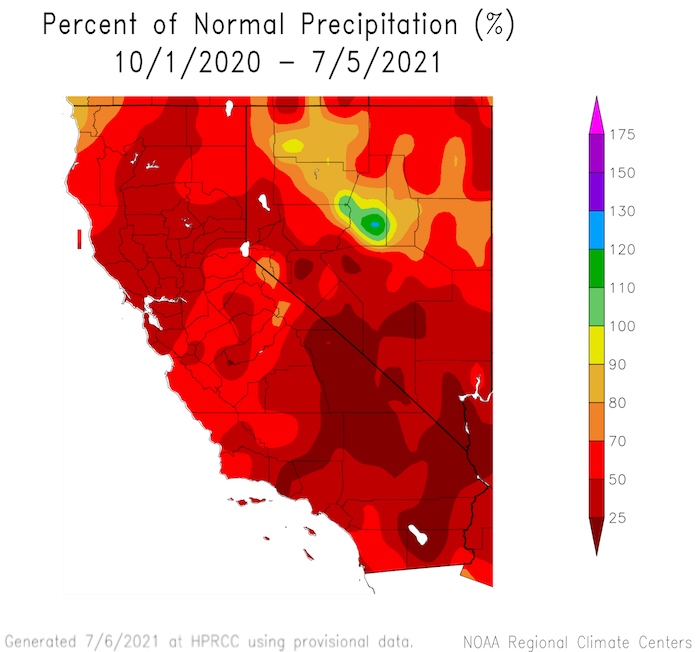
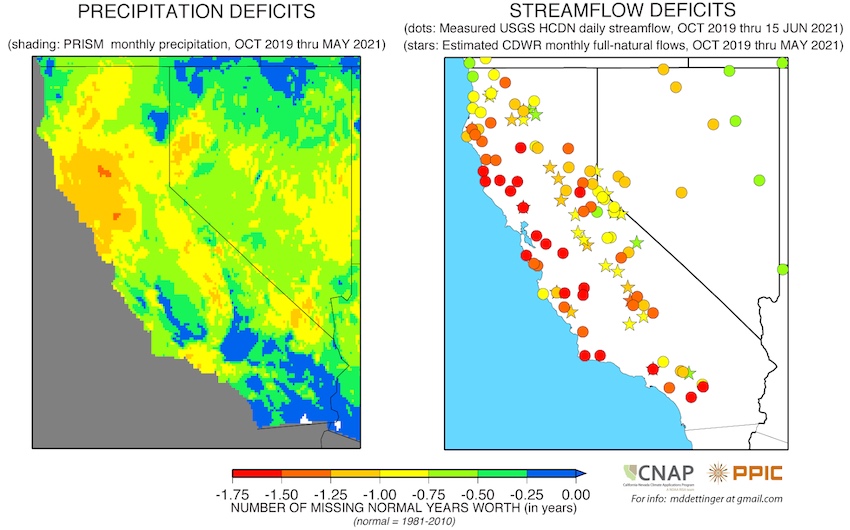
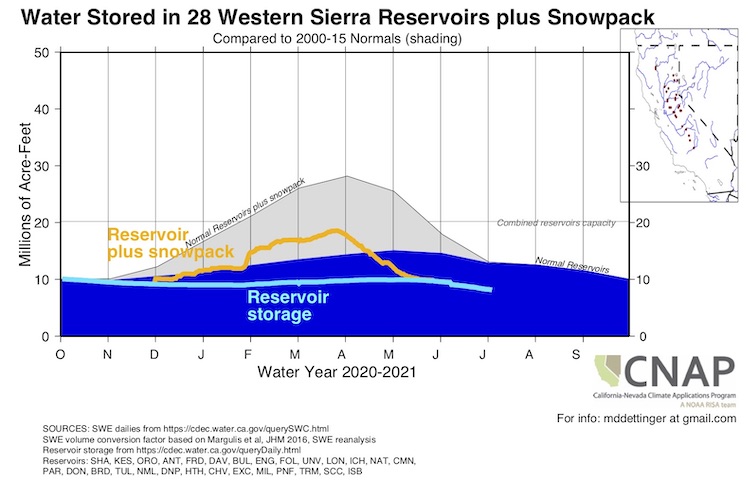
- Since October 2019, much of California and Nevada are missing 0.5 to 1+ years' worth of precipitation, and California 1.5+ years of missing streamflow. Streamflow is "missing" more than precipitation, illustrating the non-linearities between precipitation and streamflow.
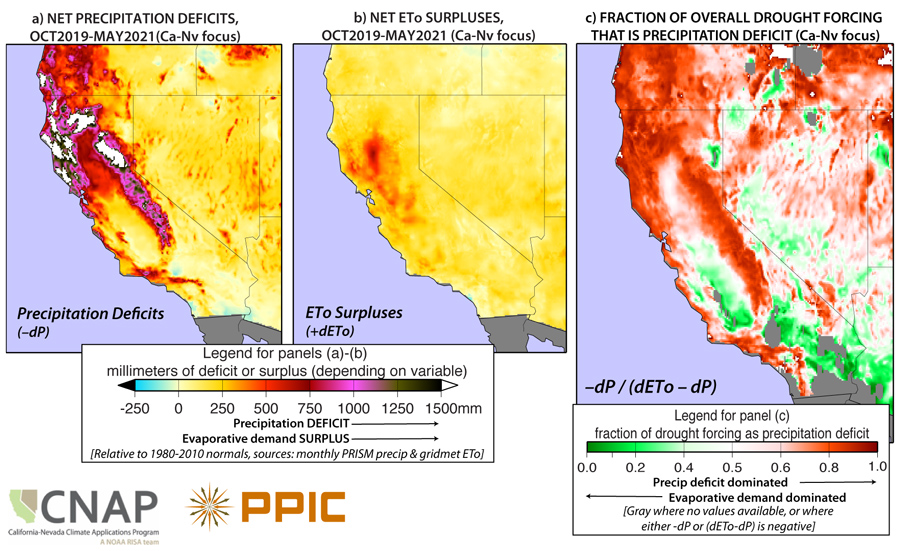
- The current drought is a combination of a precipitation deficit and a surplus of evaporative demand (the atmospheric conditions that drive evapotranspiration, leading to the drying of the landscape). Throughout southern Nevada and the Central Valley, evaporative demand has been a larger driver of the drought than the precipitation deficit.
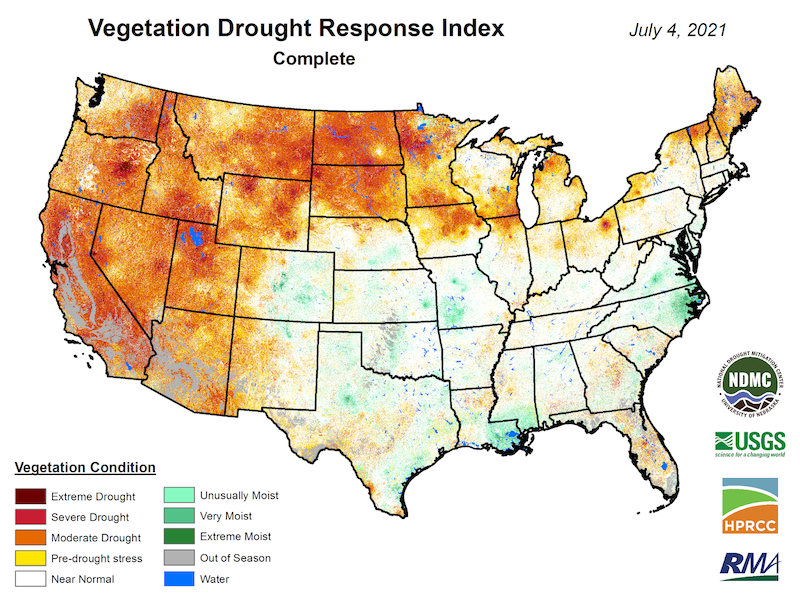
- Evaporative demand remains high as it has been throughout this water year, and vegetation is showing stress.
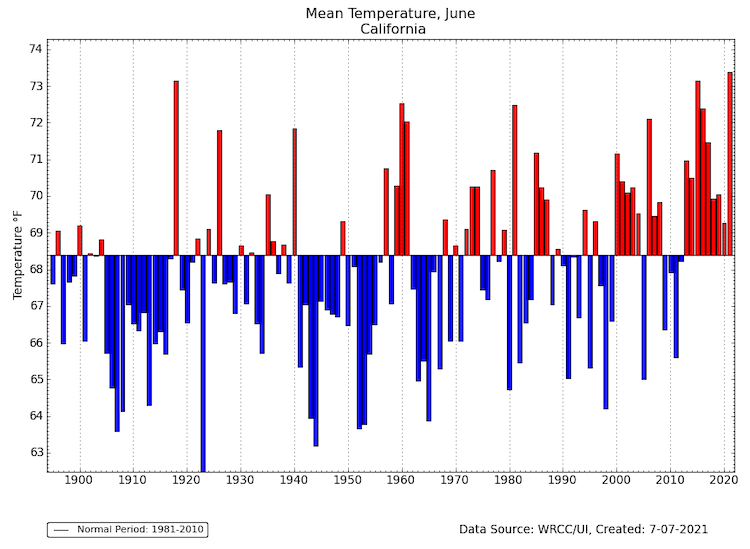
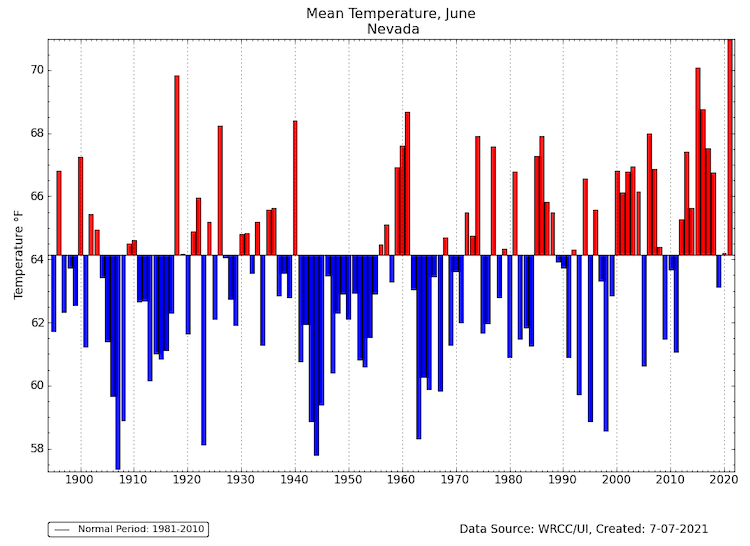
- Record warm statewide temperatures for Nevada and California were set in June, punctuated by numerous daily maximum temperature records set during a series of heat waves.
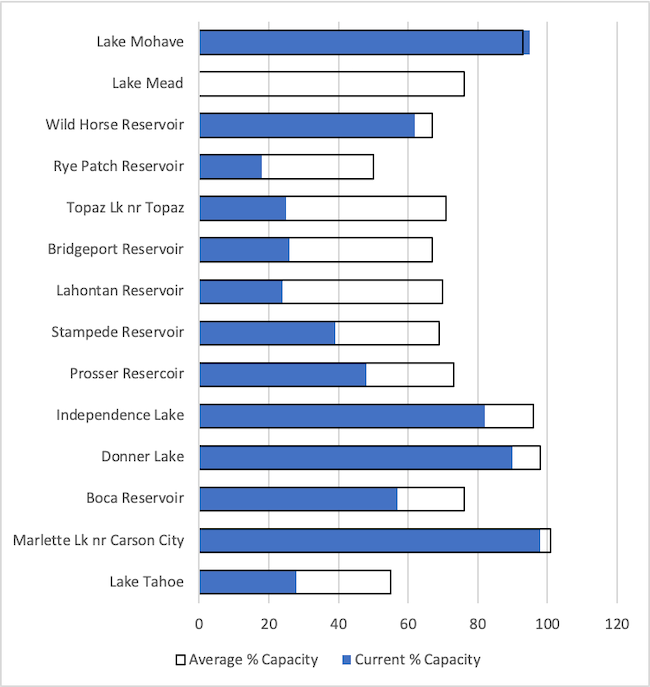
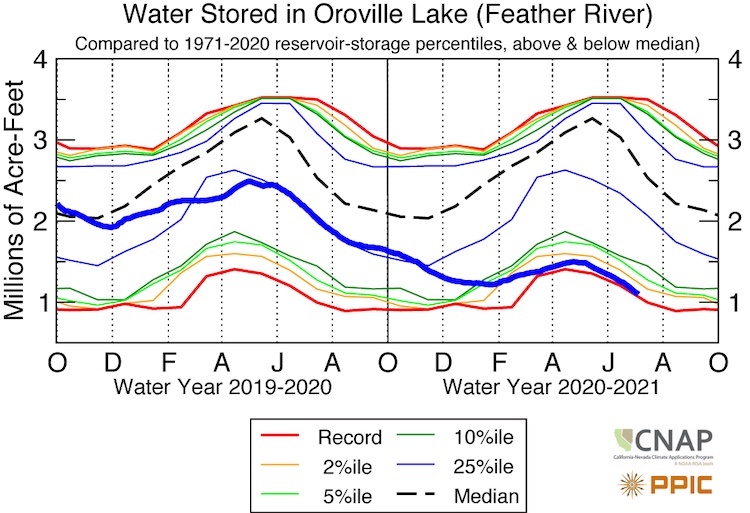
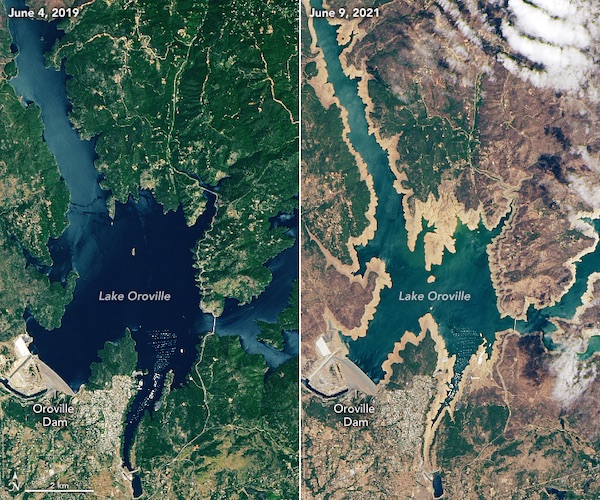
- Most of the 10 largest reservoirs in Northern California are at 5th–25th percentile levels for this time of year, with Lake Oroville near a record low. Almost all of Nevada reservoirs are below average capacity for this time of year.
- Flows remain much below to extremely below normal, and high soil moisture deficits remain. For more detail, visit the California and Nevada Natural Resources Conservation Service Water Supply Outlooks.
- The current drought conditions have led to concern for the wildfire season. As of July 8, six large incidents are occurring in Northern California.
How Is Drought Affecting Your Neighborhood?
Click to see drought indicators, outlooks, and historical conditions by city, county, and state, and to sign up for U.S. Drought Monitor alert emails.
Percent of Normal Precipitation: Last 30 Days and Water Year to Date
Statewide Mean Temperatures for June: 1895–2021
Precipitation and Streamflow Deficits
Contribution of Precipitation Deficit and Evaporative Demand Surplus
Nevada Reservoir Conditions
Water Storage + Snowpack in Western Sierra Reservoirs
Oroville Reservoir Water Storage
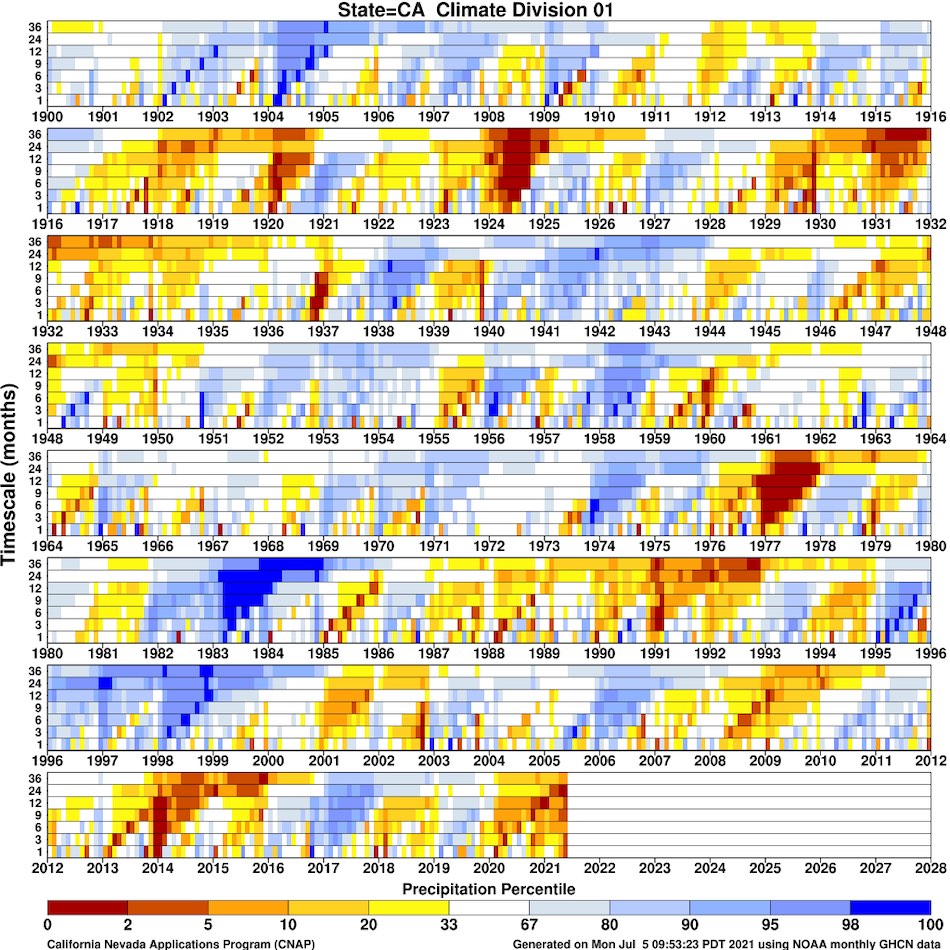
Precipitation Percentiles for Northern Coastal California: 1900–Present
Soil Moisture Conditions
Vegetation Drought Response Index (VegDRI)
Recent Drought Impacts
- Find additional impacts through the National Drought Mitigation Center's Drought Impact Reporter.
- Condition Monitoring Observer Reports (CMOR) over the past month highlight impacts in crop production, livestock production, municipal water supplies, to households, recreation and tourism, wildlife habitat, and regarding fire.
- In early June, Nevada Governor Sisolak signed legislation to enact permanent bans on certain categories of grass.
- California has finished construction of a $10 million emergency rock barrier to block salt water from contaminating state and federal pumps.
- On June 15, the California State Water Resources Control Board issued new regulations to stop diversions in the Russian River watershed and sent notices of water unavailability to ~4,300 rights holders in the Sacramento–San Joaquin Delta watershed.
Wildlife:
- Severe drought has forced 500,000 juvenile steelhead to be moved from Nimbus hatchery to Mokelumne River hatchery due to forecasted warm water temperatures.
- The Nevada Department of Wildlife is hauling ~55,000 fallows of water to "guzzlers" in S. Nevada mountain ranges to help the bighorn sheep population and other species.
- Joshua Tree National Park closed the 49 Palms trail to give bighorn sheep full access to nearby water.
- Point Reyes National Seashore provided supplemental water for Tule Elk.
- Widespread drought is leading to a surge in wildlife sightings in urban areas, including bears in California and rattlesnakes in Nevada.
Agriculture:
- In Sonoma County, livestock farmers are selling animals and thinning herds to cope with dry pastures and high feed prices. Farmers are struggling as water storage is drying quicker than in 2014–2016.
- Fruit and nut orchards are needing more water than normal due to dry soils, including pumping more and increasing electric bills.
- Marin County ranches are selling cattle, and animals are reportedly lighter in weight.
- Cattle sales are up, such as one-fourth to one-third since March, in markets near Bakersfield.
Water Supply:
- Santa Clara Valley Water District declared a drought emergency. In response, the San Jose Water Company is limiting lawn and landscaping irrigation.
- Sonoma City Council declared a stage 2 water shortage on June 15, mandating water use reductions.
- Marin Municipal Water District is taking steps toward constructing an emergency water pipeline.
- Irrigation deliveries are one of the shortest seasons on record for Fresno Irrigation District.
- Nevada Irrigation District enacted mandatory water use restrictions.
- California hydropower is at its lowest levels in more than 5 years. The Edward Hyatt Power Plant at Lake Oroville could fall too low for further power production within months.
Lake Oroville: June 4, 2019 vs. June 9, 2021
Wildfire:
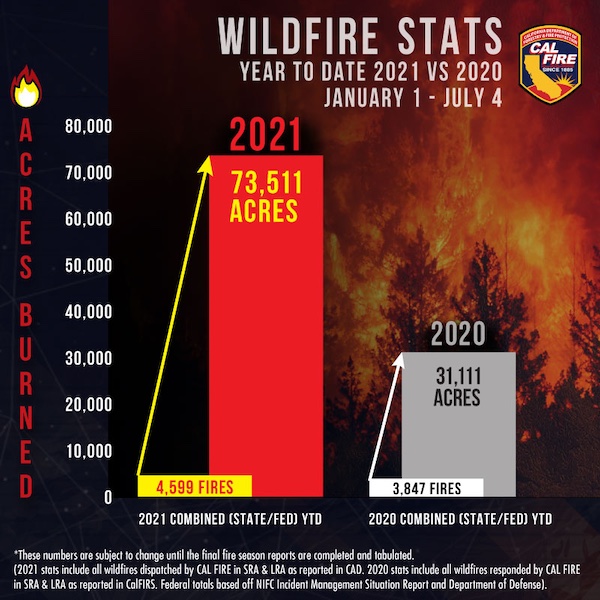
- California has already experienced a significant increase in the number of wildfires and acres burned compared to last year (>4,000 wildfires and >70,000 acres burned). Source: CAL FIRE.
- Nevada has had 40,000 acres burned as of July 7. Source: Great Basin Coordination Center.
- Sierra-Pacific, which owns 1.7 million acres of timber lands in northern California, has closed public access to these lands for fire danger. Source: Mountain Democrat.
- Enhanced fire restrictions are in place on all national forest land in the Lake Tahoe basin.
- The U.S. Bureau of Land Management has issued a fire prevention order on all its lands in Nevada.
California Wildfire Statistics: 2020 vs. 2021 Year-to-Date
Report Your Drought Impacts
Drought and Climate Outlook
El Niño/Southern Oscillation (ENSO)
NOAA’s ENSO alert system status is currently La Niña Watch.
ENSO-neutral is favored through the Northern Hemisphere summer and into the fall (51% chance for the August–October season), with La Niña potentially emerging during the September–November season and lasting through the 2021–22 winter (66% chance during November–January). For more information, please check out the NOAA ENSO blog.
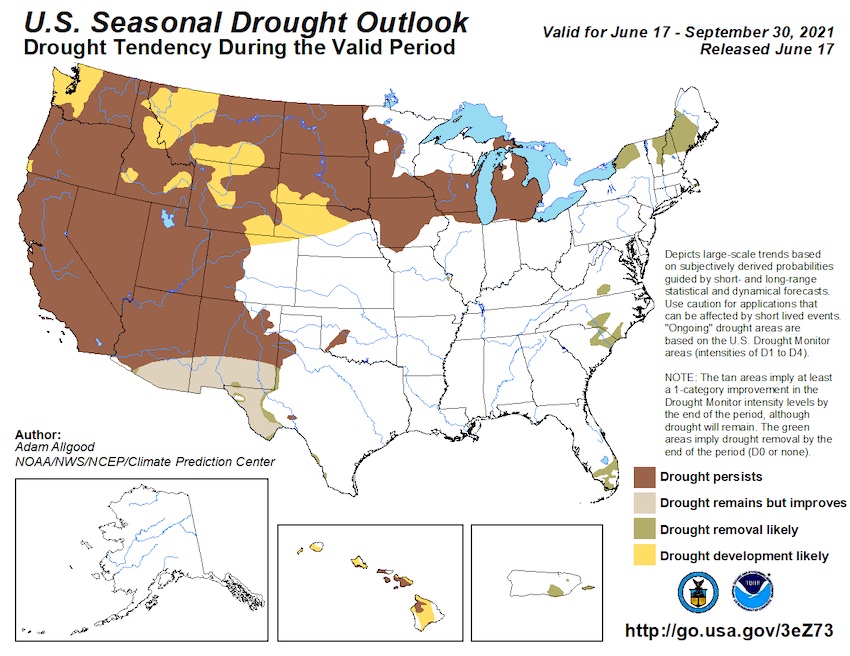
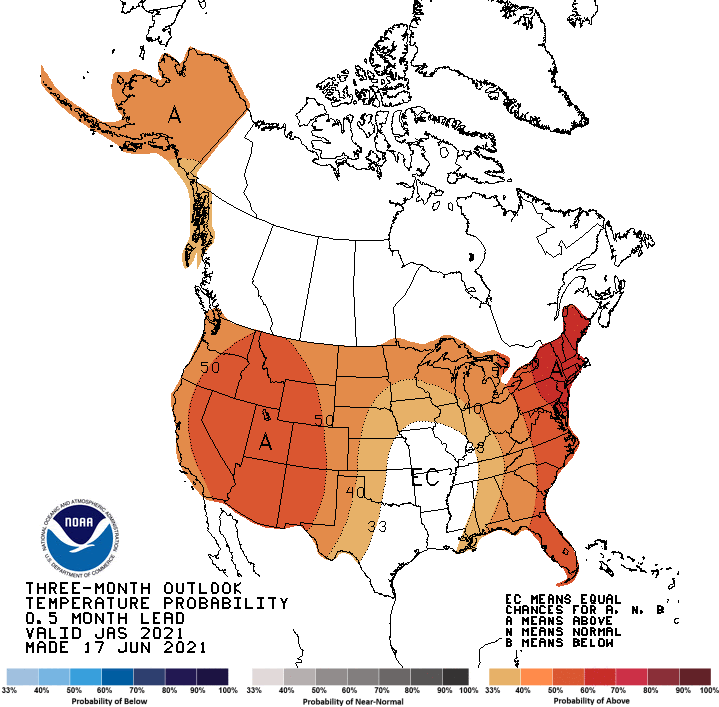
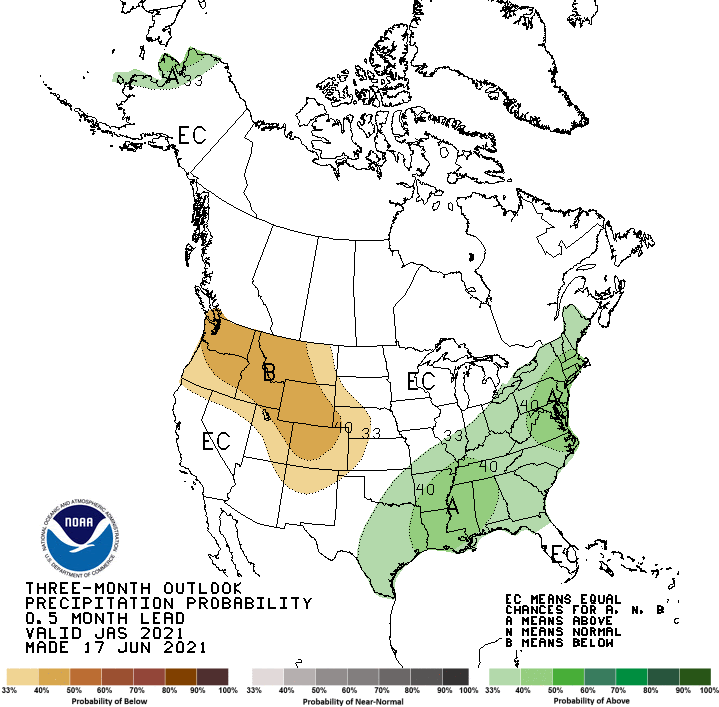
Seasonal Drought, Temperature, and Precipitation Outlooks
During the upcoming three months, little drought relief is anticipated across California and the Great Basin, where much of the region is in its dry season and abnormal warmth is favored to persist. The July-August-September outlook from the National Weather Service's Climate Prediction Center shows increased odds of above-normal temperatures across the West. Most of the region has equal chances of above/normal/below precipitation, including those areas impacted by the summer monsoon.
Seasonal Drought Outlook: June 17–September 30, 2021
Three-Month Temperature and Precipitation Outlooks
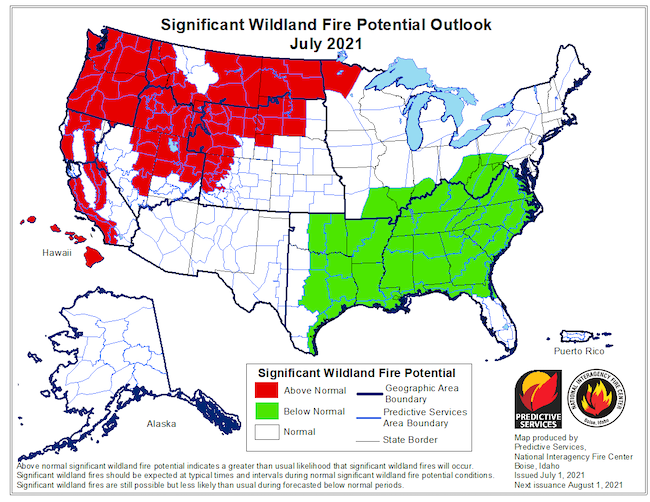
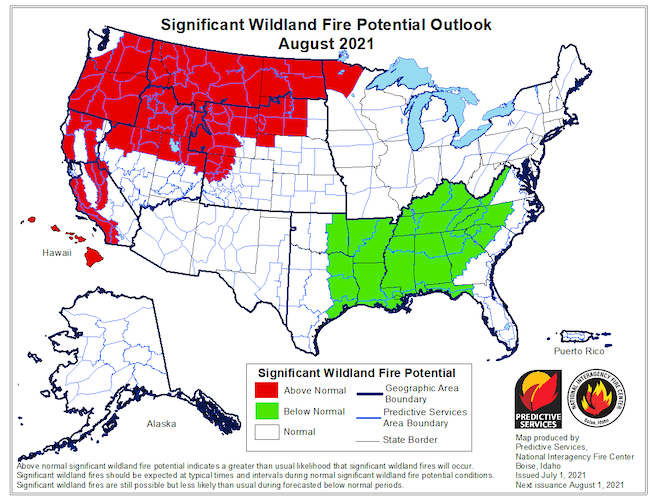
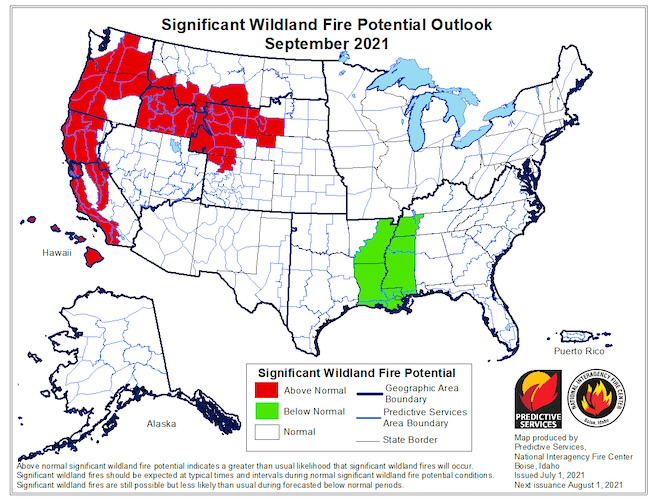
Significant Wildland Fire Potential Outlook
According to the National Interagency Fire Center’s Predictive Services, fire activity increased significantly across the West during June. The national preparedness level increased to four on June 22, the second earliest occurrence since 1990.
The first surge of monsoonal moisture arrived in the Southwest, including the southern Great Basin, during the last few days of June. Near-normal precipitation is likely with the Southwest monsoon in July. Above-normal significant fire potential will expand northward into the Great Basin through August with areas closer to the monsoon likely returning to near normal.
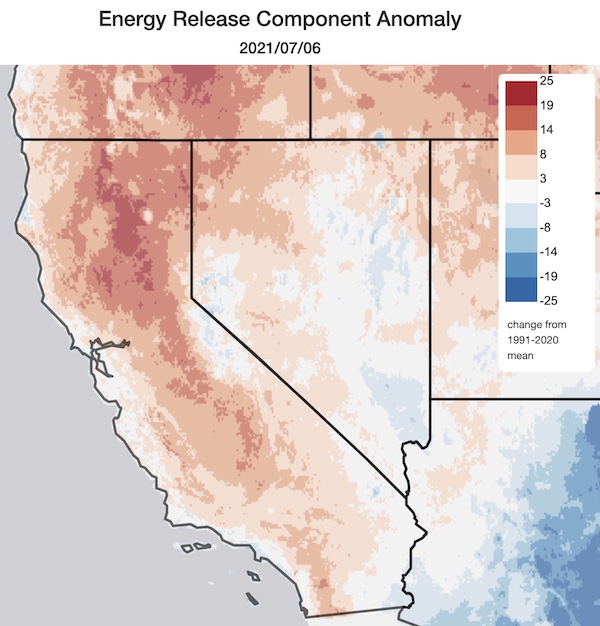
In northern California, the low elevation grass crop is cured below 3,000 feet, and fuel loading among low-elevation brush and grasses is near to below average due to a second year of drought. The high-elevation snowpack has melted off, and although dead fuels are quite dry, live fuels still retain some moisture and greenness as June ends. Similar to May, in southern California both the 1,000-hour and 100-hour dead fuel moistures are below the third percentile and broke many record low values away from the coastal areas in June. The live fuel moisture continues to slowly dry out and is around a month and a half ahead of where it should be for this time of year. Corresponding current fire danger realized through the Energy Release Component is above normal for much of California and Nevada.
Most of the mountains and foothills in California are forecast to have above-normal significant fire potential through September. Much of central and southern California will have above-normal significant fire potential from July to September due to the expected above-normal temperatures and the very dry fuel conditions. Above-normal significant fire potential will continue across southern California from the mountains westward in October as very dry conditions are expected to continue along with the start of the Santa Ana wind season.
Energy Release Component Anomaly
Significant Wildland Fire Potential Outlook: July–September 2021
Drought Early Warning Resources
California Nevada California-Nevada DEWS
Prepared By
Amanda Sheffield
NOAA/NIDIS California-Nevada DEWS Regional Drought Information Coordinator
Email: amanda.sheffield@noaa.gov
Julie Kalansky
Program Manager, California-Nevada Applications Program (NOAA RISA team)
Email: jkalansky@ucsd.edu
This drought status update is issued in partnership between the National Oceanic and Atmospheric Administration (NOAA), the California-Nevada Applications Program, a NOAA RISA team, and the Western Regional Climate Center at the Desert Research Institute to communicate the current state of drought conditions in California-Nevada based on recent conditions and the upcoming forecast. NIDIS and its partners will issue future drought updates as conditions evolve.
