Fall Favors Hot and Dry Conditions as Drought and Wildfire Impacts Intensify
Register here for the September 27 California–Nevada Drought and Climate Outlook Webinar.
Key Points
- After 2 water years of dry conditions, both California and Nevada are 100% in moderate-to-exceptional drought.
- Reservoirs throughout California and Nevada are low, though the total combined reservoir storage is not as low as during the peak of the 2012–2016 California drought.
- Continued drying enhanced wildfire risk throughout the region, reflected in several continuing very large wildfires in northern California.
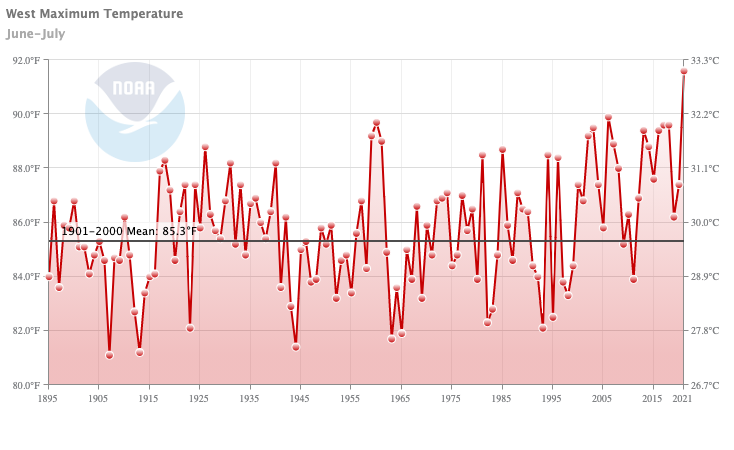
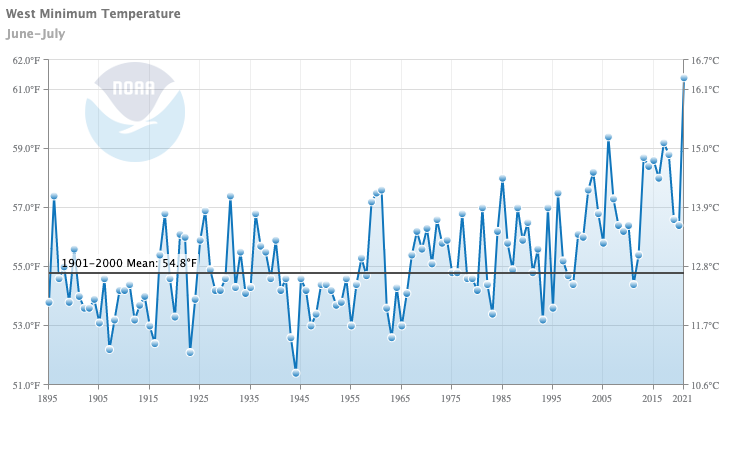
- Nevada and California had record warm temperatures in July, escalating drought-related impacts, including fire potential, water temperature impacts on fish, and increased evaporative demand.
- Forecasts increasingly reflect the potential for La Niña development in the fall and into the winter. Historically, La Niña is associated with dry to normal conditions in the southern part of California and Nevada.
- Drought impacts (e.g., pasture conditions, ecosystem health, water supply, recreation, fire potential) have intensified and expanded given back-to-back dry years. Drought preparedness is key.
The U.S. Drought Monitor (USDM) is updated each Thursday to show the location and intensity of drought across the country. Drought categories show experts’ assessments of conditions related to dryness and drought including observations of how much water is available in streams, lakes, and soils compared to usual for the same time of year.
California/Nevada conditions as of August 24, 2021:
- 100% of California is experiencing Moderate (D1) to Exceptional (D4) Drought (40.98% in D3, 47.4% in D4)
- California population in drought: 37,253,956
- 100% of Nevada is experiencing Moderate (D1) to Exceptional (D4) Drought (40.41% in D3, 26.83% in D4)
- Nevada population in drought: 2,700,551
U.S. Drought Monitor Categories
The U.S. Drought Monitor (USDM) is updated each Thursday to show the location and intensity of drought across the country. Drought categories show experts’ assessments of conditions related to dryness and drought including observations of how much water is available in streams, lakes, and soils compared to usual for the same time of year.
California/Nevada conditions as of August 24, 2021:
- 100% of California is experiencing Moderate (D1) to Exceptional (D4) Drought (40.98% in D3, 47.4% in D4)
- California population in drought: 37,253,956
- 100% of Nevada is experiencing Moderate (D1) to Exceptional (D4) Drought (40.41% in D3, 26.83% in D4)
- Nevada population in drought: 2,700,551
Current Conditions
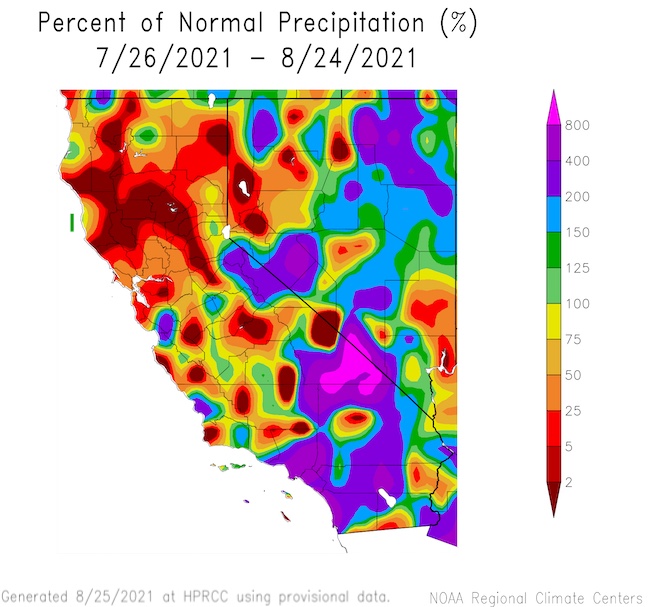
- According to the U.S. Drought Monitor, over the last 4-8 weeks drought conditions continued to worsen across all of California with some improvement in parts of Nevada due to the above-normal monsoonal precipitation. Both California and Nevada continue to be 100% in drought and on August 17, 2021 the California-Nevada DEWS set a new maximum drought intensity record where D4 affected 42.05% of the region.
- The California-Nevada region had record daily maximum and minimum temperature averaged over June and July. These record monthly averages were punctuated by numerous heat waves.
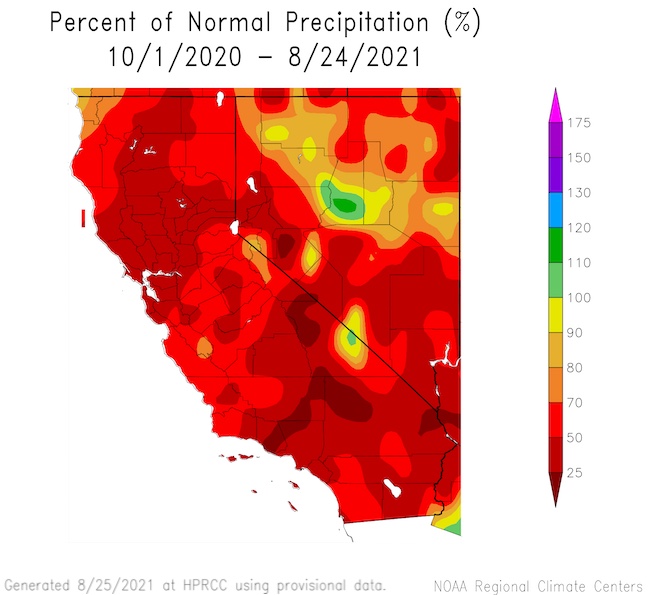
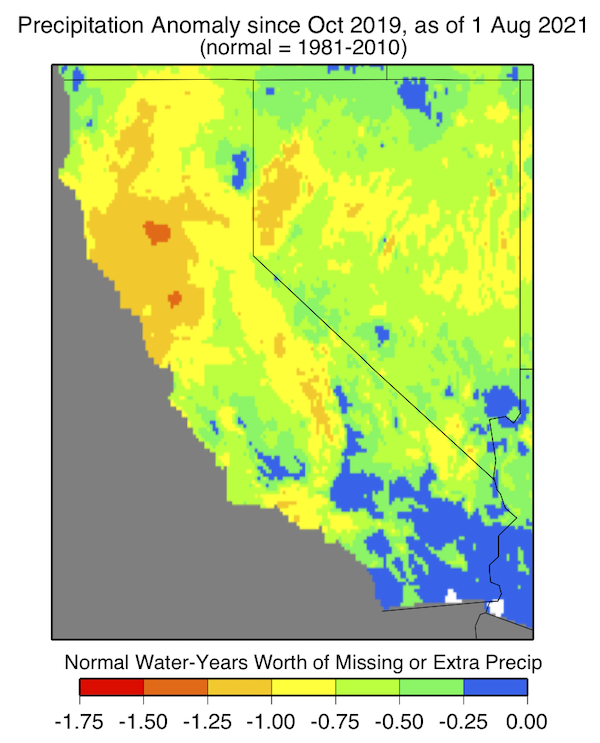
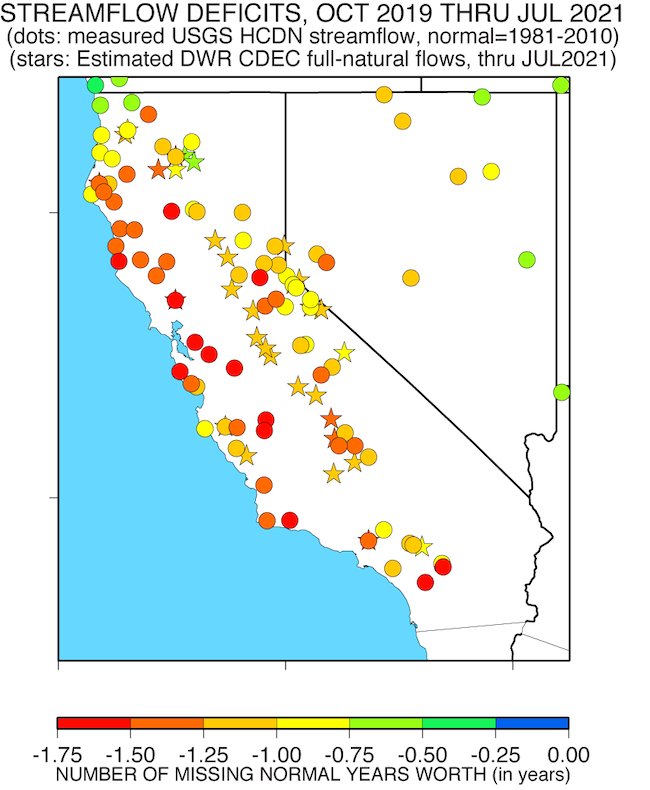
- Since October 2019, much of California and Nevada are missing 0.5 to 1+ years' worth of precipitation, and California 1.5+ years of missing streamflow. Streamflow is “missing” more than precipitation, illustrating the non-linearities between precipitation and streamflow.
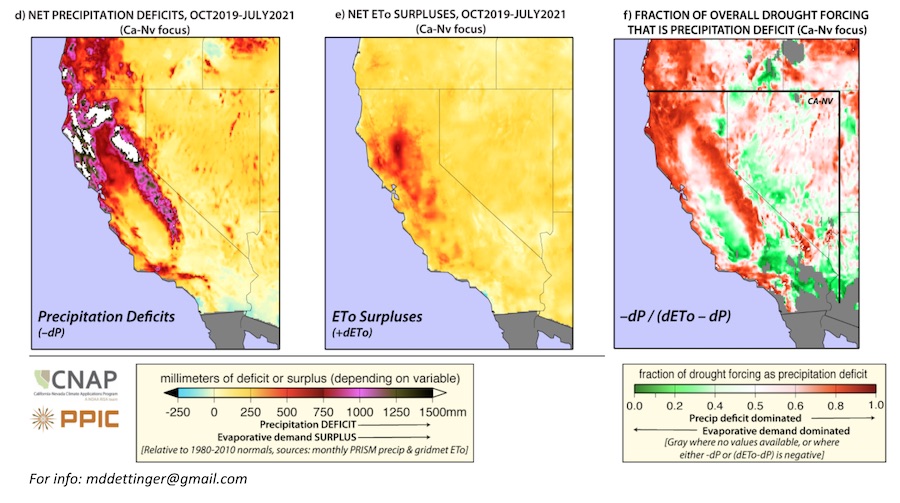
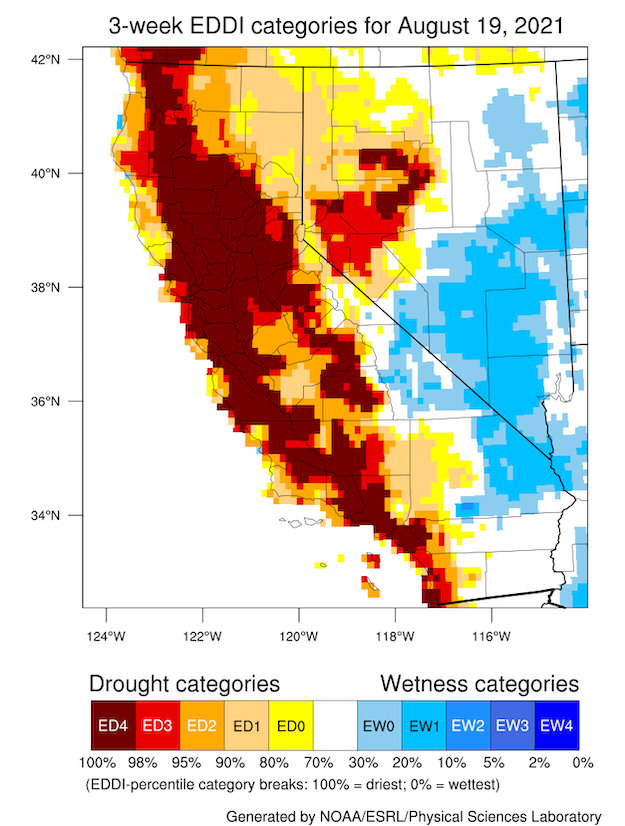
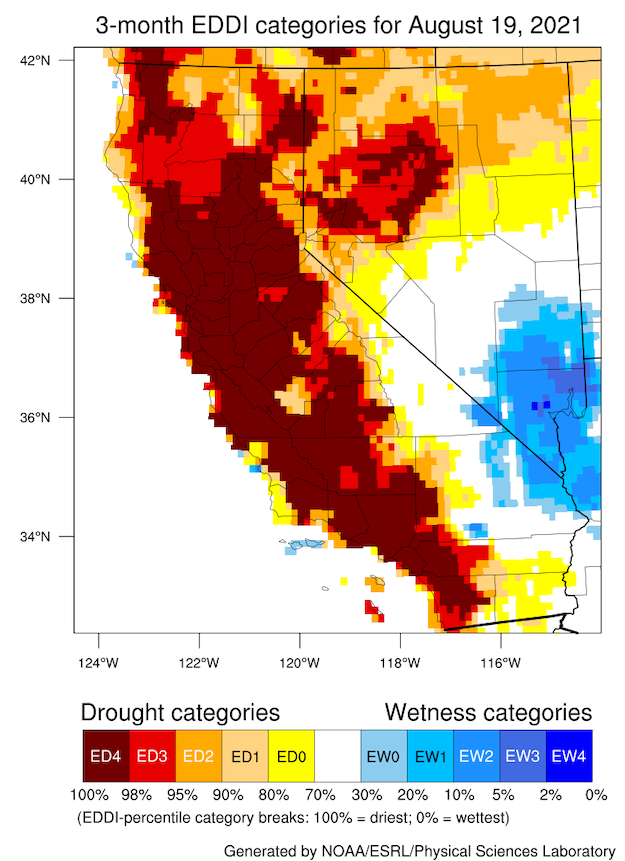
- The current drought is a combination of a precipitation deficit and a surplus of evaporative demand (the atmospheric conditions leading to the drying of the landscape). The excess evaporative demand is the dominant driver of drought across 23% of California and Nevada, and in 37% of the region the evaporative demand excess is approximately equal to the precipitation deficit.
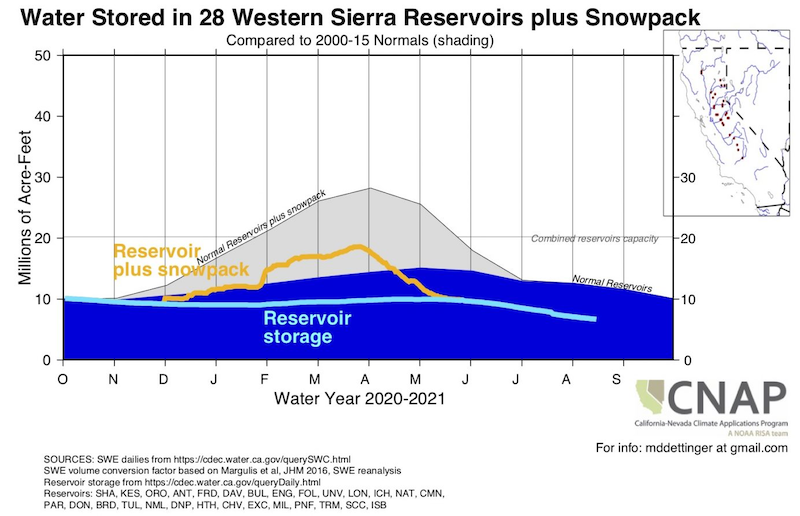
- The total storage in 28 Western Sierra Reservoirs in July this year was 8.6 million acre-feet, whereas the total storage in the same 28 reservoirs was 7.8 million acre-feet in July 2015. On average for this time of year the same 28 reservoirs have slightly over 10 million acre-feet.
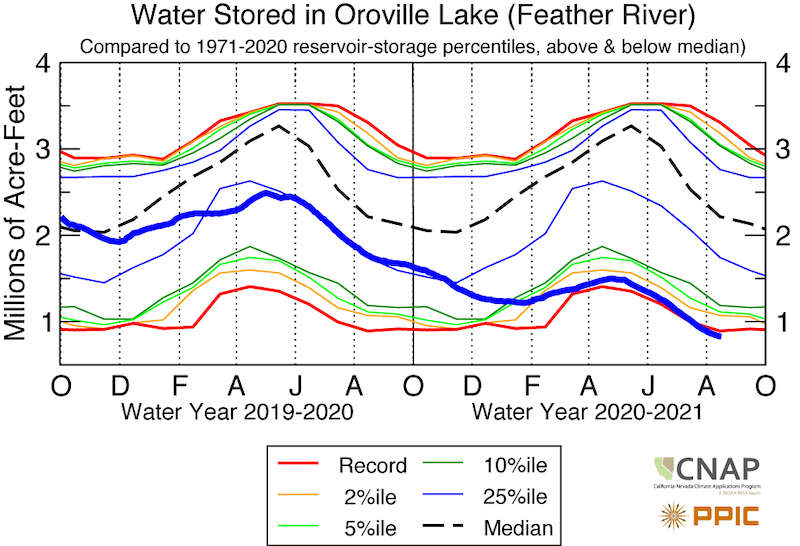
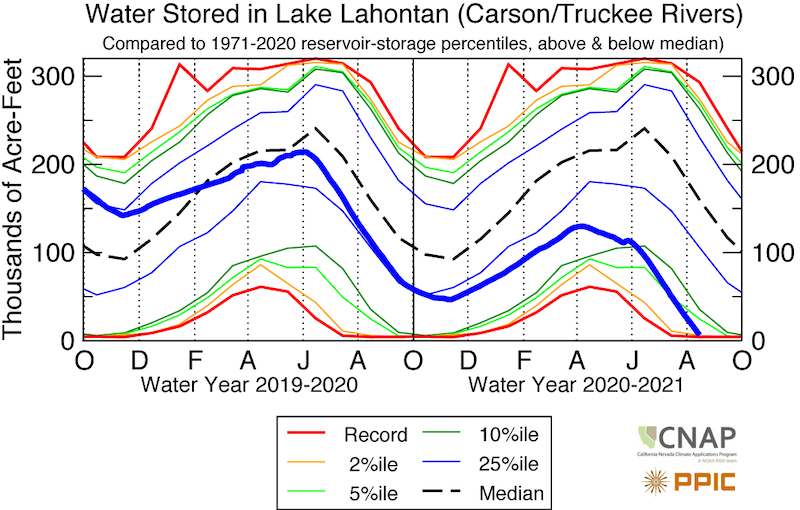
- California’s Lake Oroville is below the previous record low level, and Nevada’s Lake Lahontan is near record low levels. Most of the 10 largest reservoirs in Northern California are below the 25th percentile levels for this time of year.
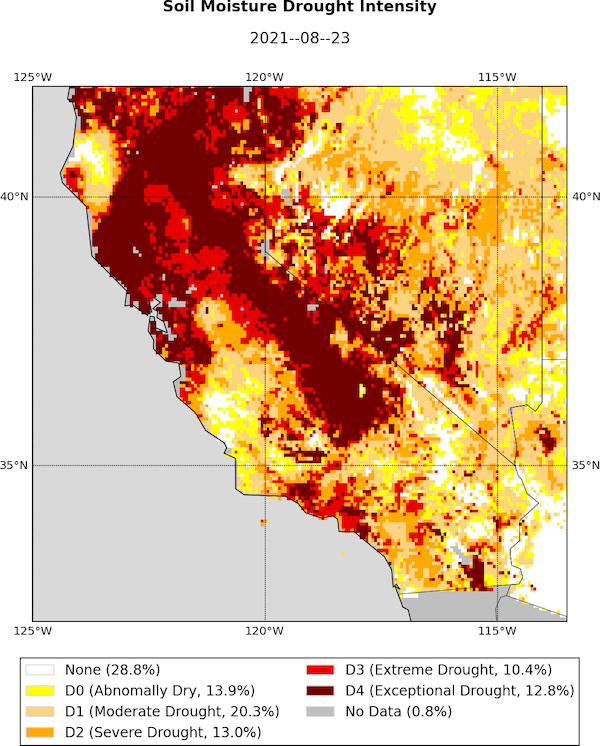
- Flows remain much below to extremely below normal, and high soil moisture deficits remain.
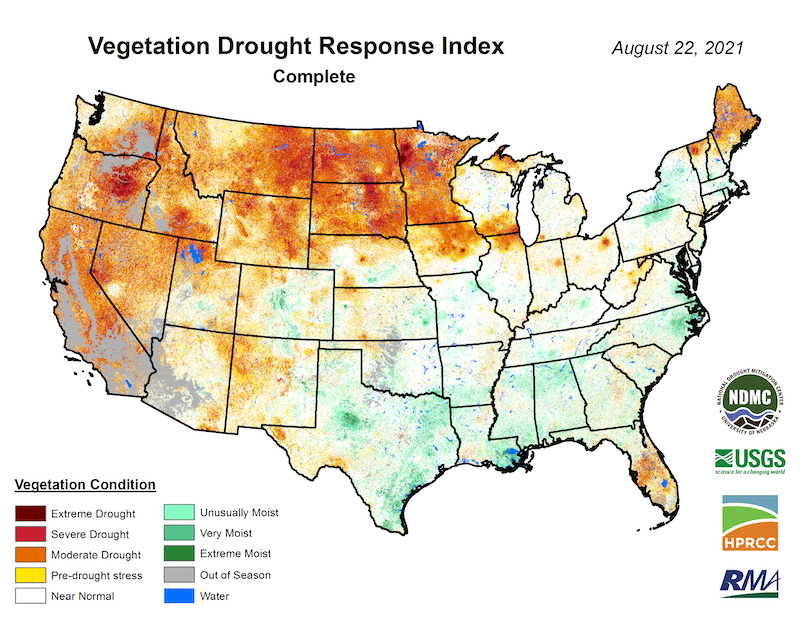
- Evaporative demand (the atmospheric thirst) remains high as it has been throughout this water year, with the exception of Southern Nevada recently, contributing to vegetation stress.
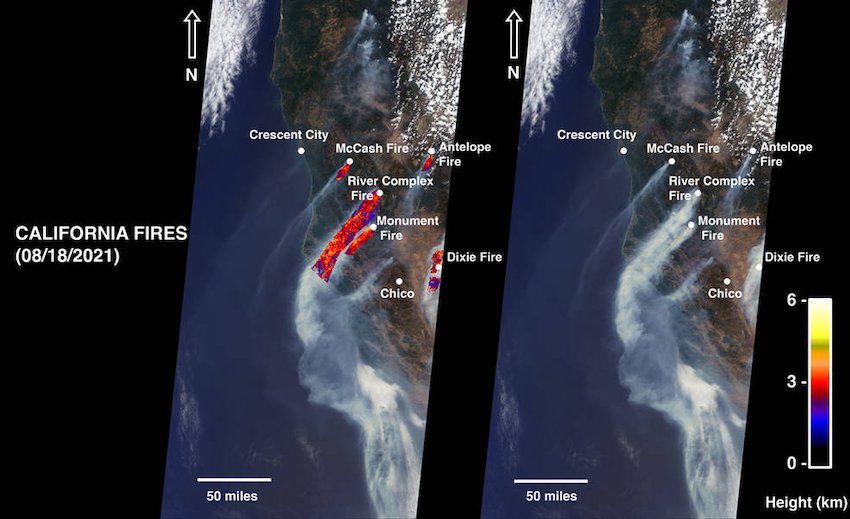
- The current drought conditions have led to concern for the wildfire season. As of August 23, 1.625 million acres have burned in California. This includes the Dixie Fire that has burned 735,000 acres as of August 25—making it the largest single fire in the modern era. By contrast, around 100,000 acres have burned in Nevada so far this year, well below recent averages.
How Is Drought Affecting Your Neighborhood?
Click to see drought indicators, outlooks, and historical conditions by city, county, and state, and to sign up for U.S. Drought Monitor alert emails.
Percent of Normal Precipitation: Last 30 Days and Water Year to Date
June–July Daily Maximum and Minimum Temperatures, 1895–2021
Precipitation and Streamflow Deficits
Contribution of Precipitation Deficit and Evaporative Demand Surplus
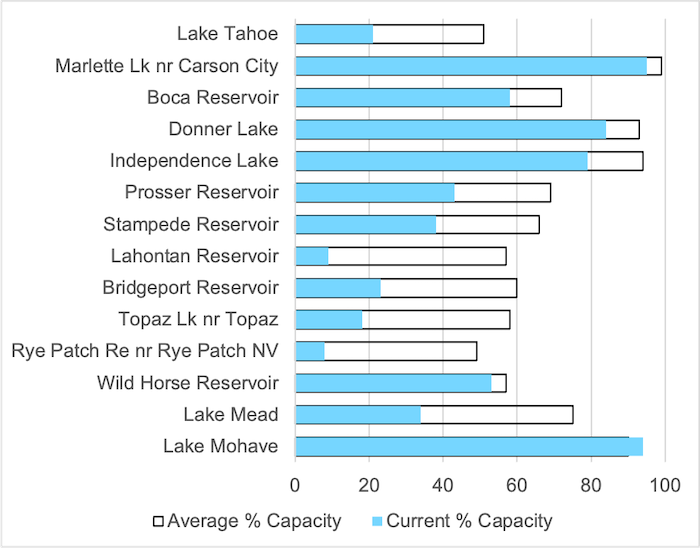
Nevada Reservoir Conditions
Water Storage + Snowpack in Western Sierra Reservoirs
Oroville and Lahontan Water Storage
Evaporative Demand Drought Index (EDDI)
Soil Moisture Conditions
Vegetation Drought Response Index (VegDRI)
Recent Drought Impacts
- Find additional impacts at the National Drought Mitigation Center's Drought Impact Reporter.
- Condition Monitoring Observer Reports (CMOR) over the past 4–6 weeks highlight failed domestic and agricultural wells, plant stress, reduced water use, reduced pasture, supplemental feeding, more fire risk, and increased leaf rolling and burning of garden plants.
Water Supply
- August 20: California State Water Resources Control Board issues curtailment orders to approximately 4,500 right holders to protect drinking water supplies, prevent salinity intrusion, and minimize impacts to fisheries and the environment.
- August 17: Metropolitan Water District declares water supply alert in response to severe drought.
- August 16: Reclamation announces 2022 operating conditions for Lake Powell and Lake Mead. Downstream releases from Glen Canyon Dam and Hoover Dam will be reduced in 2022 due to declining reservoir levels. In the Lower Basin the reductions represent the first “shortage” declaration.
- August 11: California state agencies announce the first round of commitments for $200 million in drought funding to support small communities: 10 systems to receive $25 million for immediate relief.
- July 28: California Department of Water Resources (DWR) completes installation of emergency salinity drought barrier.
- Gold rush era relics are appearing in Folsom Lake as water levels dip.
Agriculture
- August 2: U.S. Department of Agriculture invests $15 million in Klamath River Basin
- According to recent California National Agricultural Statistics Service (NASS) reports:
- Valencia oranges were reportedly soft due to lack of water in Tulare County, while older citrus groves were showing higher heat stress where water is in short supply.
- Rangeland and non-irrigated pastures were in poor to very poor conditions. Some livestock were moved to areas with better grazing and water conditions.
- Fire evacuations and relocation of livestock continued as wildfires consumed more forest and rangeland.
- Some bees were active in late sunflower fields, while some hives were placed near water sources.
- July 12: California 2021 almond production forecast was down 13% from May’s forecasts and 10% compared to last year’s record 3.12 billion meat pounds.
- August 20 from NASA: Drought Makes its Home on the Range
- Drought in North Dakota is impacting bees, which has far-reaching impacts on California cash crops that use them for pollination.
Energy
- August 5: California DWR State Water Project operations managers took Hyatt Powerplant at Lake Oroville offline due to falling lake levels for the first time.
- July 30: California governor Newsom signs emergency proclamation to expedite clean energy projects and relieve demand on the electrical grid during extreme weather events this summer. The state is in the process of procuring five temporary gas-fueled generators.
Wildfire:
- California has seen a significant uptick in fire activity in the past 6 weeks with approximately 1.6 million acres so far in 2021. This includes the Dixie Fire, which is currently the largest single fire in the modern record for California. Source: CAL FIRE.
- Nevada has had just over 100,000 acres burned as of August 24. Source: Great Basin Coordination Center.
- To better provide public and firefighter safety due to extreme fire conditions throughout northern California, and strained firefighting resources throughout the country, the USDA Forest Service Pacific Southwest Region announced a temporary closure of nine National Forests.
Smoke from California Fires: August 18, 2021
Wildlife
- More animals—such as deer, coyotes, wild turkeys, skunks, and raccoons—are venturing into East Bay yards looking for food and water. East Bay Regional Parks intend to increase water capacity.
- The California Department of Fish and Wildlife has asked anglers to fish earlier in the day so as not to stress fish during the hottest part of the day.
- The Bureau of Land Management has begun efforts to capture 50% more wild horses (~6,000 animals) than originally planned this year due to the severe drought, primarily in Nevada, Oregon, and Colorado.
- Drought impacts on rice fields will likely have impacts on millions of ducks, geese, and other waterfowl and migratory shorebirds who rely on the flooded fields for a ‘rest stop’ during migration.
Report Your Drought Impacts
Drought and Climate Outlook
El Niño/Southern Oscillation (ENSO)
NOAA’s ENSO alert system status is currently a La Niña Watch.
ENSO-neutral is favored for the remainder of summer (~60% chance in the July–September season), with La Niña possibly emerging during the August–October season and lasting through the 2021–22 winter (~70% chance during November–January). For more information, please check out the NOAA ENSO blog.
Seasonal Drought, Temperature, and Precipitation Outlooks
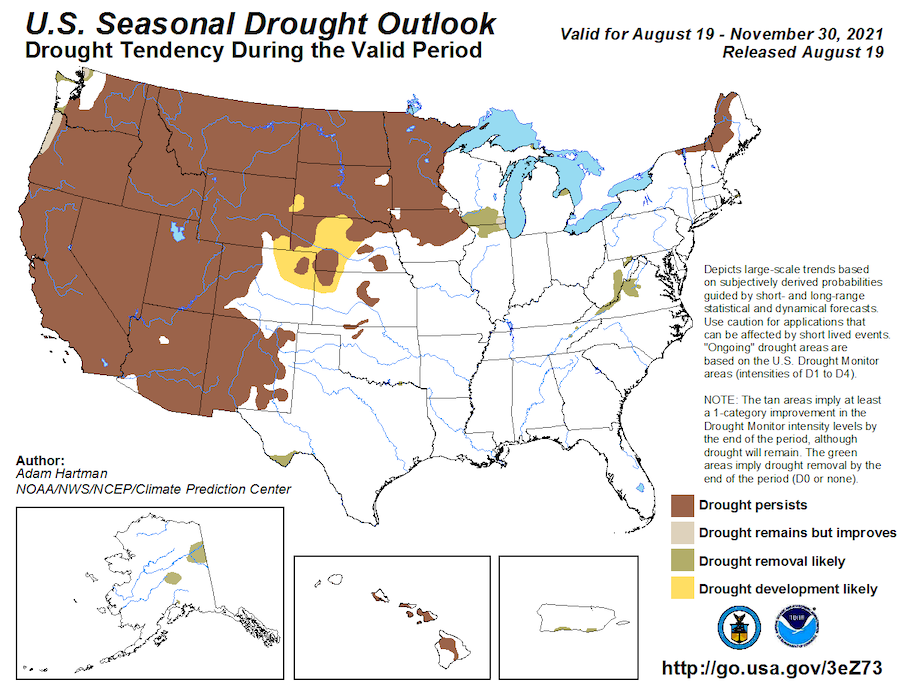
The seasonal forecasts (next three months) show drought persisting across California and the Great Basin, where much of the region is in its dry season and abnormal warmth is favored to persist. The September-October-November outlook from National Weather Service's Climate Prediction Center shows increased odds of above-normal temperatures continuing across most of the West. Forecasts increasingly reflect the potential for La Niña development in the fall and into the winter. Historically, La Niña is associated with dry to normal conditions in the southern part of California and Nevada.
Seasonal Drought Outlook: August 19–November 30, 2021
Three-Month Temperature and Precipitation Outlooks
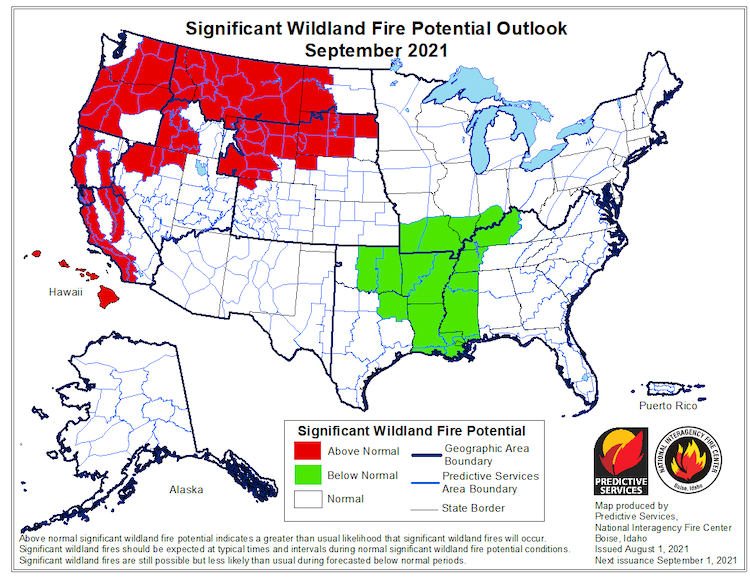
Significant Wildland Fire Potential Outlook
According to the National Interagency Fire Center’s Predictive Services, fire activity increased significantly across the West during July and continued into August. The national preparedness level increased to its maximum value of five on July 14, the earliest date in the past decade.
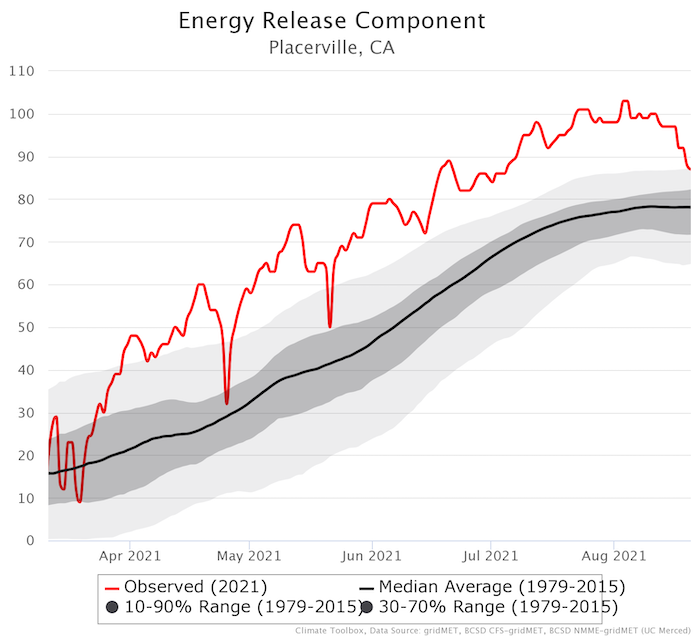
The combination of record-setting temperatures in June and July with limited precipitation has allowed for fire danger indices to track record levels for much of the summer in the Sierra Nevada and portions of northern California. Extremely dry conditions have also allowed live fuel moistures to drop below critical values in many areas. While fire danger conditions have been less extreme in southwestern California, live fuel moistures are below normal with several regions having critically dry conditions by mid-August. Reduced grass fuel loads in the Great Basin due to a second year of drought conditions has limited fire activity. Monsoonal precipitation across southern and eastern Nevada and reduced evaporative demand have further kept fire danger indices below to near-average levels.
Most of California is forecast to have above-normal significant fire potential through at least September due to a combination of current conditions and tendency for warmer than normal conditions in the coming weeks with no signs of fire-slowing or season-ending precipitation. Continued critically dry live and dead fuels into September and October during the seasonal commencement of offshore downslope winds increases wind-driven fire potential.
Energy Release Component
Significant Wildland Fire Potential Outlook: September 2021
Drought Early Warning Resources
California Nevada California-Nevada DEWS
Prepared By
Amanda Sheffield
NOAA/NIDIS California-Nevada DEWS Regional Drought Information Coordinator
Email: amanda.sheffield@noaa.gov
Julie Kalansky
Program Manager, California-Nevada Applications Program (NOAA RISA team)
Email: jkalansky@ucsd.edu
This drought status update is issued in partnership between the National Oceanic and Atmospheric Administration (NOAA), the California-Nevada Applications Program, a NOAA RISA team, and the Western Regional Climate Center at the Desert Research Institute to communicate the current state of drought conditions in California-Nevada based on recent conditions and the upcoming forecast. NIDIS and its partners will issue future drought updates as conditions evolve.
