Ample Precipitation—Just Not Where We Need It.
Key Points:
- According to the U.S. Drought Monitor, approximately 6% of the Northeast DEWS region is experiencing drought or Abnormally Dry (D0) conditions. These localized areas are currently confined to portions of western New York, the Massachusetts Cape, Martha’s Vineyard, and Nantucket. In these areas, drought designations are mostly driven by groundwater deficits.
- New England and New York have wetter trending climates, but there are still localities that are not seeing much needed precipitation.
- The lake effect snow blitz in western New York state did not do much to replenish groundwater and dry wells in Orleans, Genesee, Wyoming, Monroe, and Livingston counties.
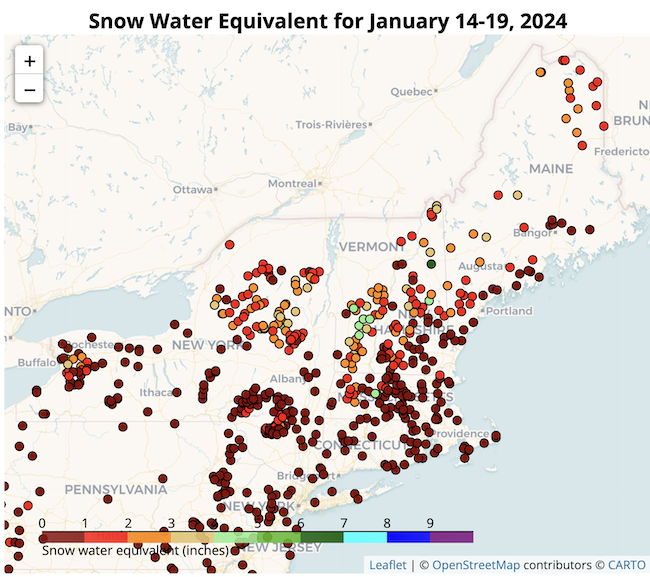
- With just two weeks of data in, the Snow Survey map for the Northeast depicts low snow water equivalent (SWE), less than an inch, in the snowpack for much of New York outside of the Adirondacks and localized lake-effect zones.
- Groundwater levels on the Cape and Martha’s Vineyard are improving. Groundwater levels on Nantucket have leveled off but are still well below normal. Significant improvements to groundwater levels on these islands is needed to eliminate Severe Drought (D2).
Percent of normal precipitation across the Northeast for December 2023, showing where precipitation was above normal (green hues) and below normal (red and orange hues).
December’s precipitation pattern resembled what would be expected during an El Niño winter—drier-than-normal conditions in interior locations such as western Pennsylvania and West Virginia and wetter-than-normal conditions in coastal areas. Map and description provided by the NRCC climate blog.
Percent of Normal Precipitation (%)
Percent of normal precipitation across the Northeast for December 2023, showing where precipitation was above normal (green hues) and below normal (red and orange hues).
December’s precipitation pattern resembled what would be expected during an El Niño winter—drier-than-normal conditions in interior locations such as western Pennsylvania and West Virginia and wetter-than-normal conditions in coastal areas. Map and description provided by the NRCC climate blog.
Current Conditions for the Northeast
- With a few snow and rain events, some western New York counties experiencing dry wells and Severe Drought (D2) conditions saw a one-category improvement to Moderate Drought (D1) over the last two weeks.
- The geographic extent of Abnormal Dryness (D0) and Moderate Drought (D1) has not changed much since Christmas.
- The South Fork of Long Island benefited from precipitation events since the start of the New Year. Abnormal Dryness (D0) was eliminated.
- Severe Drought (D2) has been a fixture on Martha’s Vineyard and Nantucket since the first of the year.
- The Provincetown area (the tip of Cape Cod) saw Abnormal Dryness (D0) improve over the last few weeks, but the “elbow” of the Cape did not see the same improvement.
- Massachusetts had 6.71 inches of precipitation in December, which is 150% of normal. New York received 5.70 inches, which is 163% of normal. These summary statistics and additional data from 2023 can be found on the Northeast Regional Climate Center’s website.
- Plowable snows came late to the region this year. Low snow water equivalent (SWE) is observable across much of the Northeast DEWS. Sites in Vermont and a few sites in New Hampshire are in better shape.
Snow Drought: Snow Water Equivalent for January 14–19, 2024
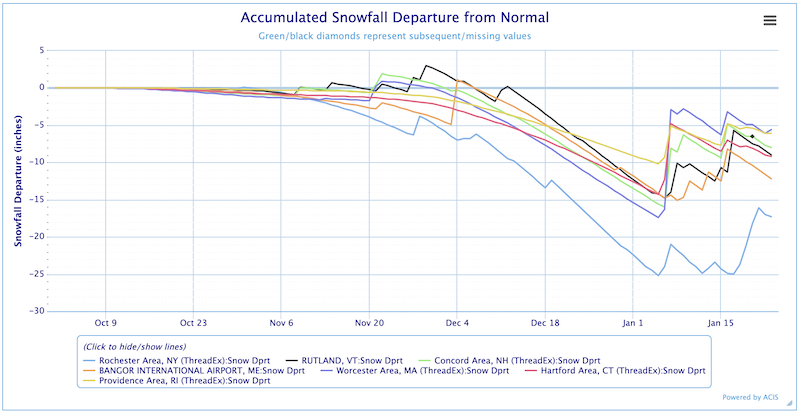
Accumulated Snowfall Departure from Normal
This chart plots the snowfall departure from normal for selected sites across the region and highlights the snowfall deficits that will impact groundwater recharge.
Drought Impacts in the Northeast
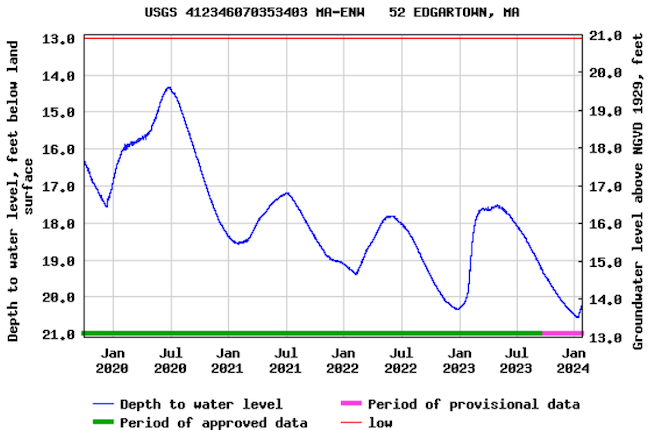
Most groundwater levels on the Cape and Islands tend to increase (showing that the aquifer is recharging) in December and January each year. Improvements usually continue through May and July. When there are extended or repeated periods of reduced precipitation, the December to January recharge can be muted, as is occurring this year.
Groundwater Levels: Edgartown, Massachusetts
This graph of the U.S. Geological Survey observation well ENW-52 at Edgartown, Massachusetts on Martha’s Vineyard is an example of a typical groundwater hydrograph on Cape Cod and the Islands showing the increases and decreases in water levels during the last 4 water years and current (2024) water year. Groundwater levels tend to reach their lows in December or January and reach their highs in May through July depending on precipitation during the year.
Additional Sites for Monitoring Snowfall and Snowpack
- The Northeast River Forecast Center (NERFC) snow page offers a regional perspective on snow conditions. Data and maps with daily snowfall observations, snow depth, and forecasted snow melt provide near real-time data for monitoring and decision making.
- The National Operational Hydrologic Remote Sensing Center also offers data on the northeast snow pack along with station observations and gridded analysis products.
- The Maine Cooperative Snow Survey site, provided by the Maine Geological Survey, includes observational data for selected sites, maps and graphics.
For Regional Awareness
- On December 13, the Massachusetts Drought Task Force announced that Dukes and Nantucket counties were in Level-2 (Significant Drought) status.
- Cape Cod.com - New Drought Status for Martha’s Vineyard and Nantucket
- Visit the Massachusetts Drought Status page for more information on the Level 2 designation and suggested actions.
- Visit the New York State Drought page for more information on status and guidance on hauling potable water.
Drought Impacts in the News
New York
January 5, 2024: WIVB.com - Bethany Water Crisis Update
January 4, 2024: The Daily News - Batavia Fountain Shut Off Due To Drought Conditions
January 1, 2024: Rochester First.com - 2023: The Sixth Warmest Year On Record for Rochester
December 29, 2023: NBC NEWS10 Rochester - State of Emergency for Genesee County Town
December 13, 2023: The Post-Journal - Vegetable Farm In Lake Erie Watershed Receives Grant Supporting The Installation Of A New Well
Maine
January 20, 2024: The Maine Monitor - Climate Crisis Urgency
January 18, 2024: Maine Morning Start - Climate Wake Up Call
January 19, 2024: Sun Journal - Webinar Series For Agricultural Producers
Massachusetts
January 10, 2024: Daily Hampshire Gazette – Trust Fund For State Disasters Could Support All Emergency Responses To Weather and Climate Events
January 10, 2024: The Sun Chronicle – Foxboro Gets Funding For Water Conservation Education
January 8, 2024: New England Public Media – State Disaster Relief Trust Fund Advocacy: Farmers Need Grants Not Loans
January 5, 2024: MA Lawyers Weekly – Lawyers Defend DEP’s Right To Restrict Water Use During Drought
December 15, 2023: Cape Cod Times – The Concern Is Over Ground Water Recovery
December 14, 2023: MV Times – Reactions To Drought Status
December 14, 2023: Cape Cod.com – New Drought Status for Martha’s Vineyard and Nantucket
December 13, 2023: Vineyard Gazette – Drought Declaration For The Vineyard
New Hampshire
January 14, 2024: Concord Monitor – Climate Is Upending Seasonal Patterns
Vermont
January 3, 2024: VermontBiz – Governor and State Treasurer Announce Resilience Implementation Strategy
Consider reporting and sharing your local drought impacts to help inform the U.S. Drought Monitor authors, our neighbors, and drought mitigation response agencies. Comments on snow cover and your photos are greatly appreciated, too.
View an interactive map of CMOR reports. See what your county is reporting and add to the impact dataset.
Looking Ahead: Outlooks for the Northeast
Visit NOAA’s Climate Prediction Center for the 8-14 day and 3–4 week temperature and precipitation outlooks.
- As of January 25, 2024, both of these time frames have temperature outlooks calling for above normal (warmer) conditions for the entire region. The 3–4 week temperature outlook will be updated on January 26.
- Continued warmth would benefit groundwater recharge opportunities for both New York and Massachusetts.
- The 8-14 day precipitation outlook calls for below-normal precipitation. The 3-4 week outlook calls for equal chances of above-normal or below-normal precipitation.The 3–4 week temperature outlook will be updated on January 26.
- Dry areas, in both New York and Massachusetts, may miss out on significant precipitation opportunities for these time frames.
- The Drought.gov Outlooks and Forecast page and State Drought pages also provide maps and descriptions of anticipated temperature and precipitation conditions.
Additional Resources
- Look back at previous Northeast DEWS Drought Status Updates.
- Northeast Drought Early Warning System Dashboard.
- Sign up for NIDIS emails on our email sign up form.
- Your local National Weather Service office.
- NOAA Regional Climate Services Monthly Webinar Series (next webinar is January 30).
- USDA Northeast Climate Hub.
- USGS New England and New York Water Science Centers.
- NIHHIS Urban Heat Island Mapping: Applications due January 31, 2024.
- University of Albany and New York State Emergency Management join forces to improve state weather mesonet.
- Flash Drought: A State of the Science Review, released January 9, 2024.
- Explore drought information for your state:
- Connecticut Drought Information Center
- Maine Drought Task Force
- Massachusetts Drought Management Task Force
- New Hampshire Department of Environmental Services: Drought
- New York State Department of Environmental Conservation (DEC): Drought
- Rhode Island Water Resources Board: Drought Management Program
- Vermont Agency of Natural Resources, Department of Environmental Conservation: Drought and Other Hazards
Prepared By
Sylvia Reeves
NOAA/National Integrated Drought Information System (NIDIS), CU Boulder/Cooperative Institute for Research in Environmental Sciences (CIRES)
Samantha Borisoff, Jessica Spaccio, Keith Eggleston, Art DeGaetano
Northeast Regional Climate Center
Ellen L. Mecray
Regional Climate Services Director, Eastern Region, NOAA
Gardner Bent
USGS New England Water Science Center
In partnership with National Weather Service Offices of the Northeast and State Climate Offices of the Northeast.
This drought status update is issued in partnership between the National Oceanic and Atmospheric Administration (NOAA), U.S. Geological Survey, and the U.S. Department of Agriculture (USDA) to communicate concern for drought expansion and intensification within the Northeast U.S. based on recent conditions and the forecasts and outlooks. NIDIS and its partners will issue future drought status updates as conditions evolve.
