Rain in the Southwest: drought improves slightly but continues
Key Points
- Southwest U.S. monsoonal rainfall has begun and has already been a big improvement over last year.
- 30% of the Intermountain West continues in Exceptional (D4) drought .
- The August–October outlook shows a warm and dry season is likely.
- The Pacific is currently ENSO-neutral, but conditions are favorable for the redevelopment of La Niña within the next six months.
Current U.S. Drought Monitor map for the Intermountain West Drought Early Warning System region with data valid for July 20, 2021. The U.S. Drought Monitor is updated each Thursday to show the location and intensity of drought across the country.
Extreme (D3) to Exceptional (D4) drought persists across much of the Intermountain West.
U.S. Drought Monitor Categories
Current U.S. Drought Monitor map for the Intermountain West Drought Early Warning System region with data valid for July 20, 2021. The U.S. Drought Monitor is updated each Thursday to show the location and intensity of drought across the country.
Extreme (D3) to Exceptional (D4) drought persists across much of the Intermountain West.
Recent and Current Conditions
U.S. Drought Monitor Conditions
- Over half (61%) of the combined Intermountain West region is in Extreme (D3) to Exceptional (D4) drought.
- Extreme (D3) drought conditions have been in place in this region since May 2020.
- The extent of D4 drought in the Intermountain West reached a peak of 45% area in December 2020, a new record for the region, and is currently at 31%.
- Moderate (D1) or worse drought has been in the region since August 2009.
- Pockets of Arizona, New Mexico, and southwestern Colorado have seen some recent improvement in drought conditions. Despite the small improvement, Severe (D2) to Extreme (D3) drought remains in these places.
- Drought conditions have remained or deteriorated in Wyoming and Northern Utah.
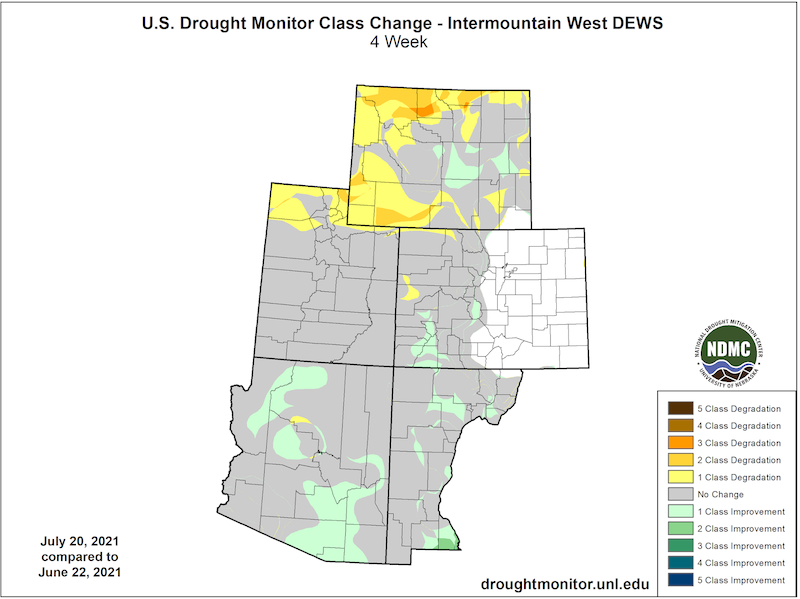
U.S. Drought Monitor 1-Month Change Map
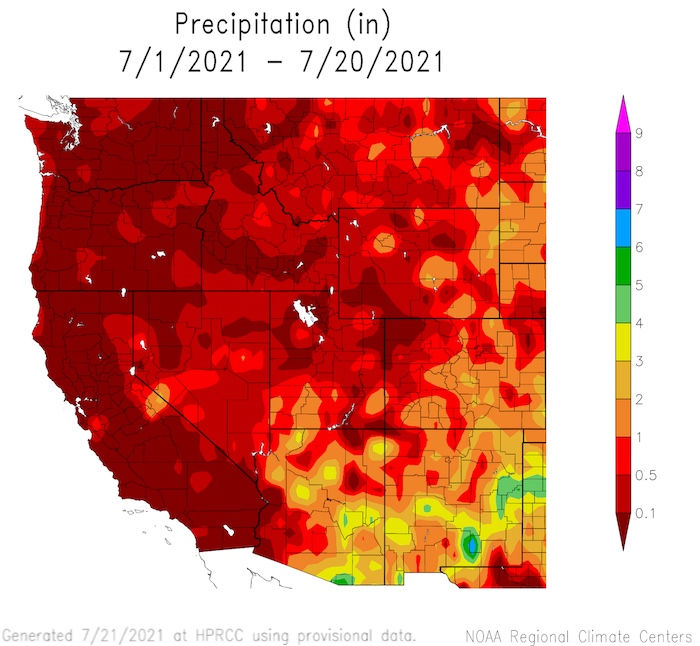
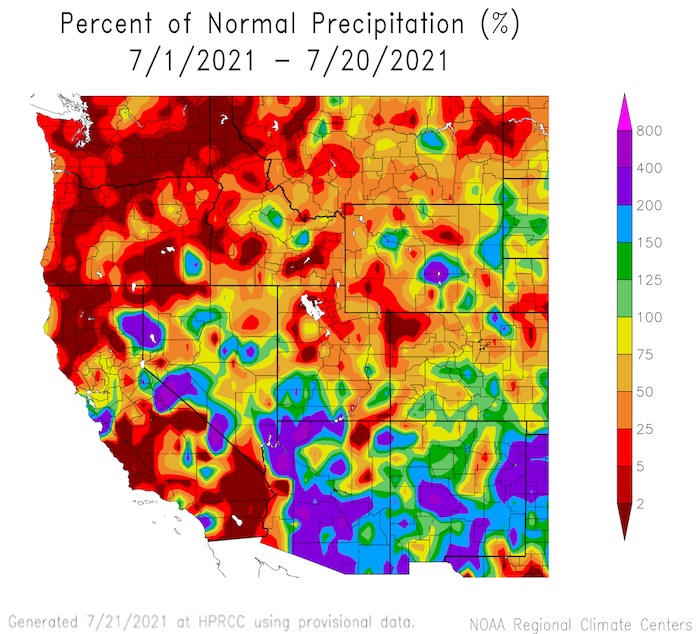
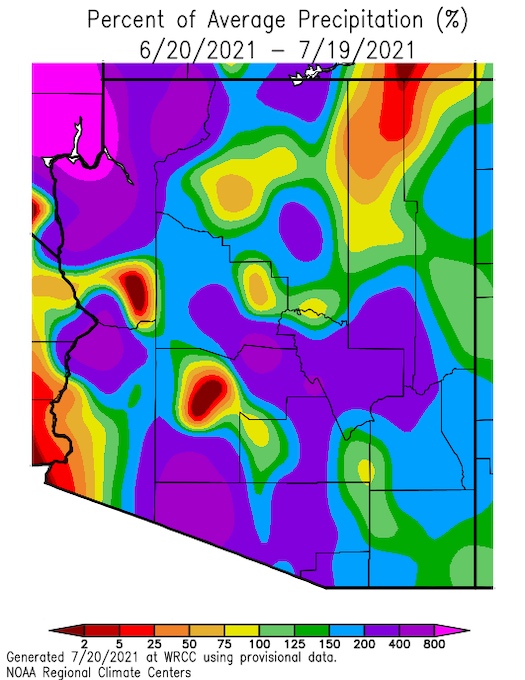
July Precipitation
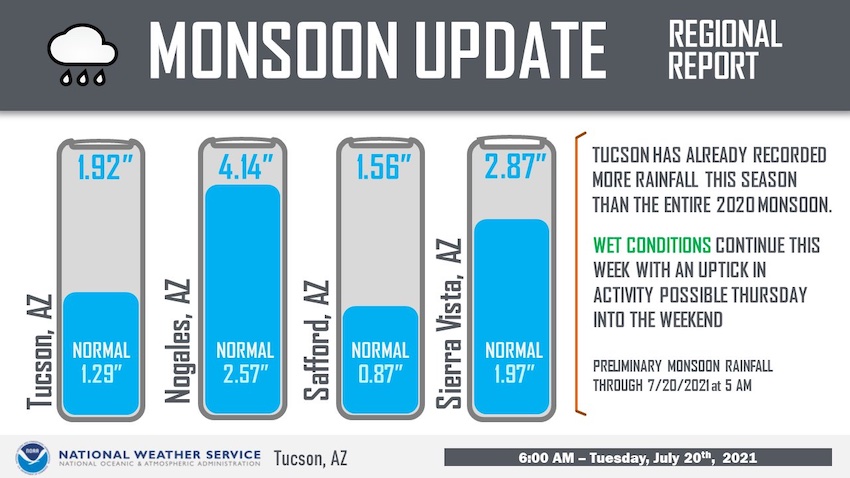
Monsoonal precipitation has begun across the Southwest, and has been a big improvement over last year.
- More than 2 inches of rain for southern Arizona and New Mexico for July, so far.
- Many areas have received >200% of normal precipitation for the month.
- Tucson has had more precipitation this season (so far) than the entire 2020 monsoon season.
- Short-term forecasts show a continuation of monsoon conditions.
- Track the Southwest U.S. Monsoon:
Southwest Monsoon Update
Northern Utah, northern Colorado, and Wyoming have had low precipitation for the month, and drought conditions are worsening for these areas.
Precipitation Conditions: July 1–20, 2021
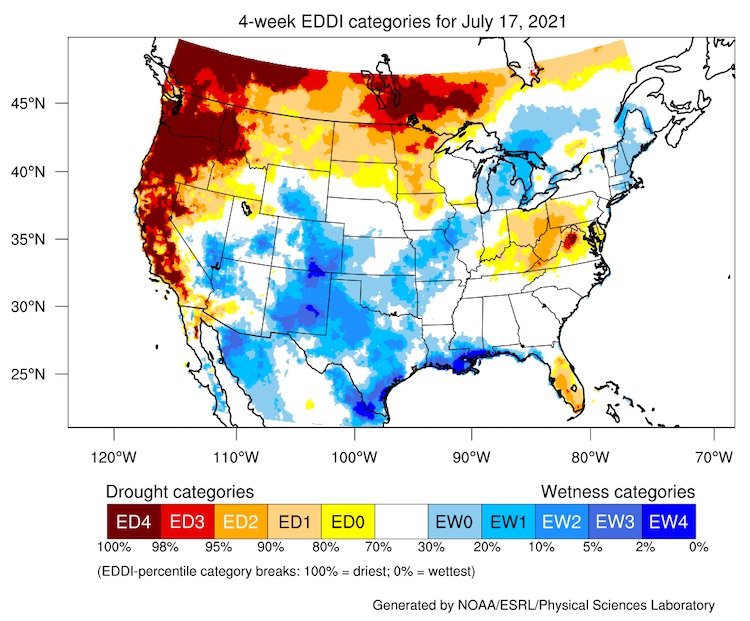
Evaporative Demand Drought Index (EDDI)
4-Week EDDI for July 17, 2021
- EDDI values show increased wetness across most of the Intermountain West.
- The last 4 weeks show the lowest evaporative demand since about April 2020.
Forecasts and Seasonal Outlooks
Summer 2021 Heat and Wildfire
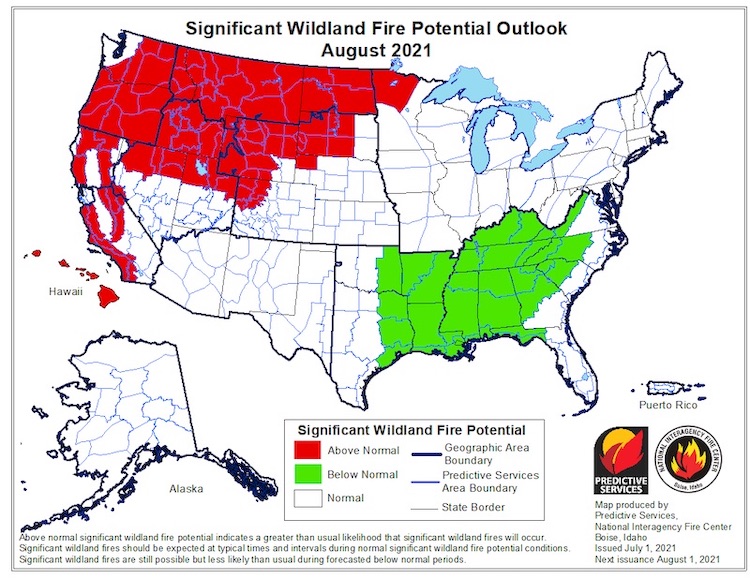
- Recent rainfall has decreased wildland fire risk for the Southwest.
- Above-normal significant fire potential continues in Wyoming, northern Utah, and northeastern Colorado through August.
Significant Wildland Fire Potential Outlooks: August 2021
1–Month Outlook for August
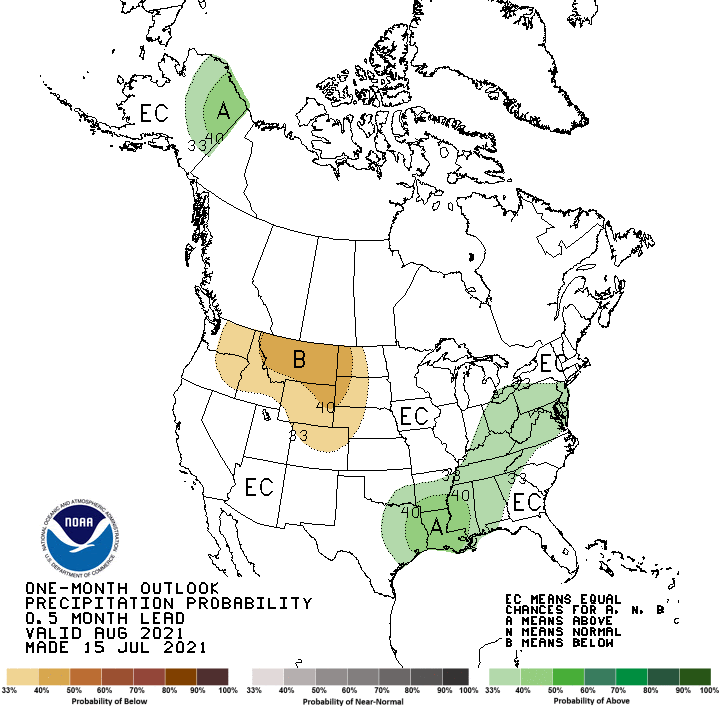
- There are equal chances for wet or dry conditions across most of the Intermountain West in August.
- Odds slightly favor a drier August for Wyoming and northern Colorado.
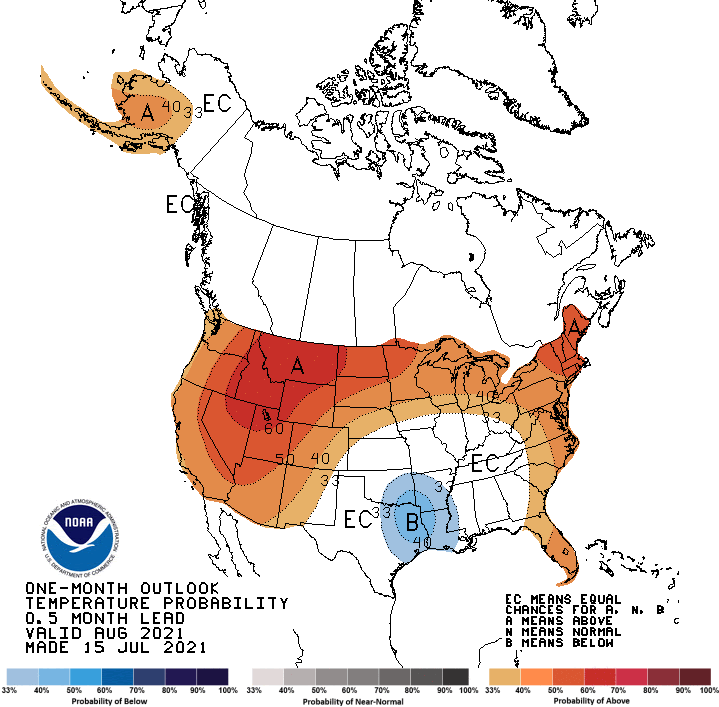
- There is a high chance of above-normal temperatures for the Intermountain West in July.
August 2021 Temperature Outlook
August 2021 Precipitation Outlook
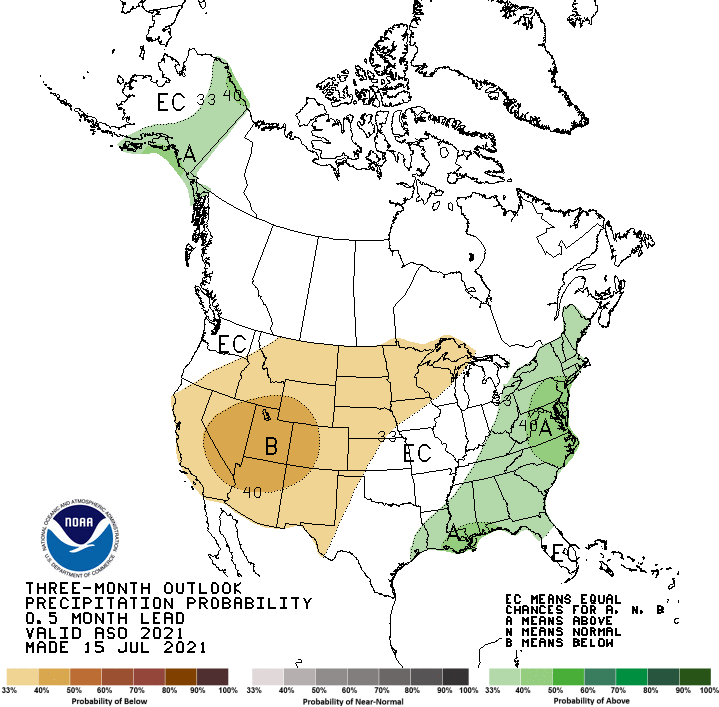
August–October 2021 Seasonal Outlook
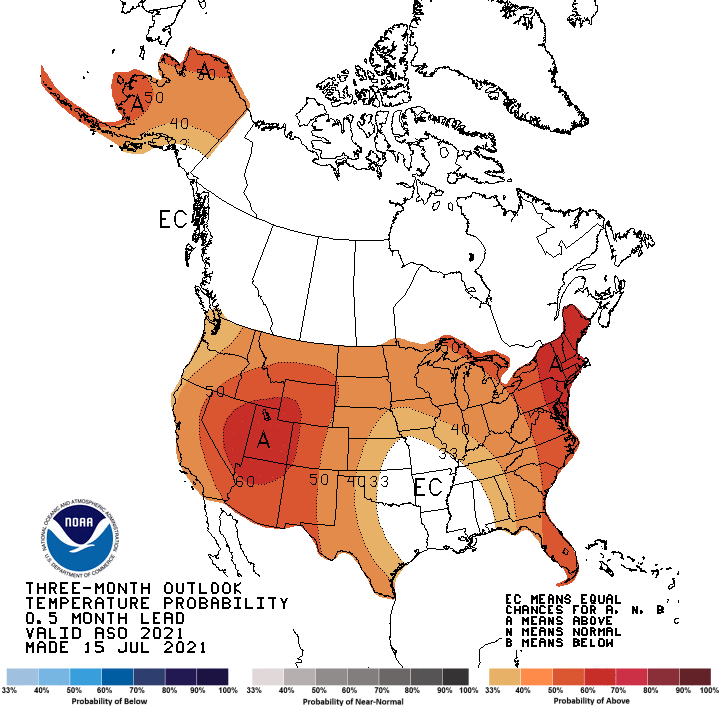
- For August to October, there is a greater chance for above-normal temperatures across the southwest.
- Below normal precipitation is the most likely outcome for Intermountain West for late summer and early fall.
August–October 2021 Temperature Outlook
August–October 2021 Precipitation Outlook
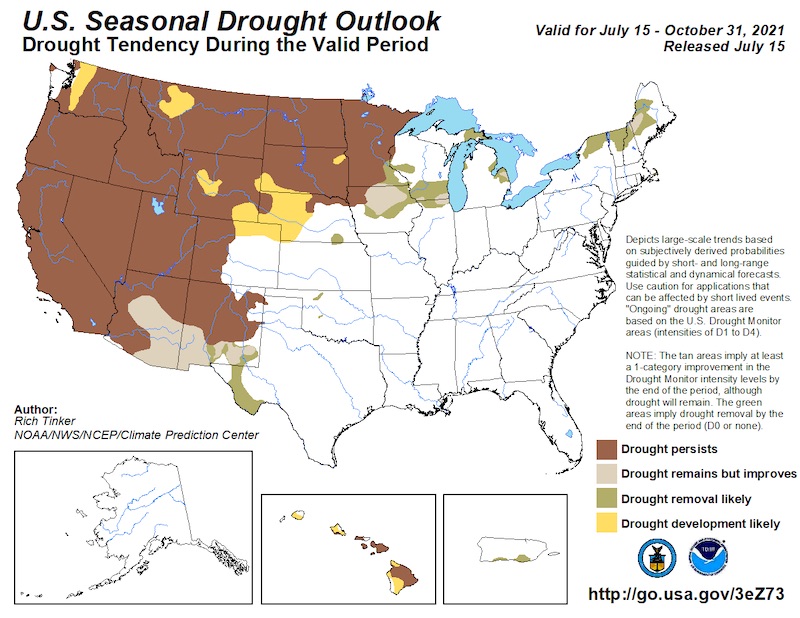
Seasonal Drought Outlook
- Long-term drought conditions are forecast to continue at least through October across the Intermountain West.
- As a result of summer monsoonal precipitation, the drought outlook anticipates drought improving, but remaining for southern Arizona and New Mexico.
3-Month Drought Outlook
Climate Patterns
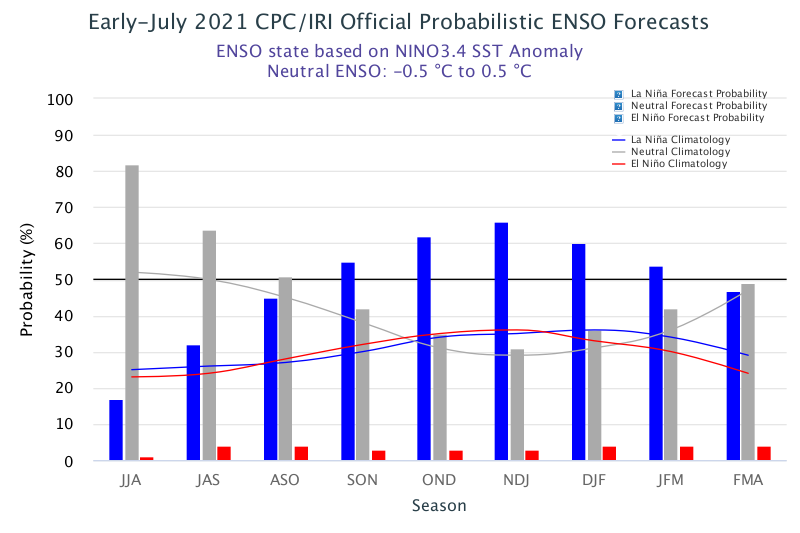
- NOAA’s El Niño–Southern Oscillation (ENSO) alert system status is currently at La Niña Watch—meaning the pacific is currently ENSO-neutral, but conditions are favorable for the redevelopment of La Niña within the next six months.
- La Niña usually correlates with below-normal winter precipitation in the Southwest U.S.
- For more information, please check out the NOAA ENSO blog.
Probability of El Niño, La Niña, or Neutral Conditions
State-Based Conditions and Impacts
Arizona
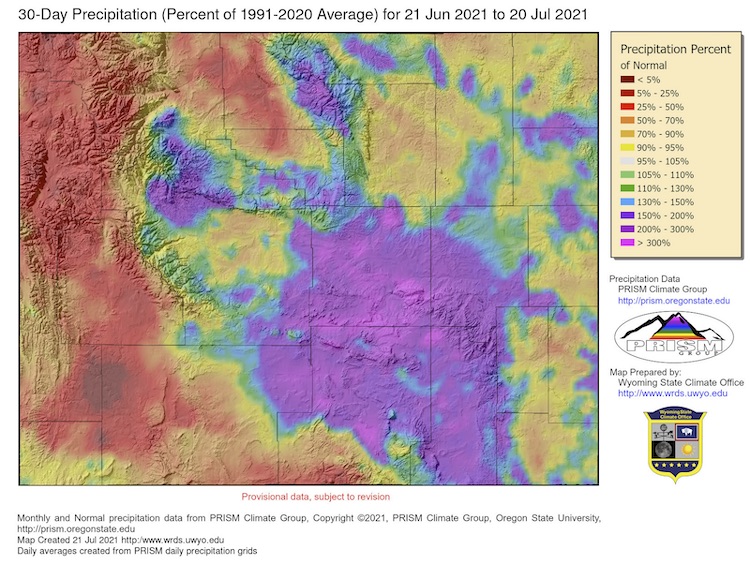
- Southwest Monsoon:
- The monsoon season began aggressively, with northwestern (Mohave and northern Coconino Counties), central (Gila County, southern Navajo and Apache Counties), and south-central Arizona (Pima and Santa Cruz Counties) receiving well over 100% of normal precipitation.
- The precipitation slightly improved drought conditions in these areas.
- Water Storage:
- Lake Powell is currently at 3,556 feet (26 feet below recorded minimum levels).
- The U.S. Bureau of Reclamation ordered releases from Blue Mesa Reservoir (total 36,000 acre-feet), Navajo Reservoir (total 20,000 acre-feet), and Flaming Gorge Reservoir (total 125,000 acre-feet) to support water levels at Lake Powell.
- Lake Powell has extended boat ramps and banned houseboats.
- Juniper die off increased by up to 30% in Prescott National Forest, with 10% of ponderosa pine stands in Prescott National Forest impacted by bark beetle infestation.
- Fire restrictions lifted for state-owned and managed lands.
- A state of emergency was declared for Coconino County and the City of Flagstaff for severe debris flows triggered by intense rain along wildland fire burn scars.
30-Day Percent of Average Precipitation
Colorado
- Western Colorado continues to grapple with long-term drought conditions with the focus shifting towards hydrological drought and water shortages.
- Blue Mesa Reservoir is at all-time low storage.
- McPhee Reservoir is near all-time low storage, just 53% of normal storage.
- GRACE satellite observations and streamflows suggest a much-below-normal water table in western Colorado.
- There remains a stark contrast in soil moisture between the east and west sides of the state.
Top Meter Soil Moisture Percentile
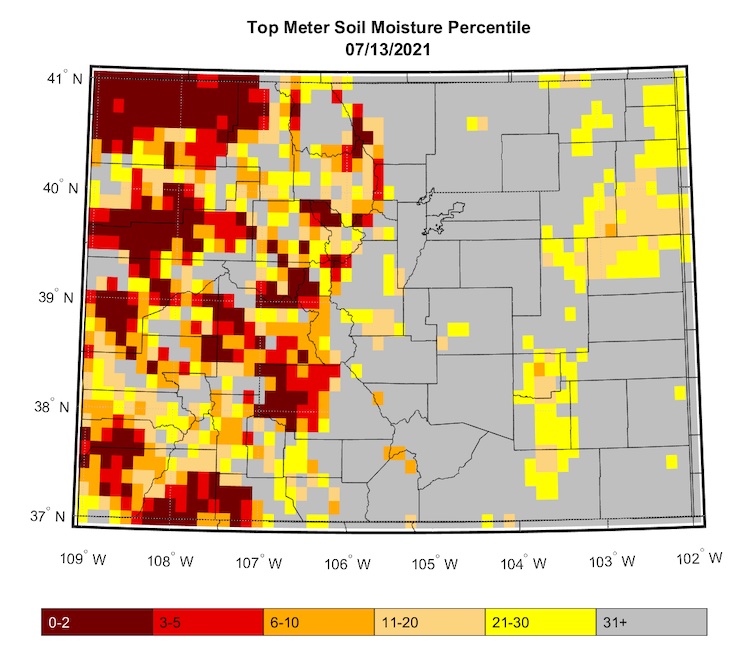
- While recent weeks have trended drier for eastern Colorado, the last 90 days have generally been above average, May in particular. One of the most positive outcomes of this is sufficient range production in most areas. The Grassland Productivity Forecast (Grass-Cast) predicts above-average forage this year through August 31, even if precipitation is below normal for the remainder of summer.
- The short-term forecast is favorable for western Colorado. The high country is forecast to receive 1.00–2.00 inches of rainfall in the next 7 days, with more possible in the San Juans. The widespread moisture should help prevent wildfire ignitions. The Climate Prediction Center's 8–14 day and 3–4 week outlooks hint at continued monsoonal flow, leading to an increased chance for above-normal precipitation over western Colorado. Eastern Colorado will be drier.
New Mexico
- Over the last 9 months, the majority of the region's temperatures were above normal, some areas much above normal.
- Western New Mexico, along the Arizona border, had record warm temperatures in June.
- First 6 months of 2021 were 11th warmest in Las Cruces.
- Overall, it has been a below average water year. Eastern New Mexico benefited from rains in the last 4 months.
- Chaves County has had their record wettest June.
- Elk Coop station east of Cloudcroft recorded 11.01 inches in the last 30 days.
- Despite an average snowpack in the headwaters of the Rio Grande, streamflow is below average.
- Elephant Butte is 6.6% of capacity as of July 22. Last year at this time it was 10.3%.
- Soil moisture is above average in eastern New Mexico.
- Four Corners remains very dry in NM.
- Water year precipitation in Farmington is the 4th lowest on record. Last year at this time it was their 6th lowest water year.
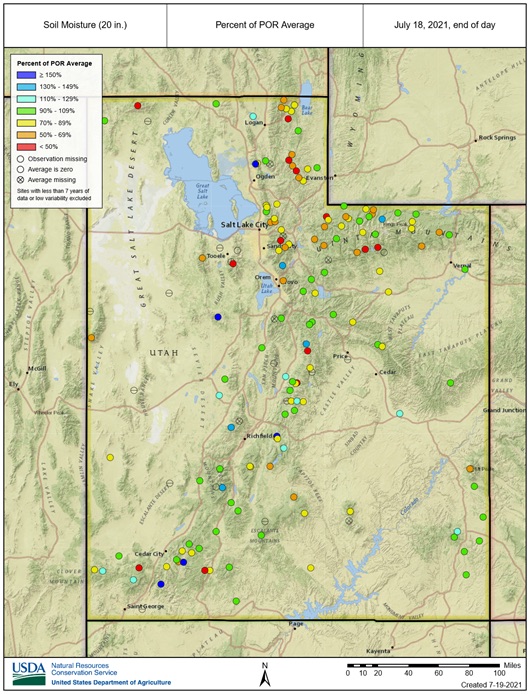
Utah
- The entire state has seen above-average temperatures over the last month while the monsoon season has split Utah’s precipitation pattern in half. Southern Utah’s active monsoon season has resulted in repeated flash flood events while the northern half of the state continues to see little to no precipitation.
- Soil moisture has rebounded above the 25th percentile across the southern half of the state while the northern half remains near record low amounts.
- 12% of the state’s gauged rivers are at all-time lows for this time of year, with only 19% at normal and 3% above normal; 55% of the rivers are flowing less than 25th percentile (25% below 10th percentile).
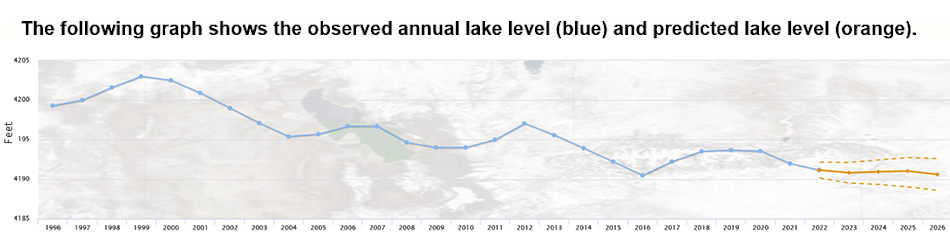
- The Great Salt Lake currently resides only 0.05 inch above the historic low (1963) and is forecast to continue to decline past record levels in August. Lake level forecasts call for the lake to remain at or near record lows through the mid 2020s. Ecologists predict that migratory birds are at significant risk of losing critical marshland as the lake level continues to drop.
Utah 20-Inch Soil Moisture Percentile
Great Salt Lake Levels
Wyoming
- Western and northern Wyoming continued to see above-average temperatures over the last 30 days with mean temperatures 3°F to 6°F or more above the 1991ˆ2020 average. Laramie County and a few scattered areas in the east experienced temperatures as much as 3°F below the average.
- Precipitation over the last 30 days has been above average in the southeast corner of the state, especially in Natrona, southwest Converse, Albany, northern Carbon, and northeastern Sweetwater Counties. Unfortunately, the last two weeks have seen lesser amounts in those areas. Western Wyoming and the Bighorn Basin have generally seen precipitation at less than 50% of average.
- Soil moisture continues to decline. Laramie County in the southeast is in the 5th to 20th percentile, but the remainder of the state is mostly at or below the 5th percentile.
- As a result, Extreme (D3) drought has expanded in the southwest, north, and portions of the northeast, with Severe (D2) drought expanding in several areas in between.
For More Information
More local information is available from the following resources:
In Case You Missed It
- July 20, 2021, 11:00-1:00 p.m. (MDT): Western Drought Webinar
- FY22 Coping with Drought Competition: Building Tribal Drought Resilience
- Deadline: October 18, 2021
- Notice of Funding
- Information Sheet
- Tribal Drought Resilience Competition Informational Webinar
- FY22 Coping With Drought Competition: Ecological Drought
- Deadline: October 18, 2021
- Notice of Funding
- Information Sheet
- Ecological Drought Competition Informational Webinar
Upcoming Events
- July 29, 2021, 1:00 p.m.–2:00 p.m. (CDT): Navigating Drought on Your Ranch: July 2021
- July 29, 2021, 2:00 pm (EDT): NIHIS Exploring the Heat Hazard
- August 24, 2021, 1:00 p.m.–1:30 p.m. (MDT): Southwest Drought Briefing
Prepared By
Joel Lisonbee
NOAA/National Integrated Drought Information System (NIDIS)
Erin Saffell
Arizona State Climatologist/Arizona State University
Erin Boyle
Service Hydrologist, National Weather Service, Tucson, Arizona
Peter Goble
Colorado Climate Center/Colorado State University
Jon Meyer
Utah Climate Center/Utah State University
Tony Bergantino
Water Resources Data System – Wyoming State Climate Office
Dave DuBois
New Mexico State Climatologist/New Mexico State University
This drought status update is issued in partnership between the National Oceanic and Atmospheric Administration (NOAA), and the offices of the state climatologist for Arizona, Colorado, New Mexico, Utah and Wyoming. The purpose of the update is to communicate a potential area of concern for drought expansion and/or development within the Intermountain West based on recent conditions and the upcoming forecast. NIDIS and its partners will issue future drought status updates as conditions evolve.