Extreme Heat Intensifies Drought Across Texas
Key Points
- A record-setting heatwave continues across most of Texas and Louisiana, intensifying drought and increasing wildfire activity.
- Austin, Texas enters stage 2 of its Drought Contingency Plan, extending further water restrictions to residents.
- Kansas and Oklahoma see drought conditions improve, but remain.
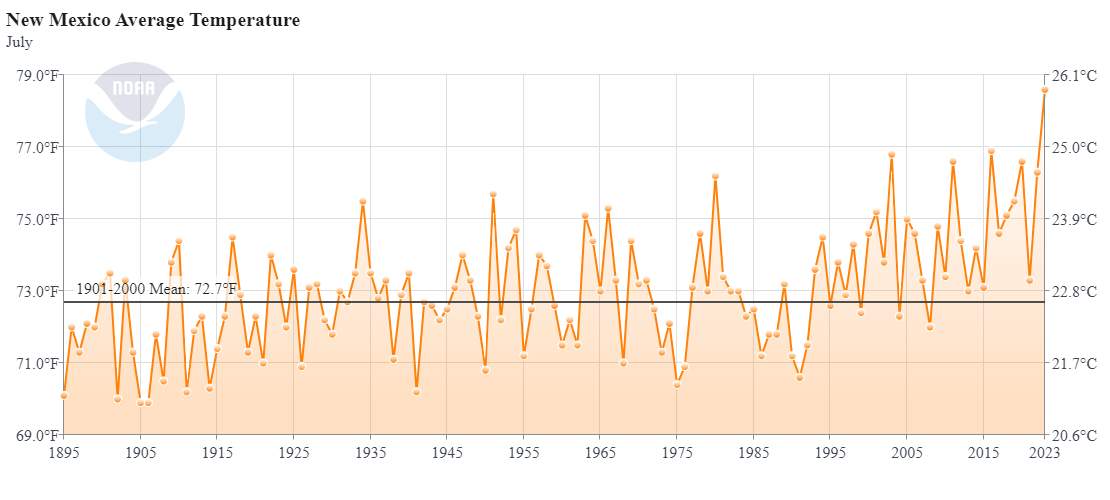
- New Mexico has the hottest July on record.
This map shows precipitation for the past 30 days as a percentage of the historical average (1991–2020) for the same time period.
Green/blue shades indicate above-normal precipitation, while brown shades indicate below-normal precipitation.
This map shows the average maximum daily temperature for the past 30 days compared to the historical average (1991–2020) for the same 30 days.
Negative values (blue hues) indicate colder than normal temperatures, and positive values (red hues) indicate warmer than normal temperatures.
Precipitation Shown as a Percentage of Normal Conditions
<25% of Normal
Precipitation was only 0% to 25% of the historical average for this location, compared to the same date range from 1991–2020.
25%–50% of Normal
Precipitation was 25% to 50% of the historical average for this location, compared to the same date range from 1991–2020.
50%–75% of Normal
Precipitation was 50% to 75% of the historical average for this location, compared to the same date range from 1991–2020.
75%–100% of Normal
Precipitation was 75% to 100% of the historical average for this location, compared to the same date range from 1991–2020.
100%–150% of Normal
Precipitation was 100% to 150% of the historical average for this location, compared to the same date range from 1991–2020.
150%–200% of Normal
Precipitation was 150% to 200% of the historical average for this location, compared to the same date range from 1991–2020.
200%–300% of Normal
Precipitation was 200% to 300% of the historical average for this location, compared to the same date range from 1991–2020.
>300% of Normal
Precipitation was greater than 300% of the historical average for this location, compared to the same date range from 1991–2020.
Departure from Normal Max Temperature (°F)
>8°F Below Normal
The average maximum temperature was more than 8°F colder than normal for this location.
6–8°F Below Normal
The average maximum temperature was 6–8°F colder than normal for this location.
4–6°F Below Normal
The average maximum temperature was 4–6°F colder than normal for this location.
3–4°F Below Normal
The average maximum temperature was 3–4°F colder than normal for this location.
1–3°F Below Normal
The average maximum temperature was 1–3°F colder than normal for this location.
0–1°F Below Normal
The average maximum temperature was 0–1°F colder than normal for this location.
0–1°F Above Normal
The average maximum temperature was 0–1°F warmer than normal for this location.
1–3°F Above Normal
The average maximum temperature was 1–3°F warmer than normal for this location.
3–4°F Above Normal
The average maximum temperature was 3–4°F warmer than normal for this location.
4–6°F Above Normal
The average maximum temperature was 4–6°F warmer than normal for this location.
6–8°F Above Normal
The average maximum temperature was 6–8°F warmer than normal for this location.
>8°F Above Normal
The average maximum temperature was more than 8°F warmer than normal for this location.
This map shows precipitation for the past 30 days as a percentage of the historical average (1991–2020) for the same time period.
Green/blue shades indicate above-normal precipitation, while brown shades indicate below-normal precipitation.
This map shows the average maximum daily temperature for the past 30 days compared to the historical average (1991–2020) for the same 30 days.
Negative values (blue hues) indicate colder than normal temperatures, and positive values (red hues) indicate warmer than normal temperatures.
Precipitation data are updated daily, with a delay of 3 to 4 days to allow for data collection and quality control.
Temperature data are updated daily, with a delay of 3 to 4 days to allow for data collection and quality control.
Recent Conditions
- Temperatures across Texas and New Mexico were 4 to 8 ºF above average—and 0 ºF to 3 ºF above average for Kansas and Oklahoma.
- On average, Texas receives 2.51 inches of rain in July, 2.73 inches of rain in August, and 3.48 inches of rain in September. This year the statewide average rainfall for July was only 1.3 inches—the second July in a row with a greater than 1-inch deficit.
- Persistently very high temperatures coupled with little to no rainfall over the summer have led to worsening drought conditions across central and southern Texas.
- Over the last two months, drought has expanded into Louisiana where wildfire activity has increased in response to the persistently hot and dry conditions.
July Temperatures
- New Mexico experienced its highest average monthly temperature since records began in 1895. The mean temperature for the month was 78.6 ºF, which is 5.9 ºF above the 20th-century average and 1.7 ºF above the previous record set in 2016.
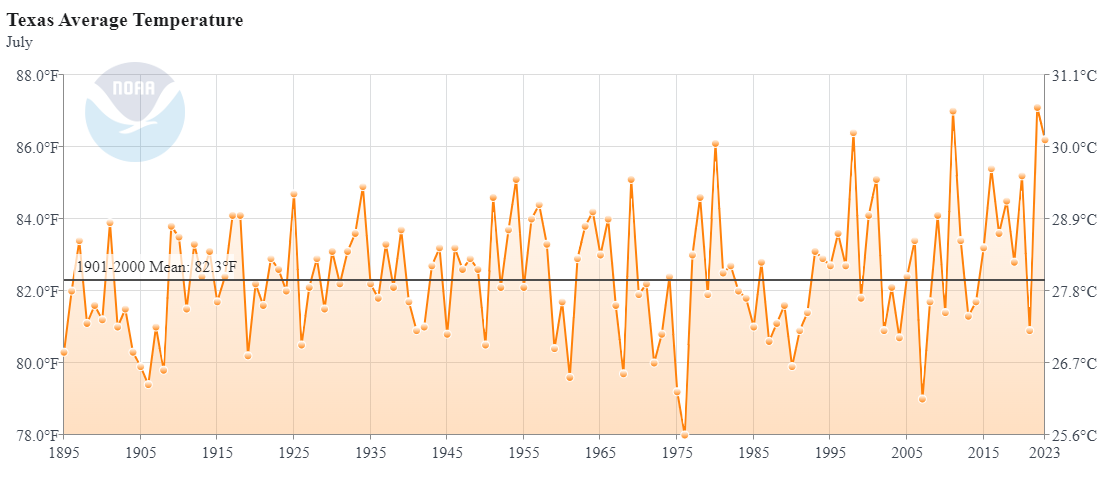
- Texas experienced its fourth warmest July and the fifth highest average monthly temperature of any month since records began in 1895. The mean temperature for July was 86.2 ºF, which is 3.9 ºF above the 20th-century July average but still 0.9 ºF below the record set last year in 2022.
- Kansas and Oklahoma both ended the month of July with near-average temperatures for the month overall.
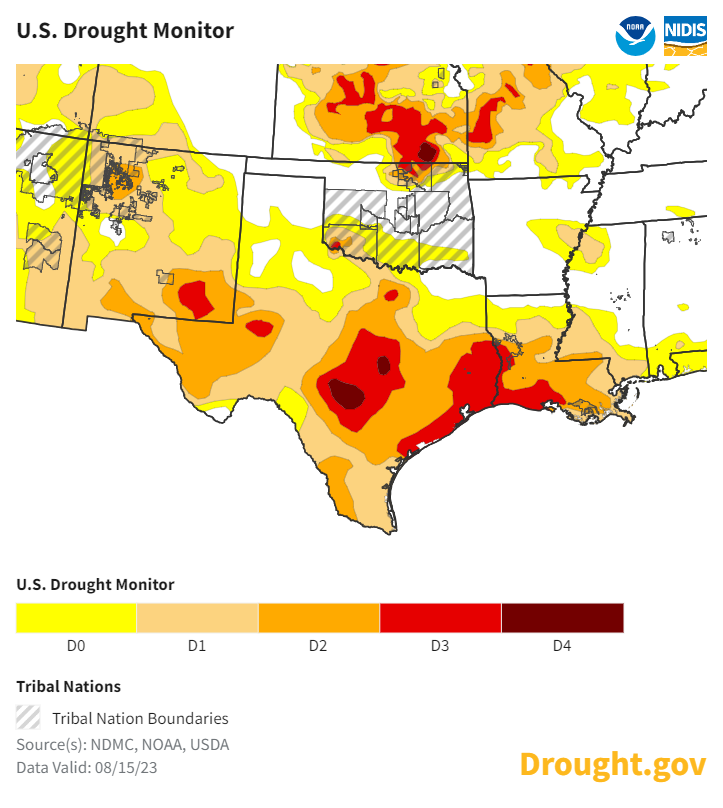
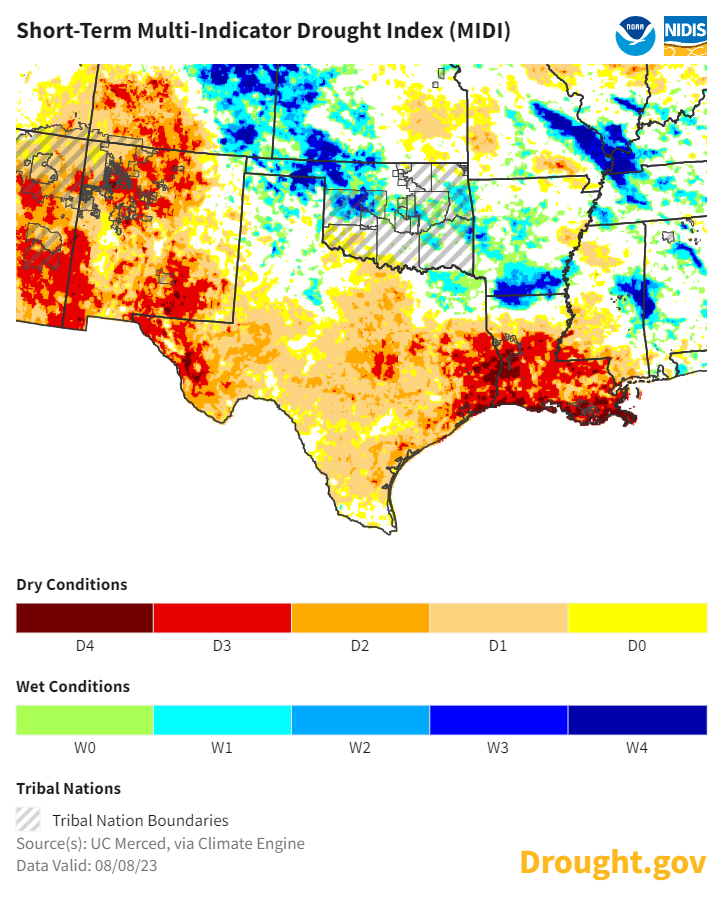
U.S. Drought Monitor
- 60% of the region is in drought (D1 or worse), a 5% decrease from 3 months ago.
- 13% of the region is experiencing Extreme (D3) drought or worse:
- Kansas—18% of the state
- New Mexico—3%
- Oklahoma—2%
- Texas—16%
- 1% of the region is experiencing Exceptional (D4) drought.
- Louisiana, while not in the Southern Plains DEWS region, has seen increasing drought and now has 77% of the state in D1 or worse and 15% of the state in D3 or worse.
- Extreme (D3) drought conditions have been in place in this region since August 2019.
- Moderate (D1) or worse drought has been in the region since June 2016.
U.S. Drought Monitor: August 15, 2023
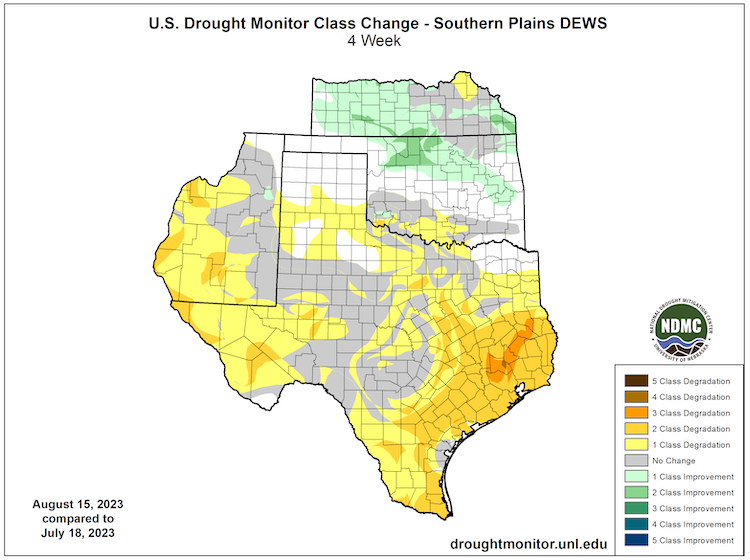
4-Week U.S. Drought Monitor Change Map
Multi-Indicator Drought Index: August 8, 2023
Forecasts and Seasonal Outlooks
September 2023 Outlook
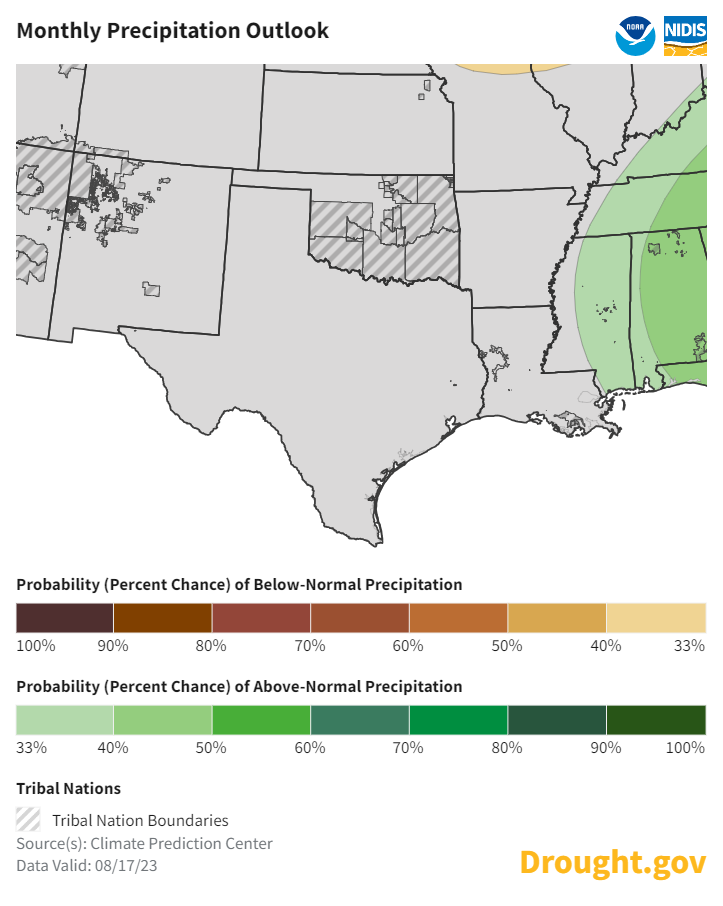
According to the Climate Prediction Center's monthly outlook for September:
- Temperature: There are increased odds of above-normal temperature for September for the Southern Plains.
- Precipitation: The outlook shows an equal chance of above- or below- normal precipitation for the Southern Plains for September.
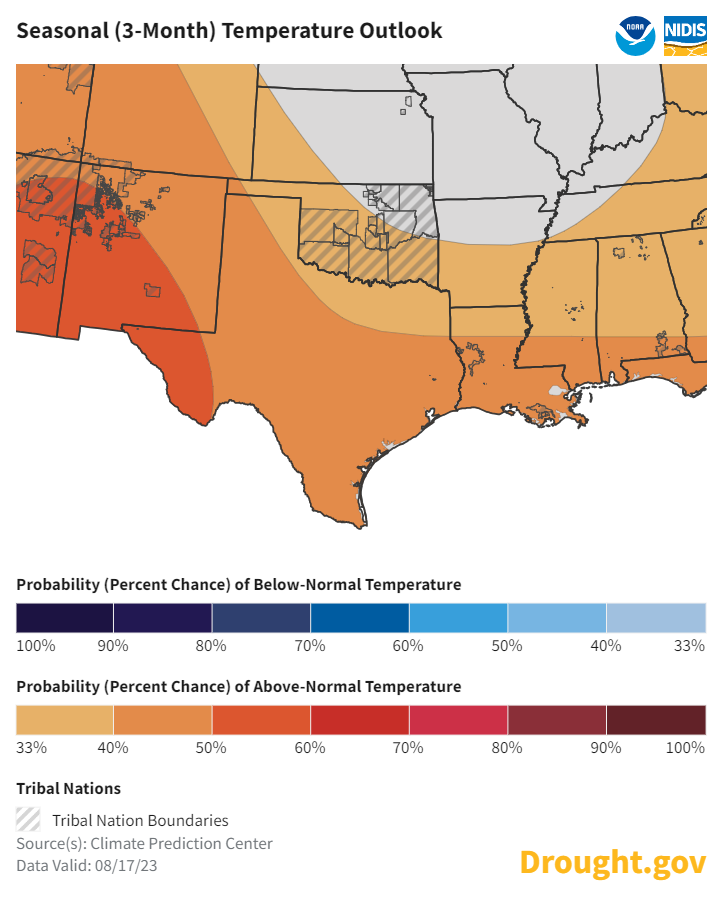
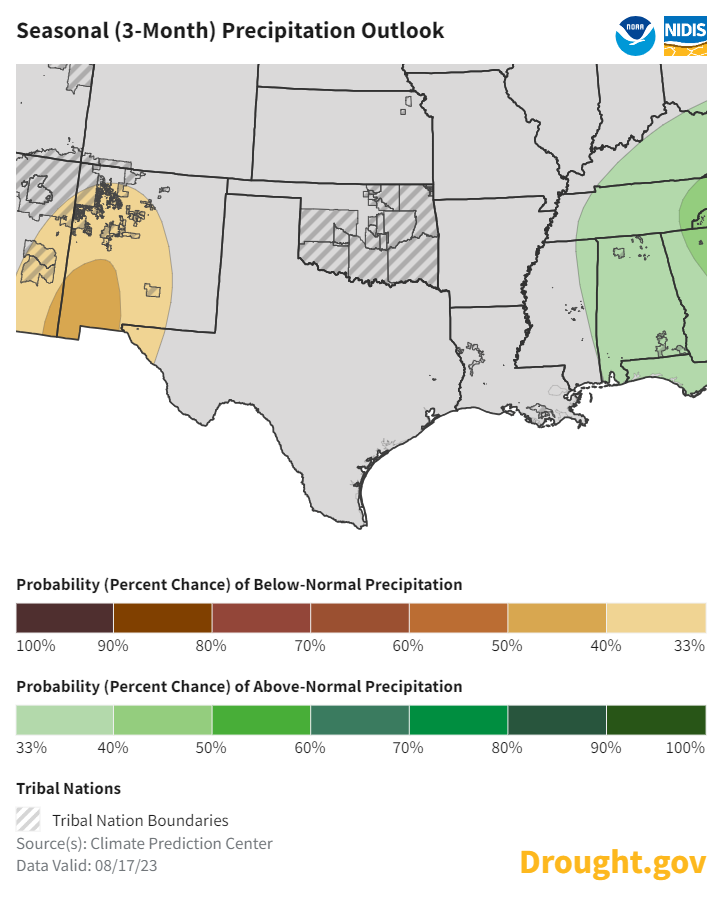
3-Month Outlook for Fall: September–November 2023
Seasonal outlooks for September–November 2023 show a warmer season ahead for the Southern Plains. There is a near-equal chance of above- or below-normal precipitation for the season.
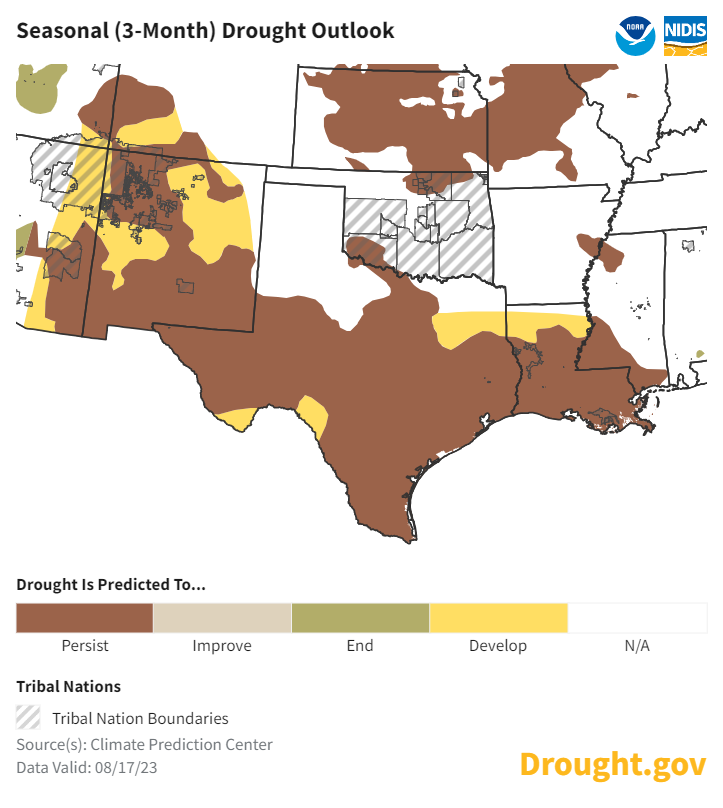
Seasonal Drought Outlook for September–November 2023
Drought is forecast to persist in Kansas and Oklahoma and persist and develop across some of Texas and most of New Mexico from September to November 2023.
Texas Impacts
- After months of very hot, dry conditions, fuels are very dry, and in many areas Energy Release Component is at an all-time high for this time of year. As a result, wildfire activity has increased significantly over the past month, particularly over central and eastern portions of the state. Over the past month, 167 wildfires totaling nearly 11,000 acres burned were reported by the Texas A&M Forest Service. Above-normal wildfire activity is likely to continue over the same regions into September, per the National Interagency Coordination Center.
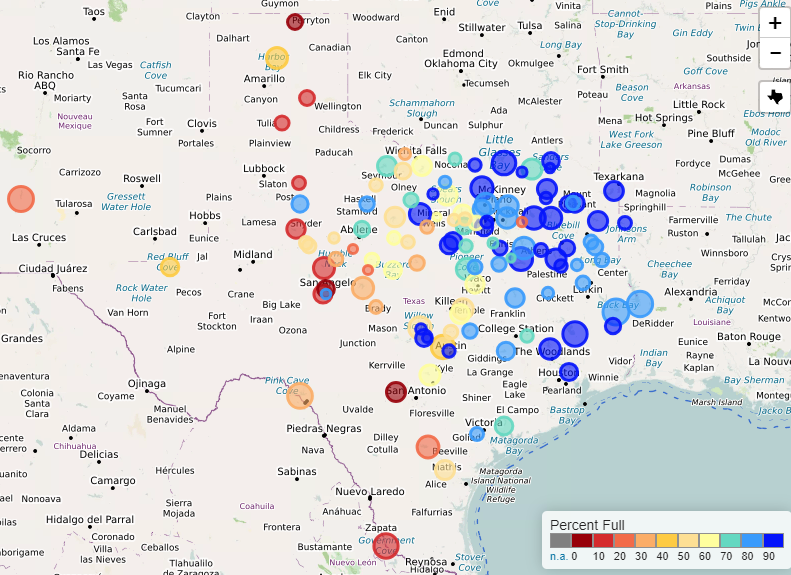
- Water storage has decreased across the state, and reservoirs are now 70.9% full. This is more than 10% below the median value for this time of year, but remains higher than at this time last year.
Texas Reservoir Levels
Southern Plains Drought in the News
- The Texas Tribune: Gov. Greg Abbott declares wildfire disaster for three-fourths of Texas
- Fox Weather: Ongoing flash drought increases wildfire concerns in Texas
- Chron: City of Katy limits residents' water usage as drought conditions set in
- San Antonio Express-News: Austin begins Stage 2 water restrictions amid worsening Texas drought
- KPRC2, Houston: Several cities in Houston area ask residents, businesses to limit water usage to avoid shortage during drought
- KERA News: High wildfire danger persists in Texas amid ongoing, scorching temperatures
- KENS 5 News: Bexar County issues burn ban – effective immediately – due to severe drought
- New York Times: First Scorched, Then Soaked: Weather Whiplash Confounds Farmers
- AgWeb: Drought No More, Farmers Watch Western Kansas Corn Fields Get Hammered by Hail
For More Information
- NIDIS and its partners will issue future drought status updates as conditions evolve.
- More local information is available from the following resources:
Prepared By
Joel Lisonbee,
NOAA’s National Integrated Drought Information System, Southern Plains Drought Early Warning System; CIRES/CU Boulder
Kelsey Satalino, Adam Lang, and Eleanor Hasenbeck
NOAA’s National Integrated Drought Information System, Communications; CIRES/CU Boulder
Keith White
National Weather Service
This drought status update is issued in partnership between the National Oceanic and Atmospheric Administration (NOAA) and the offices of the state climatologist for Texas, Oklahoma, New Mexico, and Kansas. The purpose of the update is to communicate a potential area of concern for drought expansion and/or development within the Southern Plains based on recent conditions and the upcoming forecast. NIDIS and its partners will issue future drought updates as conditions evolve.
