Drought Persists in the Western Intermountain West; Dry Winter More Likely Amid La Niña
Key Points
- Start of Water Year 2026: Leading up to the start of Water Year (WY) 2026, drought conditions improved across the eastern Intermountain West, but drought expanded and intensified across western areas of the region. Storage for Lake Powell and Lake Mead reached a 30-year low for the date as of October 25, 2025.
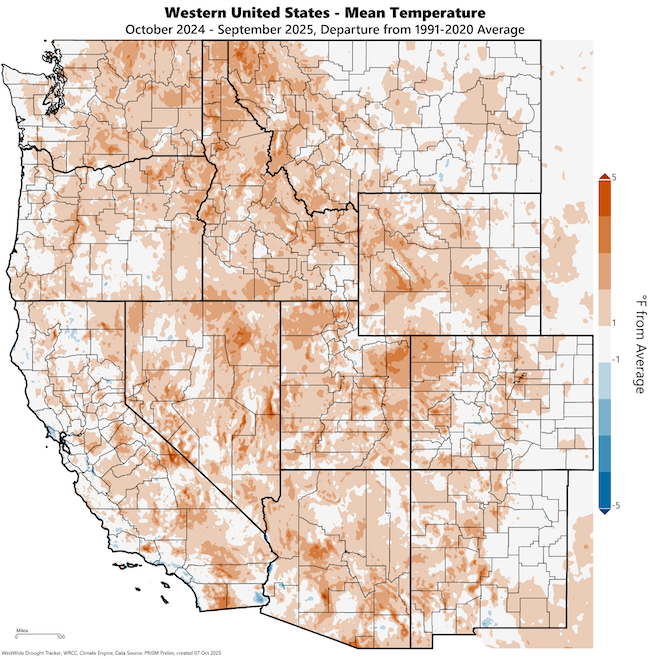
- Water Year 2025: Precipitation was lower than average in western portions of the region, and greater than average in eastern parts of Colorado, New Mexico, and Wyoming. Much of the Intermountain West experienced warmer-than-average temperatures.
- Water Year 2025 Impacts: Hot and dry conditions led to large fires in several states. Lack of precipitation, early snowmelt, and warm spring temperatures harmed crop production and forage in many areas.
- La Niña Winter Ahead: La Niña conditions are present and favored to continue into early winter. La Niña typically brings warmer and drier winter conditions to the southern region of the Intermountain West. A transition to El Niño-Southern Oscillation (ENSO) neutral is favored for the January-March 2026 time frame. Neutral conditions mean neither El Niño or La Niña are influencing weather patterns.
This update is based on data available as of Thursday, November 20, at 7 a.m. MT. We acknowledge that conditions are evolving.
Conditions at the Start of Water Year 2026
- The start of the new water year (beginning October 1, 2025) brought intense rainstorms and flooding in parts of Utah, Arizona, New Mexico, and Colorado. However, due to warmer-than-average temperatures, combined with lower-than-average precipitation across Water Year 2025, much of the region still remains in drought, according to the U.S. Drought Monitor.
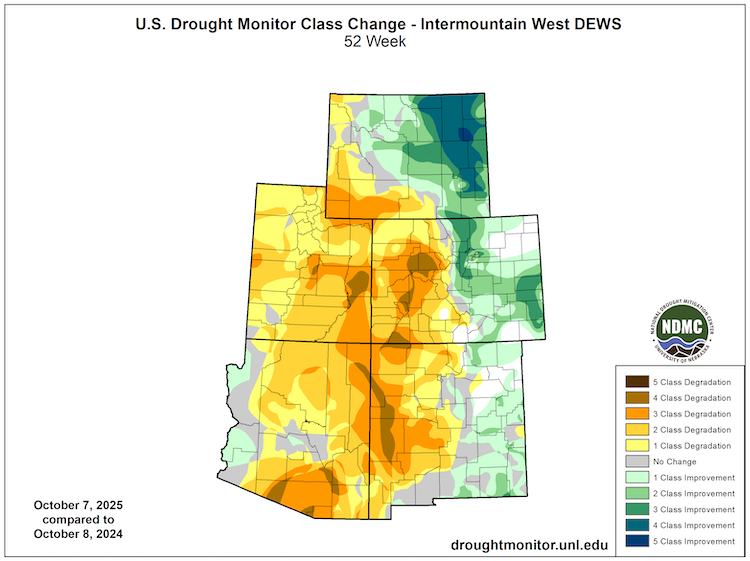
- At the start of Water Year 2026, drought conditions were split across the Continental Divide, with no drought in much of the eastern extent of the Intermountain West region. Over Water Year 2025, drought conditions persisted or intensified across western portions of Colorado, Wyoming, and New Mexico, as well as statewide across Arizona and Utah.
- Flaming Gorge Reservoir started Water Year 2026 at near-average storage levels, but many other reservoirs remained below average, including Lake Mead, Lake Powell, and Elephant Butte Reservoir. Greater-than-average runoff is needed to increase reservoir levels next spring.
- Moving into winter, soil moisture levels are better than they were in November 2024, with root zone soil moisture in headwater basins for the Upper Colorado River and the Rio Grande River experiencing a mix of wetter-than-average conditions at some locations and drier than-average conditions at others, according to both SPoRT-LIS modeled data and SNOTEL station data.
- Storage is below average for most Bureau of Reclamation–managed reservoirs in the headwaters of the Upper Colorado River Basin. As of November 18, 2025, Lake Powell is at 44% of typical storage, the lowest observed level for this date in the last 30 years.
- Storage is also below average for Elephant Butte Reservoir in the Rio Grande Basin, at 11% of average as of November 18, 2025.
- With La Niña conditions anticipated to persist from December to February, snowpack is more likely to be lower than average during these months. However, all La Niñas differ, and there is uncertainty around how this season will play out. La Niña conditions are expected to weaken into El Niño-Southern Oscillation (ENSO) neutral conditions from January to March 2026.
Water Year 2025 Brings a Mix of Drought Degradation and Recovery
November 2025 Reservoir Storage Levels
| Reservoir | State | November 18, 2025 Level (acre-feet) | November 18, 2025 Level (Percent of Average) |
|---|---|---|---|
| Lake Powell - Glen Canyon Dam | Arizona | 6,722,800 | 43.8% |
| Lake Havasu - Parker Dam | Arizona | 534,127 | 94.7% |
| Lake Mohave - Davis Dam | Nevada/Arizona | 1,661,740 | 111.4% |
| Lake Mead - Hoover Dam | Nevada | 8,211,440 | 51.3% |
| Flaming Gorge Reservoir | Wyoming | 2,993,390 | 94.7% |
| Blue Mesa Reservoir | Colorado | 397,572 | 70.3% |
| McPhee Reservoir | Colorado | 184,449 | 72.2% |
| Navajo Reservoir | New Mexico | 989,113 | 76.0% |
| Elephant Butte Dam | New Mexico | 89,533 | 11% |
Lake Powell’s storage declined over Water Year 2025. While Lake Mead’s storage at the end of Water Year 2025 was similar to Water Year 2024, both years had low reservoir levels, with storage near only 50% of average. Source: U.S. Bureau of Reclamation, Interactive Reservoir Dashboard.
Intermountain West Water Year 2025 Summary
- Water Year 2025 (October 1, 2024–September 30, 2025) brought varied drought conditions to the Intermountain West. Drought largely worsened west of the Continental Divide and improved to the east of the Continental Divide.
- Drought intensified and spread in Utah, Arizona, and western portions of Colorado, Wyoming, and New Mexico. Over the summer, portions of western Colorado and the southern border of Arizona and New Mexico reached Exceptional Drought (D4), according to the U.S. Drought Monitor.
- Above-average temperatures (+ 1-3 ºF) were widespread across the region in Water Year 2025, with some isolated areas being even hotter.
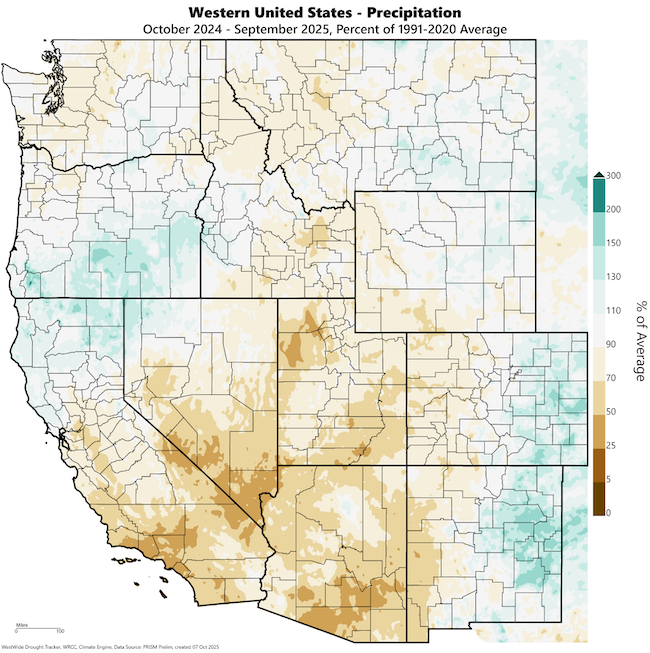
- Water year precipitation for the region was variable, with a wet-dry split along the Continental Divide. The Southwest Monsoon season was slow to start this year, but precipitation ramped up at the end of August for Colorado, Arizona, and New Mexico. Utah had a weaker than usual summer rain season, and Salt Lake City experienced its fourth driest summer on record.
- Utah: Total water year precipitation was below average across the entire state in 2025. The driest areas were in the south-central region of the state, and in Juab and Tooele Counties in Western Utah. Water Year 2025 was among the top five driest years on record for many portions of the state.
- Arizona: Arizona received lower-than-average precipitation. Stations in some southeastern counties measured total water year precipitation among the lowest 10% on record, with some counties recording their 5th driest water year on record. August 2025 was the 16th driest August on record for the state. Yuma County was the only area with above-average precipitation, with the 9th wettest August on record for the county.
- Colorado: Precipitation conditions were split between western and eastern Colorado. The western side of the state saw total water year precipitation between 50-90% of average. The eastern side of the state was unusually wet. Parts of Lincoln and Kit Carson Counties received over 130% of average precipitation.
- New Mexico: Water year precipitation followed a diagonal split across the state. Temperatures were warmer than average for two-thirds of the state, and near average in counties to the northeast. The western and southern areas were drier than average (50-80% of average), and the eastern half of the state was wetter than average (100-150%). Hidalgo, Grant, and Catron Counties experienced the driest water year conditions in the state. Meanwhile, multiple counties on the eastern side of the state received 130-150% of average precipitation.
- Wyoming: Total water year precipitation varied across Wyoming, ranging from 50-70% of average in parts of Sweetwater County to 120-130% of average in Converse County. Much of the state received 80-100% of average precipitation.
- April 1, 2025 snow water equivalent (SWE) was 81-96% of average for many headwater basins in the Upper Colorado, but runoff efficiency was low and yielded below-average streamflows in many reaches. The Colorado Climate Center attributed low runoff efficiency to early snowmelt and below-average spring snowfall. April 1, 2025 snowpack was much lower than average for the headwaters of the Rio Grande basin, located in southern Colorado, with SWE at ~56% of average for the basin.
- Dry conditions and high evaporative demand led to several large fires in the Intermountain West during the 2025 fire season, including the 145,000+-acre Dragon Bravo Fire in Arizona and 137,758-acre Lee Fire in Colorado (5th largest fire in Colorado history).
Near- to Below-Average Precipitation West of the Continental Divide
Above-Average Water Year Temperatures for Most of the Intermountain West
Water Year 2025 Impacts
- High evaporative demand, warmer-than-usual temperatures, lower-than-usual precipitation, and dry soils contributed to dry fuel conditions and large fires across many parts of the Intermountain West. Across the region, earlier snowmelt and warm temperatures led to longer-than-usual fire seasons.
- Wildfire impacts across the Intermountain West varied by state during Water Year 2025. Arizona and Colorado experienced record-breaking fires, including the 145,000+ acre Dragon Bravo Fire in Grand Canyon National Park and 137,000 acre Lee Fire–Colorado’s 5th largest wildfire on record. Meanwhile in Wyoming, the number of wildfire incidents increased, but acres burned decreased compared to Water Year 2024.
- By April 2025, conditions were so dry in Utah that the governor declared a drought emergency.
- Dry conditions, early snowmelt, and warm spring temperatures negatively impacted crop production in portions of all states across the Intermountain West. Poor forage conditions likewise harmed grazing in many areas, leading to curtailed grazing seasons or herd reductions.
La Niña Outlook
- As of November 17, 2025, La Niña conditions are present and expected to continue through December to February, with a transition to El Niño Southern Oscillation–neutral conditions likely from January to March.
- Every La Niña is different. For the Southwestern U.S., La Niña is typically associated with a greater statistical likelihood of warmer, drier conditions during winter months.
- Other variables also influence winter precipitation, and not all La Niñas are associated with below-average winter precipitation in the Intermountain West.
A Weak La Niña Is Here, ENSO-Neutral Forecast Early Next Year
Additional Resources by State
- More local information is available from the following resources:
- Your state climatologist
- Your state page on Drought.gov:
- National Weather Service Drought Information Statements:
- November 7, 2025: Riverton, Wyoming Weather Forecast Office
- November 4, 2025: Salt Lake City, Utah Weather Forecast Office
- November 3, 2025: El Paso, Texas/Santa Teresa, New Mexico Weather Forecast Office
- Western Water Assessment 2025 Water Year Summary
- More state information is available from the following resources:
- Arizona: Interactive Drought Dashboard; State Climate Office
- California: California Water Watch; California Department of Water Resources - Drought; California State Climatologist
- Colorado: Water Conditions Monitoring Committee; Colorado Climate Center Drought Dashboard
- Nevada: Living with Drought in Nevada; Nevada Division of Water Resources - Drought; State Climate Office
- New Mexico: Office of the State Engineer, Drought page; New Mexico Climate Center
- Utah: Department of Natural Resources, Drought page; Utah Climate Center
- To report or view local drought impact information:
Prepared By
Elise Osenga
University of Colorado Boulder/Cooperative Institute for Research in Environmental Sciences (CIRES), NOAA/National Integrated Drought Information System (NIDIS)
Meredith Muth
NOAA National Integrated Drought Information System (NIDIS)
Erinanne Saffell
Arizona State Climate Office, Arizona State University
Dave Simeral
Desert Research Institute, Western Regional Climate Center
Jon Meyer
Utah Climate Center, Utah State University
Paul Miller
Colorado River Basin Forecast Center, National Weather Service
This Drought Status Update was issued in partnership between the National Oceanic and Atmospheric Administration (NOAA)/National Integrated Drought Information System (NIDIS) and partners across the Intermountain West. NIDIS is an interagency program within the Climate Program Office, which is part of NOAA's Office of Oceanic and Atmospheric Research.


