Vegetation Drought Response Index (VegDRI)
National Drought Mitigation Center (NDMC), USGS National Center for Earth Resources Observation and Science (EROS), High Plains Regional Climate Center (HPRCC)
The National Drought Mitigation Center (NDMC) produces VegDRI in collaboration with the US Geological Survey's (USGS) Center for Earth Resources Observation and Science (EROS), and the High Plains Regional Climate Center (HPRCC). Main researchers working on VegDRI are Dr. Brian Wardlow, with the Center for Advanced Land Management Information Technologies (CALMIT), and Dr. Tsegaye Tadesse at the NDMC, and Jesslyn Brown with the USGS. NDMC and CALMIT are both based in the School of Natural Resources at the University of Nebraska-Lincoln. VegDRI was developed with sponsorship from the US Geological Survey (USGS), the US Department of Agriculture's (USDA) Risk Management Agency (RMA) and from NASA. Continued operational production of VegDRI is supported by the USGS.
VegDRI maps are produced every two weeks and provide regional to sub-county scale information about drought's effects on vegetation. In 2006, VegDRI covered seven states in the Northern Great Plains (CO, KS, MT, NE, ND, SD, and WY). It expanded across eight more states in 2007 to cover the rest of the Great Plains (NM, OK, MO, and TX) and parts of the Upper Midwest (IA, IL, MN, and WI). VegDRI expanded to include the western U.S. in 2008 (WA, ID, OR, UT, CA, AZ, NV). In May 2009 VegDRI began depicting the eastern states as well, covering the entire conterminous 48-state area.
The VegDRI calculations integrate satellite-based observations of vegetation conditions, climate data, and other biophysical information such as land cover/land use type, soil characteristics, and ecological setting. The VegDRI maps that are produced deliver continuous geographic coverage over large areas, and have inherently finer spatial detail (1-km2 resolution) than other commonly available drought indicators such as the U.S. Drought Monitor.
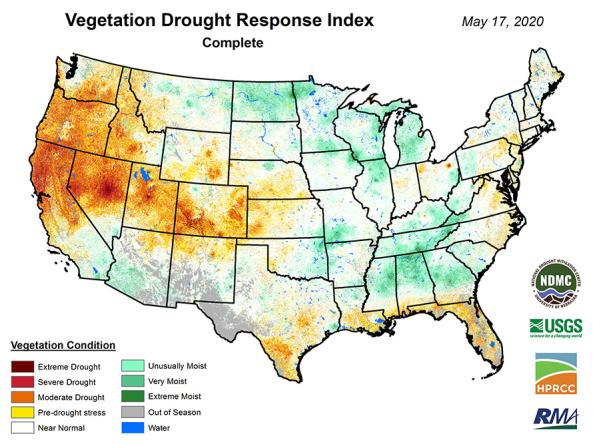
The Vegetation Drought Response Index (VegDRI) is a weekly depiction of drought's effects on vegetation stress across the contiguous United States. Yellow/red hues indicate drought conditions, while green hues indicate moist conditions.
The map incorporates satellite observations of vegetation conditions, climate data, and environmental characteristics (e.g., land cover, land use, soil type).
A drought index combines multiple drought indicators (e.g., precipitation, temperature, soil moisture) to depict drought conditions. For some products, like the U.S. Drought Monitor, authors combine their analysis of drought indicators with input from local observers. Other drought indices, like the Standardized Precipitation Index (SPI), use an objective calculation to describe the severity, location, timing, and/or duration of drought.
Learn MoreFlash drought is the rapid onset or intensification of drought. Unlike slow-evolving drought, which is caused by a decline in precipitation, flash drought occurs when low precipitation is accompanied by abnormally high temperatures, high winds, and/or changes in radiation. These sometimes-rapid changes can quickly raise evapotranspiration rates and remove available water from the landscape.
Learn MoreDrought can alter the ecological balance of natural systems and harm fish, wildlife, and plant species, as well as the benefits that these ecosystems provide to human communities. The environmental consequences of drought include losses in plant growth; increases in fire and insect outbreaks; altered rates of carbon, nutrient, and water cycling; and local species extinctions.
Learn MoreDrought can result in reduced growth rates, increased stress on vegetation, and alterations or transformations to the plant community and/or the entire ecosystem. During periods of drought, plants increase their demand for water through increased evapotranspiration and longer growing seasons.
Learn MoreVegetation Conditions
The Vegetation Drought Response Index (VegDRI) is a weekly depiction of drought's effects on vegetation stress across the contiguous United States. Yellow/red hues indicate drought conditions, while green hues indicate moist conditions.
The map incorporates satellite observations of vegetation conditions, climate data, and environmental characteristics (e.g., land cover, land use, soil type).
VegDRI data are updated weekly.
A drought index combines multiple drought indicators (e.g., precipitation, temperature, soil moisture) to depict drought conditions. For some products, like the U.S. Drought Monitor, authors combine their analysis of drought indicators with input from local observers. Other drought indices, like the Standardized Precipitation Index (SPI), use an objective calculation to describe the severity, location, timing, and/or duration of drought.
Learn MoreFlash drought is the rapid onset or intensification of drought. Unlike slow-evolving drought, which is caused by a decline in precipitation, flash drought occurs when low precipitation is accompanied by abnormally high temperatures, high winds, and/or changes in radiation. These sometimes-rapid changes can quickly raise evapotranspiration rates and remove available water from the landscape.
Learn MoreDrought can alter the ecological balance of natural systems and harm fish, wildlife, and plant species, as well as the benefits that these ecosystems provide to human communities. The environmental consequences of drought include losses in plant growth; increases in fire and insect outbreaks; altered rates of carbon, nutrient, and water cycling; and local species extinctions.
Learn MoreDrought can result in reduced growth rates, increased stress on vegetation, and alterations or transformations to the plant community and/or the entire ecosystem. During periods of drought, plants increase their demand for water through increased evapotranspiration and longer growing seasons.
Learn MoreHow to
What can I do with these data?
- View and compare weekly vegetation stress across the contiguous United States.
How do I use the site?
- Useing the drop-down menu, view Vegetation Drought Response Index maps for Rangeland, Crops, or the Complete Contiguous United States.
- View change maps, time-series, or archived maps using the using the tabs at the top of the page.
- All map products offer image download options: to download, select the “.PNG,” “.PDF” or “.JPG” icon at the bottom of each map.
Access
Vegetation Drought Response Index (VegDRI) maps: home page for the Vegetation Drought Response Index
Archived VegDri maps: to view/download previous VegDRI maps