U.S. flag

An official website of the United States government

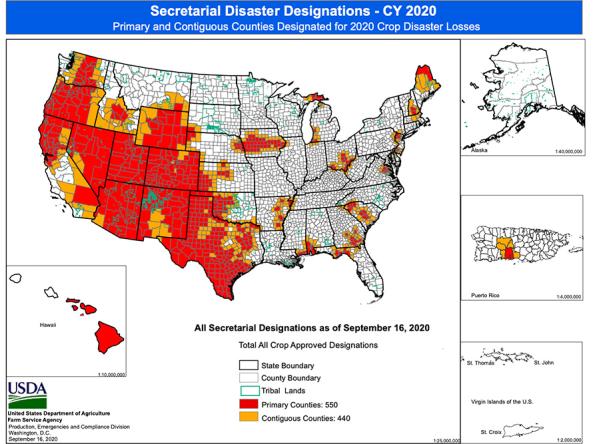
Maps displaying counties declared primary (red) or contiguous (orange) disaster counties by the Secretary of Agriculture.

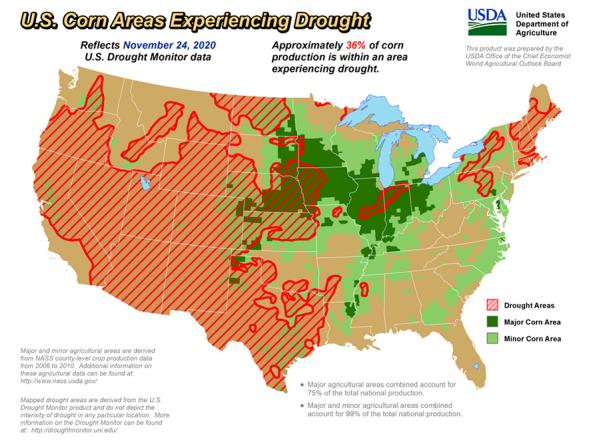
The U.S. Department of Agriculture produces weekly maps and charts displaying locations and percentages of drought-affected areas corn, soybeans, hay, cattle, and winter wheat. 

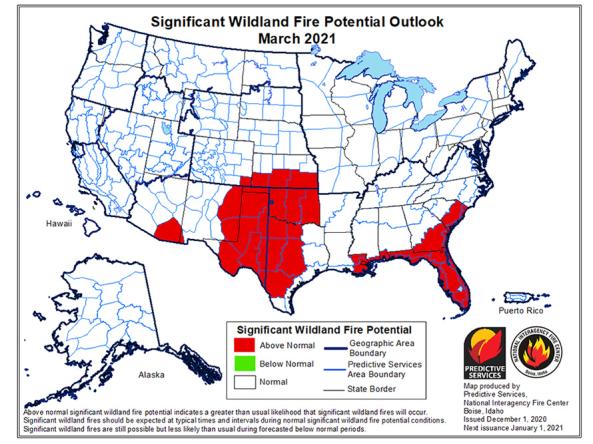
The National Significant Wildland Fire Potential Outlook is intended as a decision support tool for wildland fire managers, providing an assessment of current weather and fuels condition

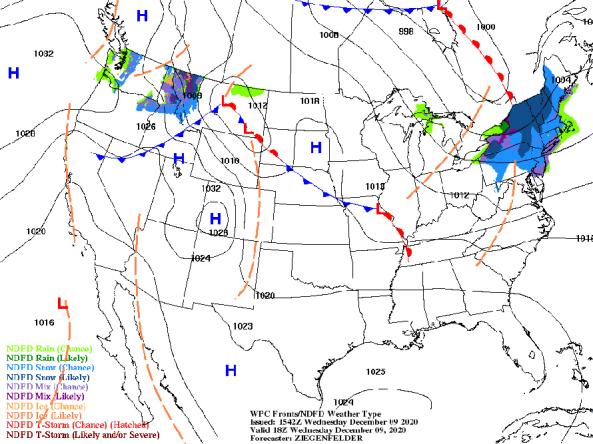
NWS provides a wide selection of forecast maps for temperature and precipitation for the next 12 hours to 6 days.

NOAA Quarterly Climate Impacts and Outlooks Reports: two-page reports on regional climate impacts with an overview of recent and forecast conditions produced by NOAA.

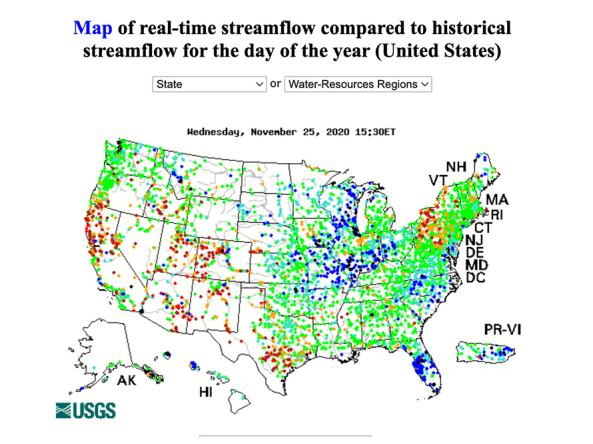
WaterWatch is a U.S. Geological Survey (USGS) World Wide Web site that displays maps, graphs, and tables describing real-time, recent, and past streamflow conditions for the United States.

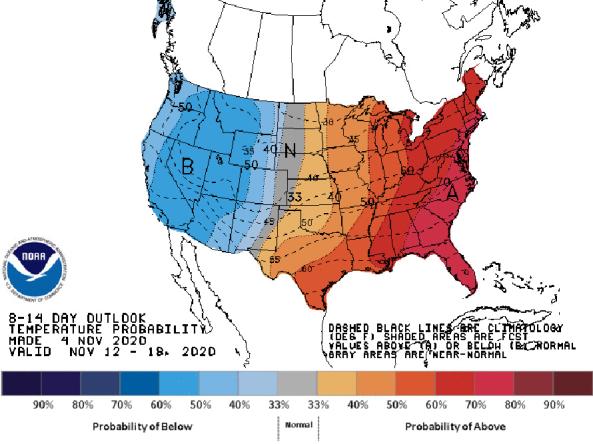
National Weather Service (NWS) Climate Prediction Center (CPC) generates outlooks that view probabilities of above- or below-normal temperature and precipitation maps at the 6-10 Day, 8-14 Day, Wee

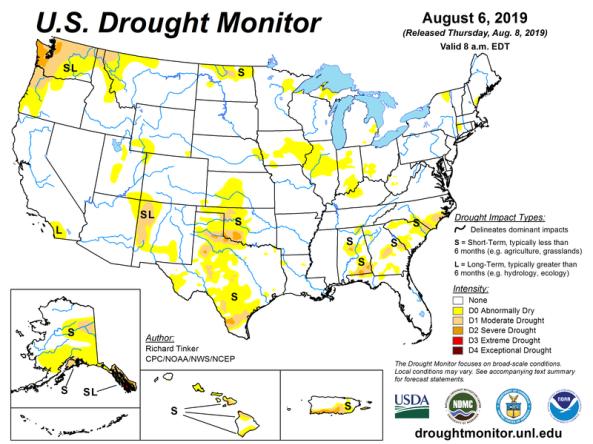
National Weather Service Local Drought Information Statements

NOAA and its partners publish regional reports each quarter, summarizing weather, impacts and predictions.

Subscribe to Southern Plains