U.S. flag

An official website of the United States government

DATA & MAPS

Select categories to browse data

Looking to Download Data? The Drought.gov team reformats data from multiple partners into web- and GIS-ready formats, which we use throughout Drought.gov. These data are free for all to download.
Search Results(28)

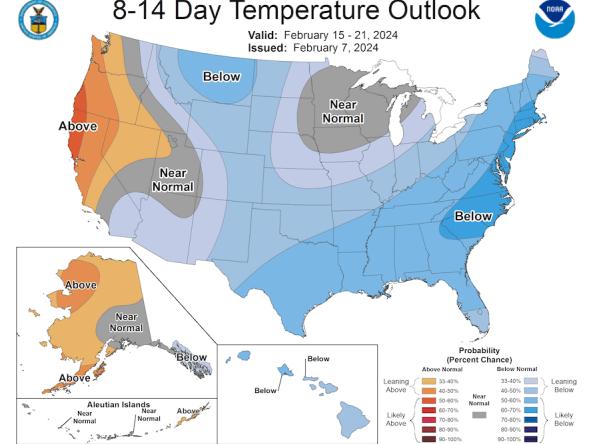
The Climate Prediction Center (CPC) produces temperature and precipitation outlooks for the U.S., including 6-10 day, 8-14 day, monthly, and seasonal outlooks.

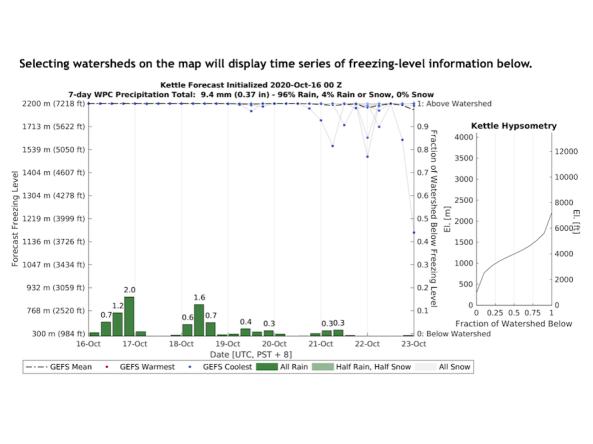
The Center for Western Weather and Water Extremes (CW3E) uses Global Ensemble Forecast System forecasts to show the evolution of the freezing level above, within, or below a watershed's terrain (that is, forecast near-surface temperatures being above or below freezing, and precipitation falling as rain or snow).

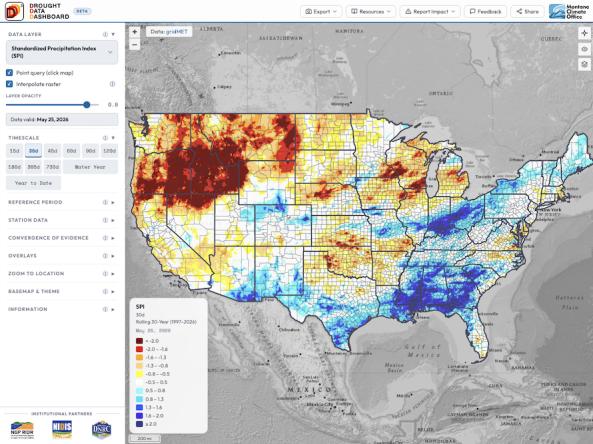
The Drought Data Dashboard, or D³, is an interactive mapping tool that allows users to view, analyze, and customize the display of key drought indices and climate variables across the contiguous U.S. 

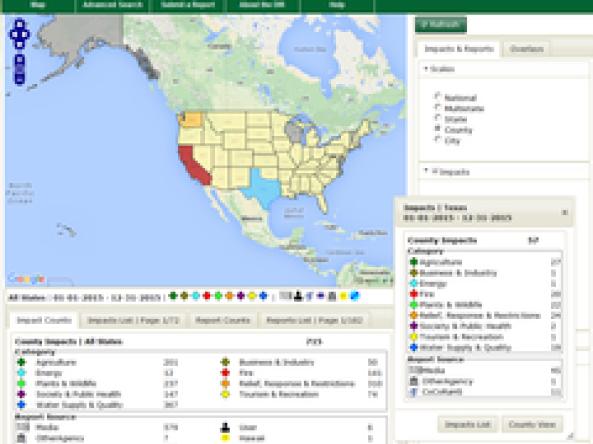
Drought Impacts Reporter (DIR): an interactive database of drought impacts in the U.S., by location, data, type, and cost built from stakeholder, government, media and other reports.