D3: Drought Data Dashboard
Montana Climate Office
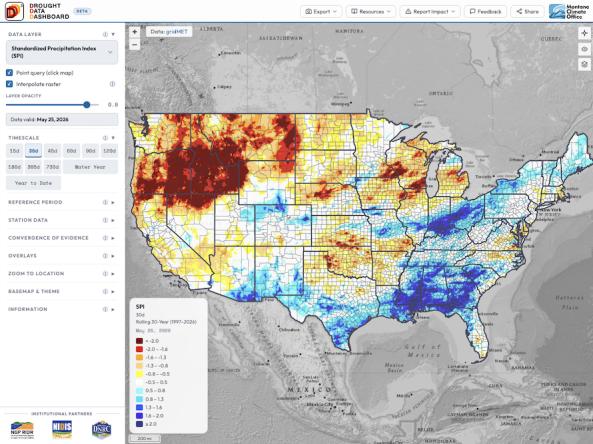
The Drought Data Dashboard, or D³, is an interactive mapping tool that allows users to view, analyze, and customize the display of key drought indices and climate variables across the contiguous U.S. The dashboard features gridded drought metrics—including the Standardized Precipitation Index, Standardized Precipitation Evapotranspiration Index, Evaporative Demand Drought Index, and Standardized Vapor Pressure Deficit Index—as well as measures of precipitation, temperature, vapor pressure deficit, snowpack, streamflow, and vegetation health. Global Historical Climatology Network (GHCN)station data and U.S. Geological Survey streamgage data are also available.
All datasets are calculated daily and may be aggregated by watershed, state, tribal land area, and county boundaries. Users can select from a variety of timescales for each data layer, set the climatological reference period, and even create custom blends of multiple drought indices. The dashboard’s export features allow users to download map images and raster data for their selected data layers.
Created by the Montana Climate Office, D³ is an expansion of the Upper Missouri River Basin Drought Indicators Dashboard. The Dashboard is a collaboration across academic, state, and federal drought monitoring programs
Access
How To
- Customize a Map Layer:
- Use the “Data Layer” dropdown on the left sidebar to select a drought metric or climate variable to display on the interactive map.
- Under “Timescale,” choose the time window over which your selected variable is calculated. Choose from 15-day to 730-day timescales, or view data for the calendar year or water year to date.
- Under “Reference Period,” select the reference period for your selected variable:
- Rolling 30-Year: Compares current conditions to the most recent 30 years of data.
- Climate Normal: Compares current conditions to conditions from 1991-2020, the World Meteorological Organization standard fixed reference period.
- Full Period: Compares current conditions to all available historical data for the selected variable.
- Under “Station Data,” you can choose to add station data overlaid on top of your gridded dataset: GHCN weather station data or U.S. Geological Survey streamflow percentiles.
- Under “Overlays,” select options to overlay geographic boundary lines (watershed, state, tribal county) or the U.S. Drought Monitor.
- You can also change the basemap, adjust layer transparency, and zoom the map to CONUS or a specific state.
- Convergence of Evidence: This feature composites multiple drought indices into a single map. Click “+ Add Layer” and select a drought index and timescale for each layer. Then, select the reference period you’d like to use and the method (median, mean or mode) and click “Compute Composite.” Check the box for “custom weights” to add custom weighting to individual indices.
- Point Query: Click anywhere on the map to see the exact data value and color at that location. You can toggle this feature on and off by checking the “Point Query” box in the left sidebar.
- Export and Share Maps:
- Click the “Export” button in the top menu to download a high-resolution PNG of the current map view or to download raster data.
- Click the “Share” button at the top for a URL that will preload your current map view (including variable, reference period, timescale, and map position), making it easy to share.
- Data Information and Access, code availability and tips:
- Click “Resources” to:
- Read detailed documentation on how the gridded and station drought indices are calculated and which data sources are used.
- Investigate links to data files for drought indices and SNODAS snowpack data used in the tool.
- Navigate to the code for the front end dashboard and backend data pipeline.
- Find tips and other helpful information on how to use the Dashboard. You can also click the “i” icons throughout the Dashboard to learn more about specific features.
- Click “Resources” to:
Documentation and Metadata