U.S. flag

An official website of the United States government

DATA & MAPS

Select categories to browse data

Looking to Download Data? The Drought.gov team reformats data from multiple partners into web- and GIS-ready formats, which we use throughout Drought.gov. These data are free for all to download.
Search Results(191)

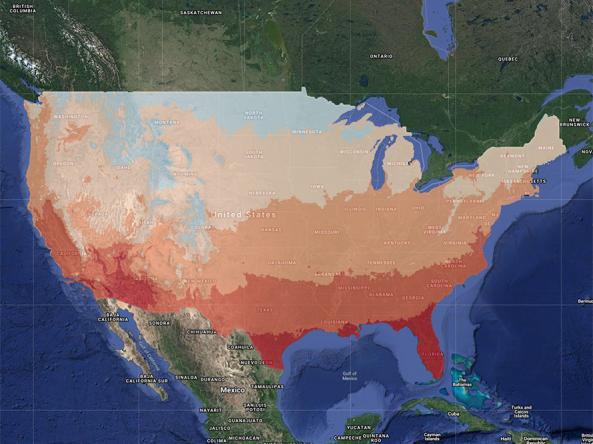
The nClimGrid-monthly dataset is a gridded dataset derived from spatially interpolating data from the Global Historical Climatology Network (GHCN), including precipitation (monthly totals) and temperature (monthly average, minimum and maximum), from 1895 to the present.

gridMET is a gridded dataset of daily high-spatial resolution (~4-km, 1/24th degree) surface meteorological data using PRISM and NLDAS-2, covering the contiguous U.S. from 1979-present.

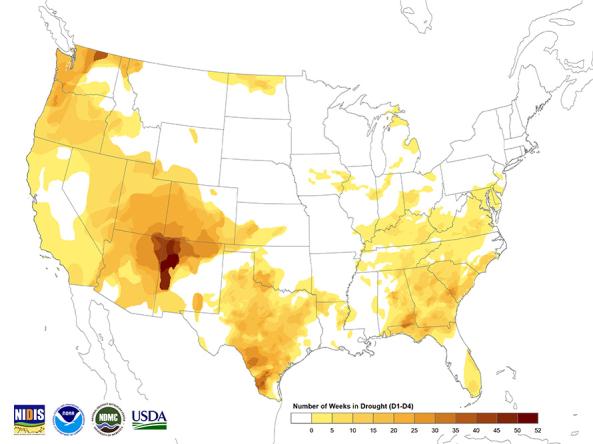
The U.S. Drought Monitor (USDM) is a weekly map, released each Thursday, to show the location and intensity of drought across the country.

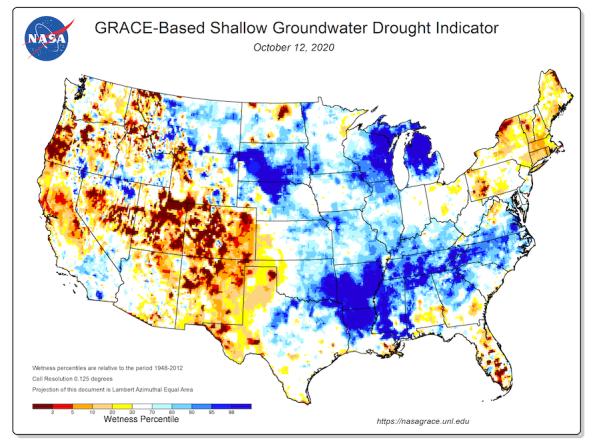
Groundwater and soil moisture drought indicators based on terrestrial water storage observations derived from GRACE satellite data and integrated with other observations, produced each week by NASA.