Drought Deteriorations Due to Late Summer Hot and Dry Conditions in Southern Portions of Intermountain West Region
Key Points
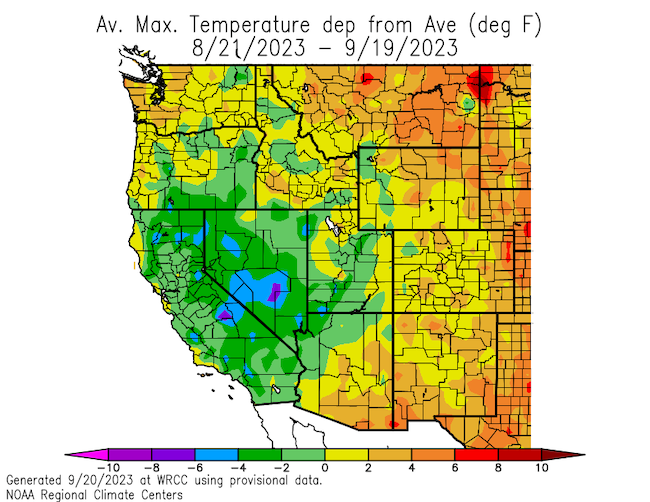
- From mid-July to mid-September, an anomalous ridge and associated above-average temperatures have persisted in the south-central and southwestern U.S. These higher temperatures have contributed to the onset of drought in the southern portion of the Intermountain West (New Mexico and Arizona).
- Much of Intermountain West experienced above average temperatures over the summer months (June, July, and August). Arizona and New Mexico experienced anomalies of 4 to 8 degrees above normal for the month of July, which contributed to drought degradations in those states. Most notably, Phoenix, Arizona experienced the hottest July on record for any U.S. city, with 54 days of 110°F or higher, and the first month ever with a mean monthly temperature above 100°F.
- Most small to medium-sized regional reservoirs continue to be full, nearly full, or have above-average storage capacity. However, this is not true for large reservoirs—including the Navajo Reservoir on the San Juan River, which is only 71% capacity (85% of median capacity), and Lake Powell, which is currently at 37% capacity (60% of median capacity), despite above-normal runoff this year.
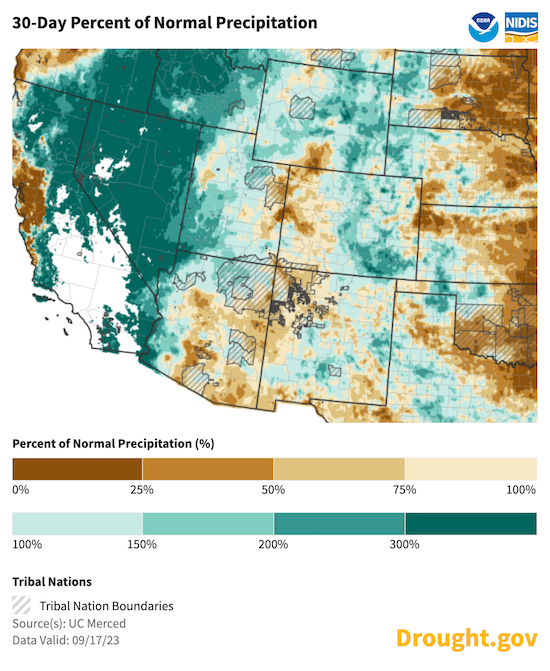
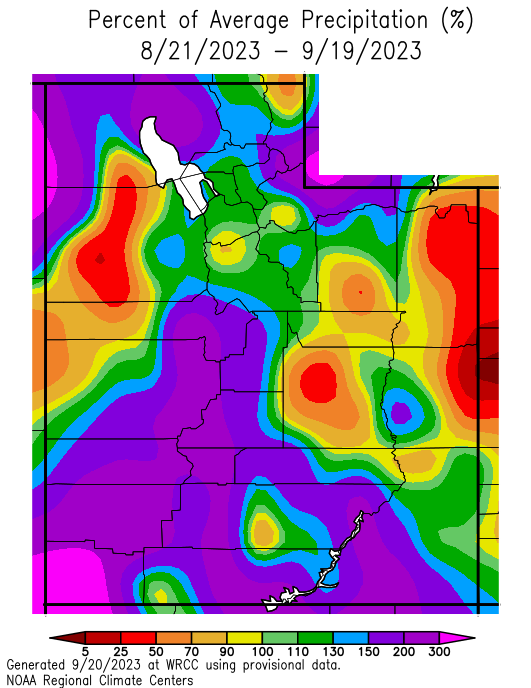
- Southern and eastern Utah, Arizona, and much of New Mexico received below-normal rainfall for July. Due to the lack of a normal North American monsoon pattern, the headwaters of the Rio Grande in Colorado experienced record dry conditions for the summer.
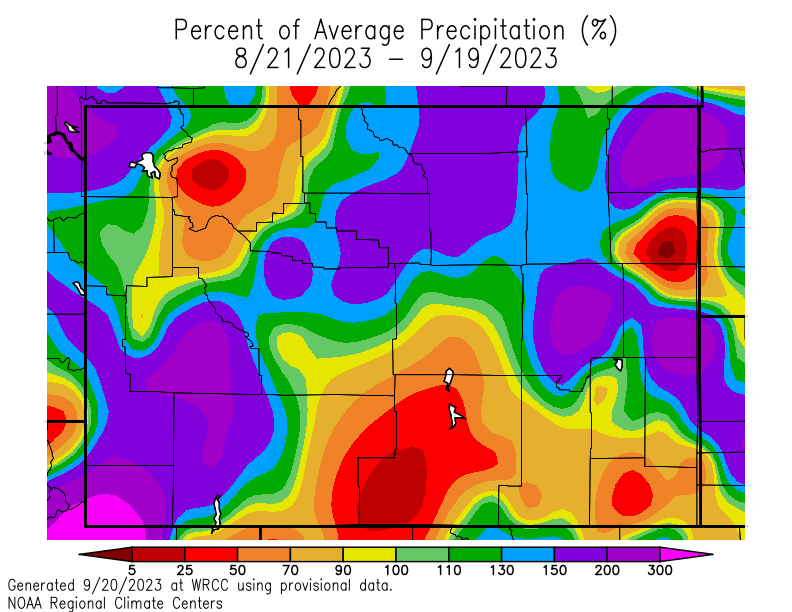
- Precipitation across the Intermountain West states for August and the beginning of September was normal to slightly below normal.
- In New Mexico, short- and long-term precipitation deficits, poor soil moisture, and impacts in the agricultural sector (eastern New Mexico) created continued deterioration in drought conditions across the state, with 30.9% of the state in Extreme Drought (D3) and 96.9% of the state in drought (D1-D4)
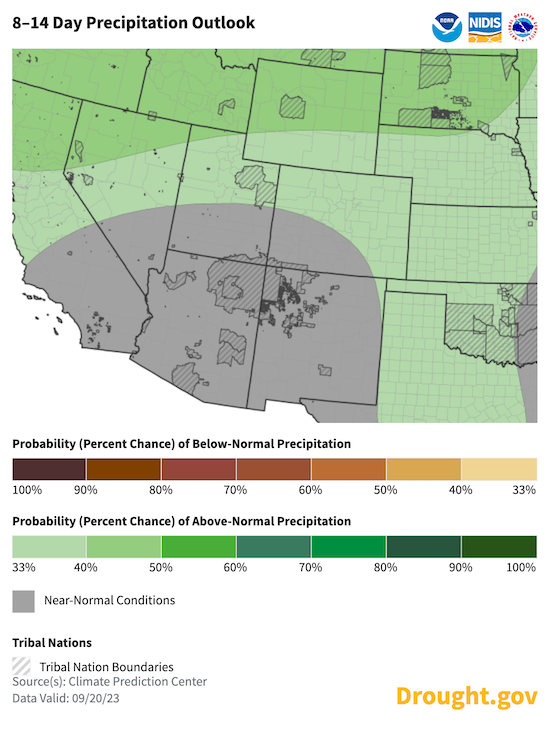
- The Climate Prediction Center's 8-14 day outlook suggests near-normal precipitation for most of the Intermountain West region, but with slightly elevated chances for above-normal precipitation in northern Colorado, Utah, and Wyoming.
The U.S. Drought Monitor is updated each Thursday to show the location and intensity of drought across the country. This map shows drought conditions across the Intermountain West using a five-category system, from Abnormally Dry (D0) conditions to Exceptional Drought (D4).
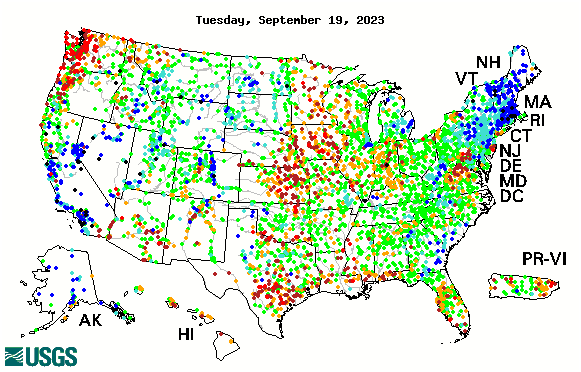
The Multi-Indicator Drought Index (MIDI) looks at current drought conditions across the U.S. by integrating several key drought indices on precipitation and moisture into one objective, computer-generated map.
The Short-Term MIDI approximates drought impacts from changes in precipitation and moisture over a short-term timeframe (looking back up to 90 days), such as impacts to non-irrigated agriculture, topsoil moisture, and range and pasture conditions. Long-term droughts (lasting months to years) can have different impacts.
Red/orange hues indicate dry conditions, while green/blue hues indicate wet conditions.
U.S. Drought Monitor
D0 - Abnormally Dry
Abnormally Dry (D0) indicates a region that is going into or coming out of drought, according to the U.S. Drought Monitor. View typical impacts by state.
D1 – Moderate Drought
Moderate Drought (D1) is the first of four drought categories (D1–D4), according to the U.S. Drought Monitor. View typical impacts by state.
D2 – Severe Drought
Severe Drought (D2) is the second of four drought categories (D1–D4), according to the U.S. Drought Monitor. View typical impacts by state.
D3 – Extreme Drought
Extreme Drought (D3) is the third of four drought categories (D1–D4), according to the U.S. Drought Monitor. View typical impacts by state.
D4 – Exceptional Drought
Exceptional Drought (D4) is the most intense drought category, according to the U.S. Drought Monitor. View typical impacts by state.
Dry Conditions
D4: Exceptional Drought
This map integrates multiple drought indices measuring precipitation and moisture into one computer-generated drought map, with a reference period of 1979–present. According to these indices, current conditions are drier than 98% to 100% of past conditions. Learn more about these categories.
D3: Extreme Drought
This map integrates multiple drought indices measuring precipitation and moisture into one computer-generated drought map, with a reference period of 1979–present. According to these indices, current conditions are drier than 95% to 98% of past conditions. Learn more about these categories.
D2: Severe Drought
This map integrates multiple drought indices measuring precipitation and moisture into one computer-generated drought map, with a reference period of 1979–present. According to these indices, current conditions are drier than 90% to 95% of past conditions. Learn more about these categories.
D1: Moderate Drought
This map integrates multiple drought indices measuring precipitation and moisture into one computer-generated drought map, with a reference period of 1979–present. According to these indices, current conditions are drier than 80% to 90% of past conditions. Learn more about these categories.
D0: Abnormally Dry
This map integrates multiple drought indices measuring precipitation and moisture into one computer-generated drought map, with a reference period of 1979–present. According to these indices, current conditions are drier than 70% to 80% of past conditions. Learn more about these categories.
Wet Conditions
W0: Abnormally Wet
This map integrates multiple drought indices measuring precipitation and moisture into one computer-generated drought map, with a reference period of 1979–present. According to these indices, current conditions are wetter than 70% to 80% of past conditions. Learn more about these categories.
W1: Moderate Wet
This map integrates multiple drought indices measuring precipitation and moisture into one computer-generated drought map, with a reference period of 1979–present. According to these indices, current conditions are wetter than 80% to 90% of past conditions. Learn more about these categories.
W2: Severe Wet
This map integrates multiple drought indices measuring precipitation and moisture into one computer-generated drought map, with a reference period of 1979–present. According to these indices, current conditions are wetter than 90% to 95% of past conditions. Learn more about these categories.
W3: Extreme Wet
This map integrates multiple drought indices measuring precipitation and moisture into one computer-generated drought map, with a reference period of 1979–present. According to these indices, current conditions are wetter than 95% to 98% of past conditions. Learn more about these categories.
W4: Exceptional Wet
This map integrates multiple drought indices measuring precipitation and moisture into one computer-generated drought map, with a reference period of 1979–present. According to these indices, current conditions are wetter than 98% to 100% of past conditions. Learn more about these categories.
The U.S. Drought Monitor is updated each Thursday to show the location and intensity of drought across the country. This map shows drought conditions across the Intermountain West using a five-category system, from Abnormally Dry (D0) conditions to Exceptional Drought (D4).
The Multi-Indicator Drought Index (MIDI) looks at current drought conditions across the U.S. by integrating several key drought indices on precipitation and moisture into one objective, computer-generated map.
The Short-Term MIDI approximates drought impacts from changes in precipitation and moisture over a short-term timeframe (looking back up to 90 days), such as impacts to non-irrigated agriculture, topsoil moisture, and range and pasture conditions. Long-term droughts (lasting months to years) can have different impacts.
Red/orange hues indicate dry conditions, while green/blue hues indicate wet conditions.
The U.S. Drought Monitor updates weekly on Thursdays, with data valid through the previous Tuesday at 7 a.m. Eastern.
The drought indices used in this map are based on the GridMET dataset and use a reference period of 1979–present. This map is updated every 5 days, with a delay of 4 to 5 days to allow for data collection and quality control.
Current Conditions
El Niño–Southern Oscillation (ENSO): Recent Evolution, Current Status, and Predictions
As of September 18, 2023, NOAA’s Climate Prediction Center (CPC) issued an El Niño Advisory, reporting that equatorial sea surface temperatures are above average across the central and eastern Pacific Ocean, and that tropical Pacific atmospheric anomalies are consistent with El Niño. By historical standards, to be classified as a full-fledged El Niño or La Niña episode, thresholds must be exceeded for a period of at least 5 consecutive overlapping 3-month seasons.
El Niño conditions for the winter months have historically resulted in a higher probability of normal to above-normal precipitation.
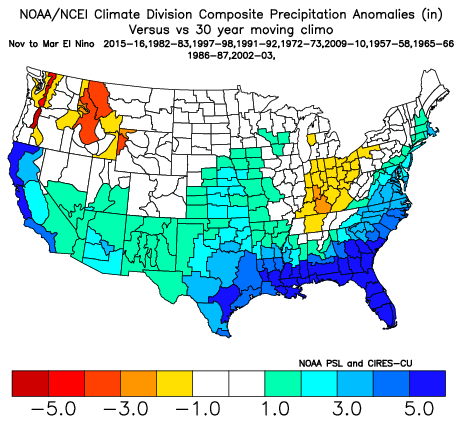
El Niño is anticipated to continue through the Northern Hemisphere winter with a greater than 95% chance through February 2024 and above 80% chance of it continuing into March. Forecasters are more confident that this will be a strong El Niño event, with roughly 2 in 3 odds of sea surface temperatures reaching or exceeding a +1.5°C anomaly for the November-January seasonal average in the Niño-3.4 region.
U.S. Drought Monitor Conditions
- Extreme (D3) drought has persisted in southeastern New Mexico and developed in the northwestern part of the state.
- Severe drought (D2) developed in parts of southwest Colorado and in central and southeastern Arizona.
- Long-term Moderate to Severe (D1–D2) drought expanded in western and central Arizona.
- As of September 20, 2023, 33.81% of the Intermountain West region is experiencing Moderate to Extreme (D1–D3) drought:
- Arizona—47.1% of the state (4.7 million residents in drought areas)
- Colorado—15.8% of the state (234,100 residents in drought areas)
- New Mexico—96.9% of the state (2 million residents in drought areas)
- Utah—4.8% of the state (25,700 residents in drought areas)
- Wyoming—0% of the state (0 residents in drought areas)
Temperatures and Precipitation
August and the beginning of September were warmer-than-normal for the majority of the Intermountain West.
Statewide August Monthly Temperature Rankings:
- Arizona: 7th warmest August
- Colorado: 10th warmest August
- New Mexico: 4th warmest August
- Utah: 33rd warmest August
- Wyoming: 35th warmest August
As of September 18, 2023, 30-day precipitation was below normal for western Colorado and New Mexico and most of Arizona. Eastern Colorado and the majority of Utah and Wyoming had near- to above-normal precipitation.
Streamflow Conditions: September 2023
The areas most impacted by higher temperatures and low precipitation over the last two months are reflected in stream conditions with low streamflows, especially for smaller, unregulated rivers.
Outlooks and Forecasts
8–14 Day Temperature & Precipitation Outlooks
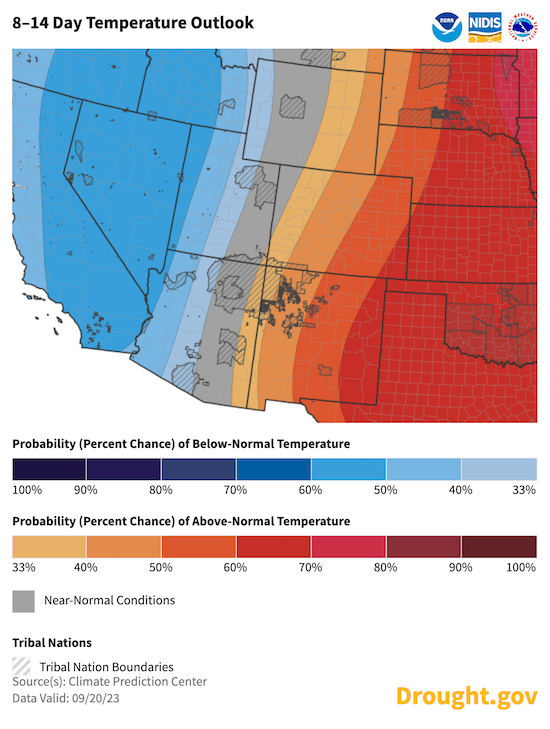
- Temperature: September 28–October 4 is likely to be warmer than normal for the eastern portions of Colorado, New Mexico, and Wyoming, with near-normal to below-normal temperatures for Arizona and Utah.
- Precipitation: Odds slightly favor wetter-than-normal conditions for this time of year for northern Colorado, northern Utah, and Wyoming, with near-normal precipitation favored for Arizona, New Mexico, southern Utah, and southwestern Colorado.
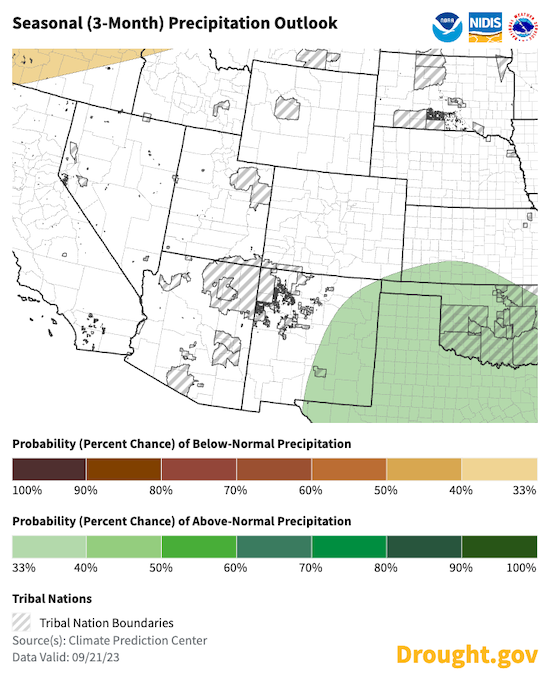
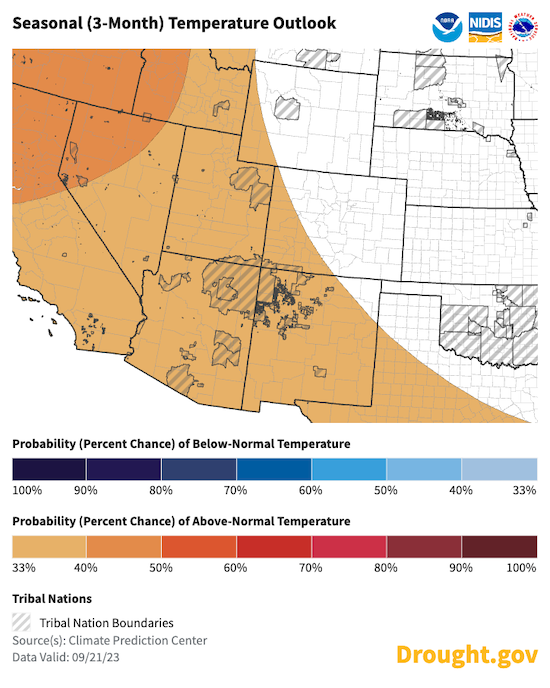
3-Month Outlook for October–December 2023
- Temperature: There is a 33%–40% chance for warmer-than-average temperatures for Arizona, southwestern Colorado, New Mexico, and Utah. There are equal chances of average, above-average, and below-average temperatures for most of Wyoming and Colorado for October, November, and December.
- Precipitation: Most of the Intermountain West has equal chances of above-, below-, or near-normal precipitation for October, November, and December. In southeastern New Mexico, there is a 33%–40% chance of above-normal precipitation this fall.
State-Based Conditions and Impacts
Arizona
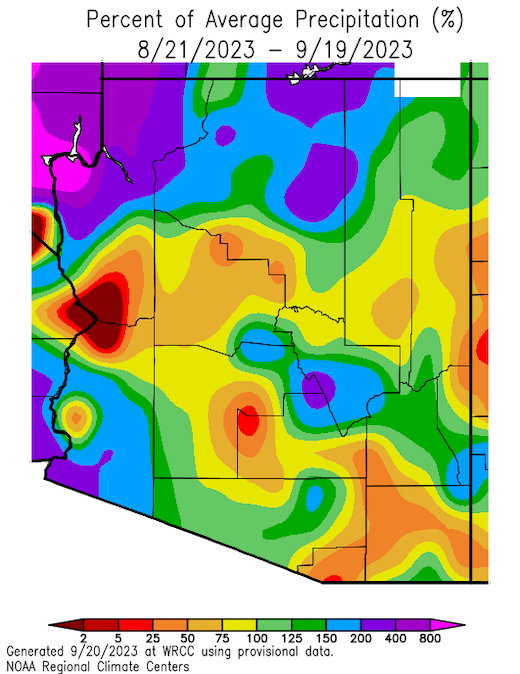
After a cold, wet, winter and a dry, cool spring, Arizona’s summer temperatures set records, with July ranking as the hottest July on record statewide. In addition, summer monsoon activity was delayed, which resulted in the 2nd driest July on record. These conditions contributed to both short- and long-term drought conditions across the state. Monsoon activity began building in southern, eastern, and northern counties in August, but monsoon precipitation was already well below average across the state. Remnants of tropical cyclone Hilary contributed up to 800% of normal precipitation for August 18–20 in Yuma, Mohave, and Coconino counties.
Statewide, June–August 2023 was the 10th driest June–August on record, with 2.47 inches of precipitation (1.72 inches below average), and the 20th warmest June–August on record, with a 79.4°F mean statewide temperature (2.1°F above average).
Colorado
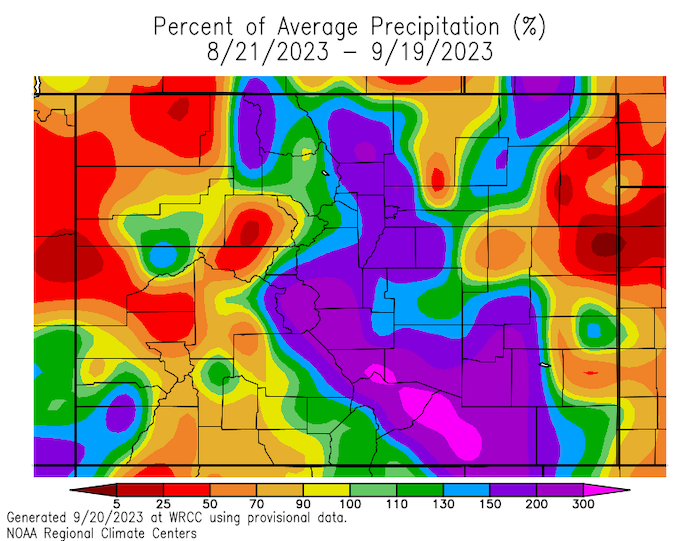
Colorado’s August precipitation was above- to much-above normal in the northern mountains and northern Front Range communities. Jackson, Grand, Larimer, and Weld counties were the wettest areas of the state. However, precipitation was below normal for southern and eastern Colorado. Conditions in the San Luis Valley in southern Colorado were extremely dry in August. This continued the dry pattern observed in June–July. The Pueblo area also experienced a drier August.
August 2023 was the 10th warmest August on record for Colorado. Temperatures were 2–4°F above normal in the central to southern mountains.
Streamflows in Colorado were normal for much of the state, with much-above-normal flows in the Big Thompson, Blue River, and headwaters of the Colorado River at Kremmling. There were multiple below-normal flows on the west slope of Colorado, notably Homestake Creek, and multiple gages in the Animas and San Juan rivers.
Statewide, Colorado’s reservoirs are 75% full and at 101% of normal capacity. Last year at this time, Colorado reservoirs were 58% full and at 78% of normal capacity. Despite recent dry conditions, Blue Mesa, the state’s largest reservoir, made a full recovery thanks to this year’s excellent snowpack.
New Mexico
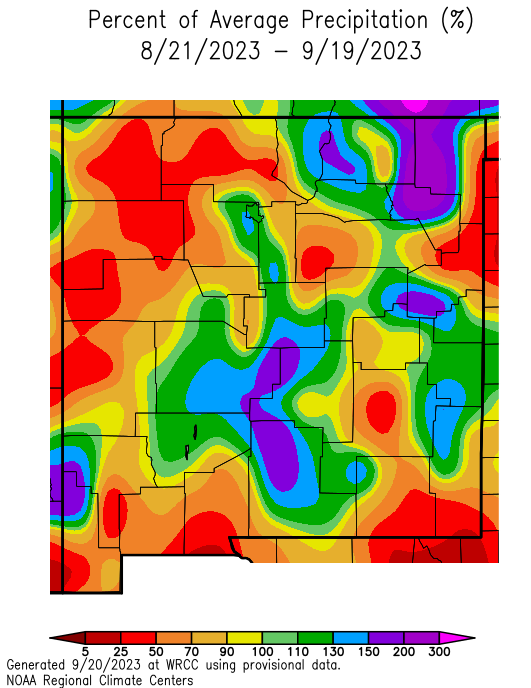
New Mexico relies on the summer monsoon season for a significant portion of annual precipitation totals. The monsoon failed to develop in New Mexico this year, which left most of the state in some level of drought. With only a few notable storms, precipitation totals are much below normal. Statewide precipitation in July was only 0.89 inch, which is 1.45 inches below the average annual rainfall of 2.34 inches in July. This is the 4th driest July on record.
Streamflow levels across New Mexico are currently 86% of normal, with the Rio Grande at Otowi Bridge reporting a gauge stage of 4.27 ft. on September 21, 2023. The Rio Grande Below Elephant Butte Dam has dropped to 4.98 ft. (September 21, 2023) from the 6.36 ft reported on September 14, 2023.
Reservoir conditions as of September 18, 2023 in New Mexico reflect the long-term shortages as a result of decades of drought. Storage levels in the three largest reservoirs in New Mexico are captured in the table below:
| Reservoir | Storage Capacity (Acre-Feet) | % of Average |
| Navajo Reservoir | 1,164,520 acre-ft | 89% |
| Elephant Butte | 364,272 acre-ft | 49% |
| Heron Reservoir | 120,553 acre-ft | 50% |
Utah
Many areas across Utah received normal to much-above-normal precipitation over the last 30 days. Much of the southeastern corner of the state and northern Tooele and Box Elder Counties reported much-above-normal precipitation. In August many Utah cities observed near-record wet conditions: the wettest August ever in Grantsville, the 3rd wettest in Brigham City and Ogden, and the 5th wettest in Logan and Salt Lake City.
Near-normal temperatures were observed in almost the entirety of Utah. Exceptions include pockets of above-normal temperatures in eastern Utah, and pockets of below-normal temperatures in western Utah, where temperatures were up to 4–6°F below normal at the western edge of Tooele and Box Elder Counties.
Much-above normal streamflow occurred in the Weber, Santa Clara, Mammoth, and Sevier Rivers in Utah.
Small and medium-sized reservoirs in Utah saw improvement in 2023, and are currently 88% full, which is 110% of normal capacity (averaged across state reservoirs). Last year, Utah reservoirs were 57% full and at 81% of normal capacity. However, Utah is also reliant on Lake Powell, which is only at 36.16% of capacity due to long-term drought impacts. This is a year-over-year improvement, but highlights the discrepancy in the short-term vs. long-term conditions the state's water resources face.
Wyoming
Select areas of Wyoming received much-above normal precipitation in the last 30 days. An early August surge of monsoonal moisture (August 1–9) and the remnants of Hurricane Hilary (August 20–23) drove high regional precipitation. It was the 2nd wettest August in Pinedale, 3rd wettest in Dubois, 4th wettest at Old Faithful, and the 5th wettest in Buffalo and Sheridan.
Near-normal temperatures were observed in almost all of Wyoming, with the exception of above-normal temperatures in western Wyoming.
Much-above normal streamflow occurred in the Powder, Little Wind, Big Sandy, and Blacks Fork Rivers in Wyoming.
For More Information
NIDIS and its partners will issue future Drought Updates as conditions evolve.
More local information is available from the following resources:
- Your state climatologist
- Your local National Weather Service office
- Western Water Assessment: Intermountain West Climate Dashboard
- Climate Assessment for the Southwest: Southwest Climate Outlook
Prepared By
Gretel Follingstad, PhD
NOAA/National Integrated Drought Information System (NIDIS), CU Boulder/CIRES
Erinanne Saffell
Arizona State Climatologist/Arizona State University
Becky Bolinger
Colorado Climate Center/Colorado State University
Jon Meyer
Utah Climate Center/Utah State University
Tony Bergantino
Water Resources Data System – Wyoming State Climate Office
Laura Haskell, PE
Utah Department of Natural Resources, Division of Water Resources
This Drought Status Update is issued in partnership between the National Oceanic and Atmospheric Administration (NOAA), and the offices of the state climatologist for Arizona, Colorado, New Mexico, Utah, and Wyoming. The purpose of the update is to communicate a potential area of concern for drought expansion and/or development within the Intermountain West based on recent conditions and the upcoming forecast. NIDIS and its partners will issue future Drought Updates as conditions evolve.
