Rapid Spring Snowmelt Reduces Western Water Supplies; Drought Likely to Persist in a Warm Summer
Key Points
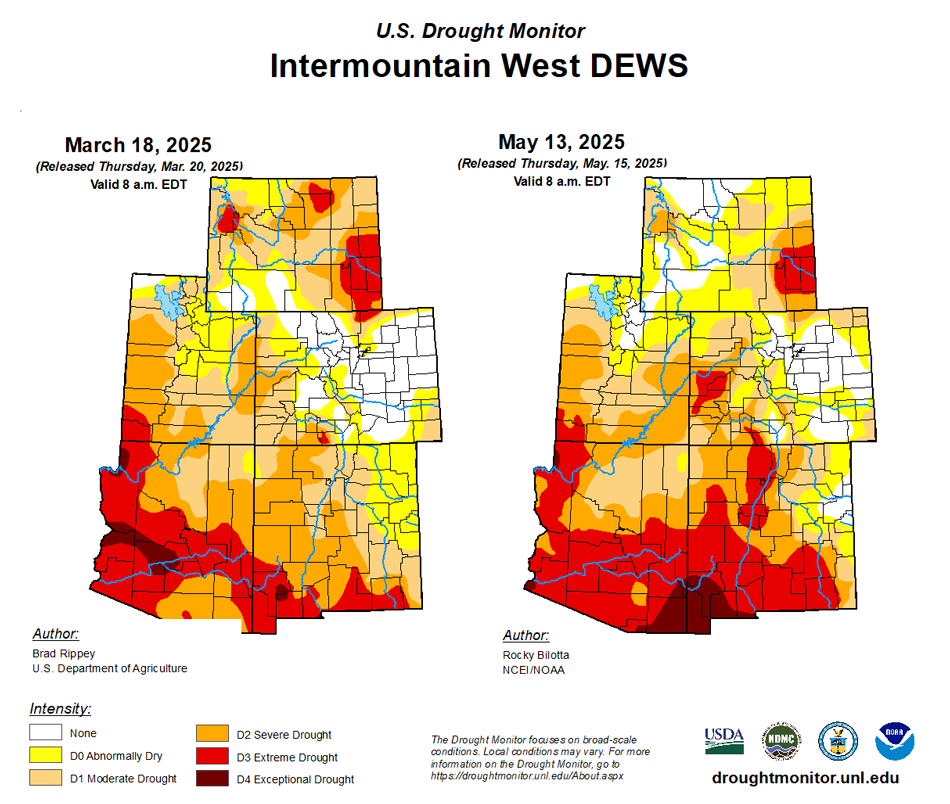
- A warm, dry spring led to a continued expansion and intensification of drought across much of the Intermountain West region. According to the U.S. Drought Monitor, Extreme and Exceptional Drought (D3-D4) coverage increased from 20% of the region on March 18, 2025 in the last Intermountain West Drought Status Update, to 27% on May 15, 2025. The worst drought conditions are in New Mexico and Arizona.
- Warm temperatures in April caused an early, rapid melt out of mountain snowpacks across the West, which is expected to reduce spring runoff and inflows to reservoirs and future water supply for the region. Water supply forecasts for the Colorado and Rio Grande Basins have decreased since April 1 projections due to well-below-average April precipitation.
- These warm and dry conditions, along with early runoff and reduced streamflow, have led to state-level responses, including fire restrictions and emergency drought declarations.
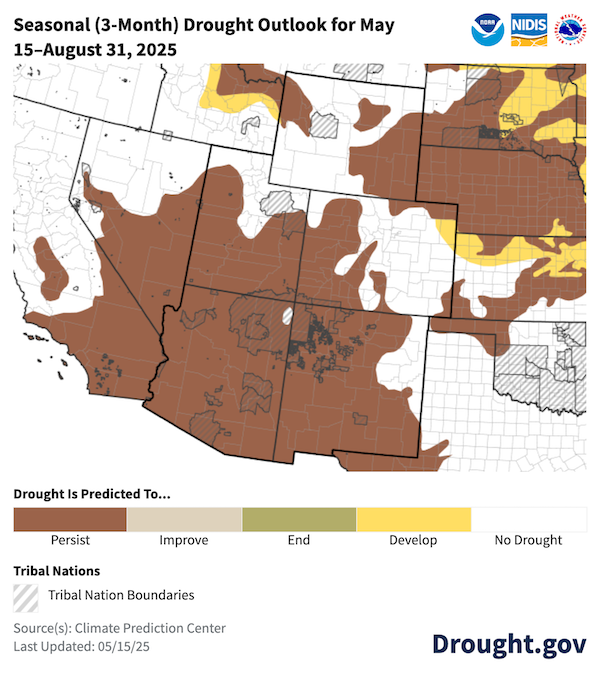
- Existing drought conditions are likely to persist through summer, along with warmer-than-normal temperatures.
- The timing and intensity of the upcoming Southwest Monsoon will impact drought coverage and intensity. The Southwest Drought and Wildfire Summer Outlook Webinar on June 3 will provide more information on conditions, outlooks, and potential impacts. Register here.
This update is based on data available as of Monday, May 19, 2025 at 8:00 a.m. MT. We acknowledge that conditions are evolving.
The U.S. Drought Monitor depicts the location and intensity of drought across the country. The map uses 5 classifications: Abnormally Dry (D0), showing areas that may be going into or are coming out of drought, and four levels of drought (D1–D4).
The U.S. Drought Monitor is a joint effort of the National Oceanic and Atmospheric Administration, U.S. Department of Agriculture, and National Drought Mitigation Center.
A drought index combines multiple drought indicators (e.g., precipitation, temperature, soil moisture) to depict drought conditions. For some products, like the U.S. Drought Monitor, authors combine their analysis of drought indicators with input from local observers. Other drought indices, like the Standardized Precipitation Index (SPI), use an objective calculation to describe the severity, location, timing, and/or duration of drought.
Learn MorePeriods of drought can lead to inadequate water supply, threatening the health, safety, and welfare of communities. Streamflow, groundwater, reservoir, and snowpack data are key to monitoring and forecasting water supply.
Learn MoreDrought can reduce the water availability and water quality necessary for productive farms, ranches, and grazing lands, resulting in significant negative direct and indirect economic impacts to the agricultural sector. Monitoring agricultural drought typically focuses on examining levels of precipitation, evaporative demand, soil moisture, and surface/groundwater quantity and quality.
Learn MoreU.S. Drought Monitor Categories
D0 - Abnormally Dry
Abnormally Dry (D0) indicates a region that is going into or coming out of drought. View typical impacts by state.
D1 - Moderate Drought
Moderate Drought (D1) is the first of four drought categories (D1–D4), according to the U.S. Drought Monitor. View typical impacts by state.
D2 - Severe Drought
Severe Drought (D2) is the second of four drought categories (D1–D4), according to the U.S. Drought Monitor. View typical impacts by state.
D3 - Extreme Drought
Extreme Drought (D3) is the third of four drought categories (D1–D4), according to the U.S. Drought Monitor. View typical impacts by state.
D4 - Exceptional Drought
Exceptional Drought (D4) is the most intense drought category, according to the U.S. Drought Monitor. View typical impacts by state.
Total Area in Drought (D1–D4)
Percent area of the Intermountain West that is currently in drought (D1–D4), according to the U.S. Drought Monitor.
The U.S. Drought Monitor depicts the location and intensity of drought across the country. The map uses 5 classifications: Abnormally Dry (D0), showing areas that may be going into or are coming out of drought, and four levels of drought (D1–D4).
The U.S. Drought Monitor is a joint effort of the National Oceanic and Atmospheric Administration, U.S. Department of Agriculture, and National Drought Mitigation Center.
The U.S. Drought Monitor is released every Thursday morning, with data valid through the previous Tuesday at 7 a.m. ET.
A drought index combines multiple drought indicators (e.g., precipitation, temperature, soil moisture) to depict drought conditions. For some products, like the U.S. Drought Monitor, authors combine their analysis of drought indicators with input from local observers. Other drought indices, like the Standardized Precipitation Index (SPI), use an objective calculation to describe the severity, location, timing, and/or duration of drought.
Learn MorePeriods of drought can lead to inadequate water supply, threatening the health, safety, and welfare of communities. Streamflow, groundwater, reservoir, and snowpack data are key to monitoring and forecasting water supply.
Learn MoreDrought can reduce the water availability and water quality necessary for productive farms, ranches, and grazing lands, resulting in significant negative direct and indirect economic impacts to the agricultural sector. Monitoring agricultural drought typically focuses on examining levels of precipitation, evaporative demand, soil moisture, and surface/groundwater quantity and quality.
Learn MoreCurrent Conditions and Impacts for the Intermountain West
- While southern portions of the Intermountain West (Arizona, New Mexico) have been in drought since last summer, there has been a general trend of drought expansion northward. Much of this expansion was due to a dry summer followed by a dry fall and winter.
- Drought conditions in Wyoming have continued since last summer, with some improvements, including less Extreme Drought (D3), which is now restricted to eastern Wyoming. Spotty improvement in drought conditions occurred in northern Utah, eastern Colorado, and eastern New Mexico.
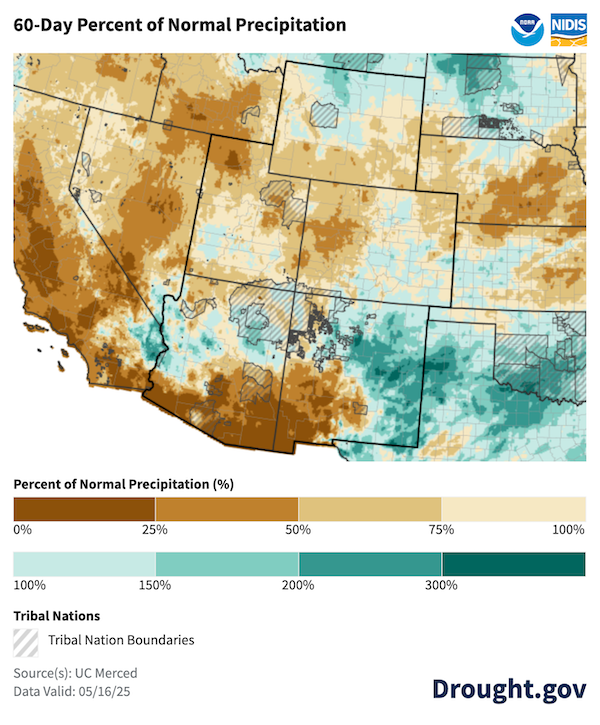
- Precipitation was below normal for much of the Intermountain West over the last two months, though northern Wyoming, eastern New Mexico, and north-central Arizona were wetter than normal.
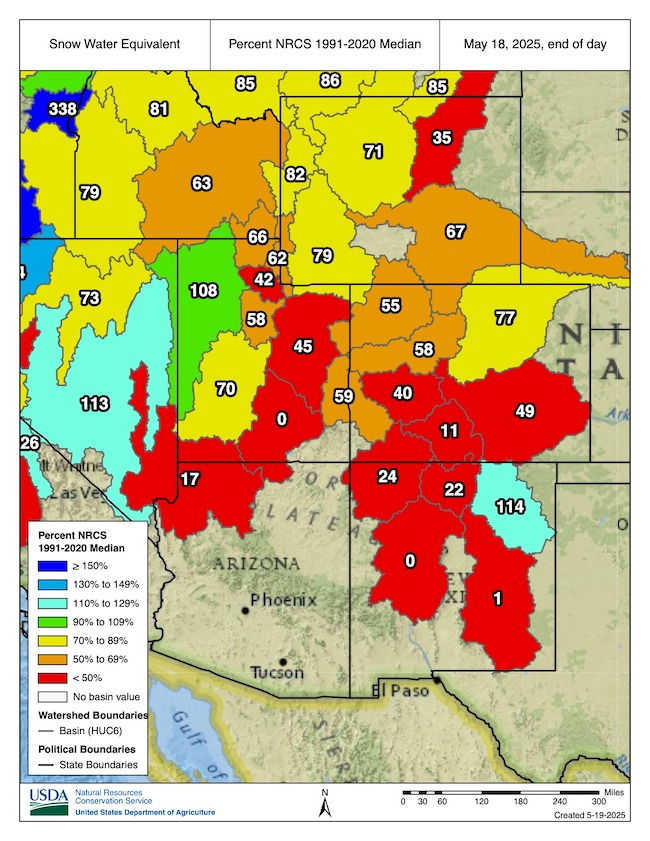
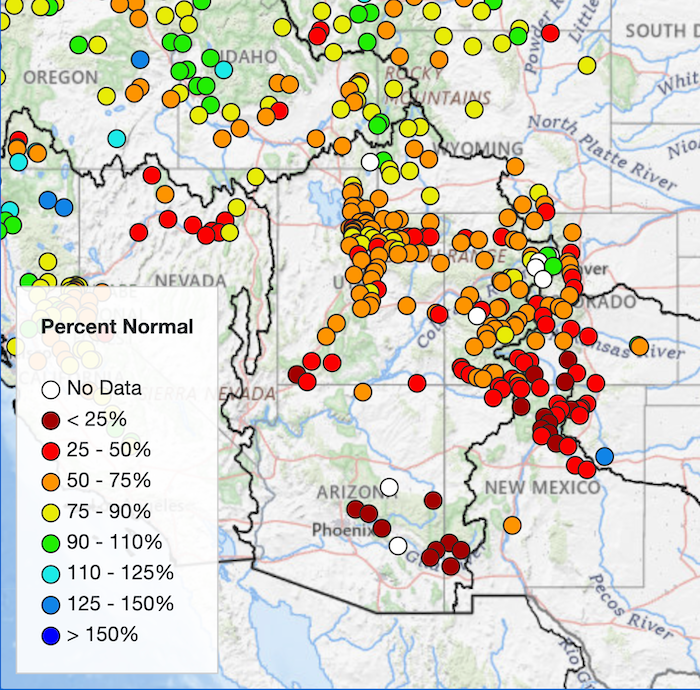
- Rapid and early snow melt occurred across Wyoming, Utah, Colorado, and New Mexico in April. Some basins went from above-median snowpack to snow drought conditions in under a month. Spring snowstorms have not delivered enough snow to overcome these losses. As a result, many rivers experienced their seasonal peaks several weeks early. As of May 15, snowpack is at 25% to 50% of average in many river basins across the Intermountain West. For more information, view the May 20 Western Snow Drought Status Update.
- Streamflows were well-below normal over the last month in central and southeastern Arizona, along the Rio Grande in New Mexico, in southwest Utah, and southwest Colorado.
- Lake Powell is at 31% capacity and Lake Mead at 32%. In Arizona, the Salt River system is at 69% of capacity and the Verde River System is only 53% full. In New Mexico, Elephant Butte Reservoir is currently at 13% of capacity. View current reservoir storage for major U.S. Bureau of Reclamation reservoirs.
- Fire potential is above normal for this time of year in New Mexico and Arizona due to dry and warm conditions that can fuel fire activity. In response to this concern, several areas have fire restrictions in place including Southeastern Arizona.
- Utah declared a drought emergency in 17 southern Utah counties on April 24 in response to low streamflow forecasts, increased water demand as temperatures rise, and southern Utah experiencing Extreme Drought (D3).
Drought Conditions Worsen in the Four Corners States
Early Melt Out Reduces Snowpack in Much of the West
Dry March and April, Particularly in Southern Arizona and New Mexico
Outlooks and Potential Impacts in the Intermountain West
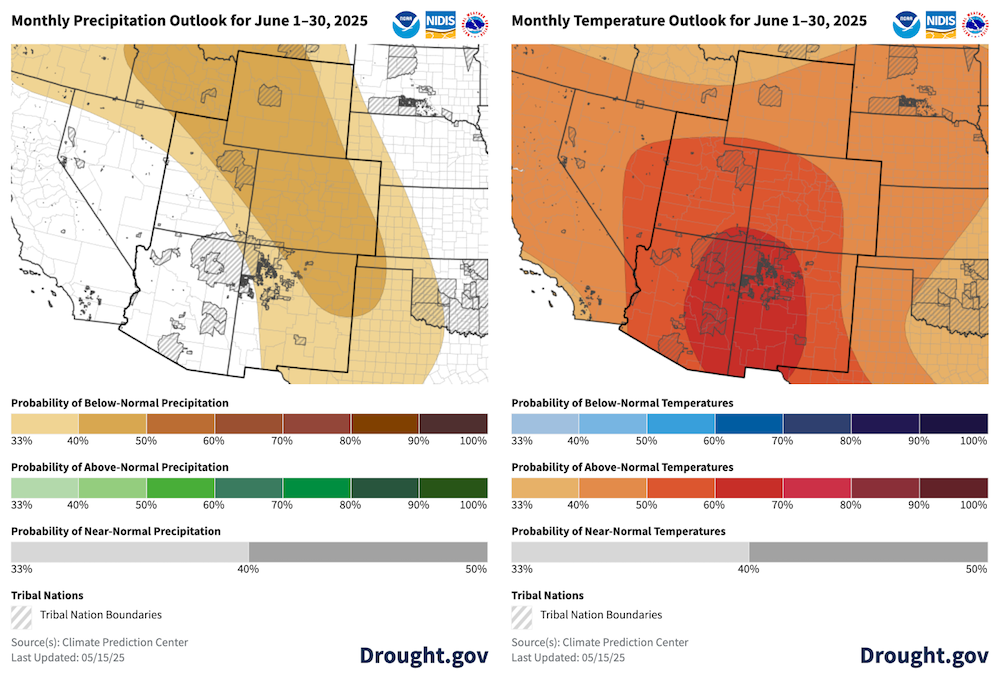
- In June, outlooks favor above-average temperatures in the Four Corner states. High temperatures are a precursor to the summer monsoon. Below-normal precipitation is favored for all states except Arizona, which has equal chances for above- or below-normal precipitation.
- In June through August, warmer than normal temperatures are favored through the summer months. Dry conditions are favored in northern portions of the region, with near-normal or slightly wetter than normal conditions favored in much of Arizona.
- Drought is predicted to persist in much of the region over the next month and the summer months.
- Runoff forecasts favor below median streamflows across the basin, including flows below 25% of median in Southern New Mexico and Arizona. Southern Utah, Southern Colorado, and Northern New Mexico may see flows ranging from 25-50% of normal. Elsewhere in the region, forecasts favor flows 50-75% of median. As of May 4, the U.S. The Bureau of Reclamation reports below-average runoff into key reservoirs in the Intermountain West, with 67% of unregulated flows forecast for Lake Powell in April–July.
- Wildfire risk is heightened in June for southern portions of the Intermountain West, including most of Arizona and New Mexico.
- A weak La Niña ended by April. La Niña correlates to drier winters for the southwestern U.S. Neutral El Nino-Southern Oscillation (ENSO) conditions are favored through summer.
Dry and Warm Conditions Expected in June
Drought Likely to Persist this Summer in the Intermountain West
Reduced Water Supply from Snow Runoff Expected Across the Intermountain West this Summer
Resources
- More local information is available from the following resources:
- More state information is available from the following resources
- Arizona: Interactive Drought Dashboard; State Climate Office
- Colorado: Water Conditions Monitoring Committee; Colorado Climate Center Drought Dashboard
- New Mexico: Office of the State Engineer, Drought page; New Mexico Climate Center
- Utah: Department of Natural Resources, Drought page; Utah Climate Center
- Wyoming: Drought page; State Climate Office
- To report or view local drought impact information:
- Register for the Southwest Drought and Wildfire Summer Outlook Webinar on Tuesday, June 3 at 1 p.m. MT, which will provide updated information about the current drought and the summer outlook, as well as the upcoming monsoon and wildland fire season.
Prepared By
Eleanor C. Hasenbeck
University of Colorado Boulder/Cooperative Institute for Research in Environmental Sciences (CIRES), NOAA/National Integrated Drought Information System (NIDIS)
Meredith Muth
NOAA/National Integrated Drought Information System (NIDIS)
Dave Simeral
Western Regional Climate Center/Desert Research Institute
Erinanne Saffell
Arizona State Climate Office at Arizona State University
Jon Meyer
Utah Climate Center at Utah State University
Tony Bergantino
Wyoming State Climate Office at University of Wyoming
Andrew Mangham
NOAA’s National Weather Service Albuquerque Weather Forecast Office
Paul Miller
NOAA’s National Weather Service Colorado Basin River Forecast Center
This Drought Status Update is issued in partnership between the National Oceanic and Atmospheric Administration (NOAA)/National Integrated Drought Information System (NIDIS) and partners across the Intermountain West. NIDIS and its partners will issue future Drought Status Updates as conditions evolve.