Drought Persists Across the Midwest, Contributing to Record-Low Water Levels on the Ohio and Mississippi Rivers
Register for today’s (October 19) North Central U.S. Climate and Drought Summary & Outlook Webinar, taking place at 1 p.m. CT, which will provide more information about conditions, impacts, and outlooks.
Key Points
- According to the U.S. Drought Monitor, drought is currently impacting 50% of the Midwest region, with the most intense drought in the western portions of the region in Iowa, Missouri, Wisconsin, and Minnesota (Figure 1).
- 94% of Iowa is currently in drought, with 24% in extreme drought (D3). Despite decent improvement over the last month, drought is still impacting 68% of Wisconsin and 58% of Minnesota.
- Overall, conditions have been dry since mid-August across a majority of the region (Figure 2), with some pockets of above-normal precipitation that have provided some drought relief in the upper Midwest, particularly over the last two weeks.
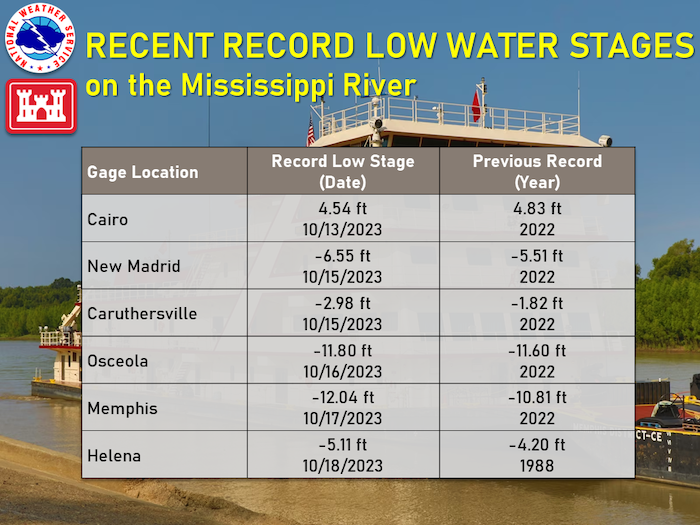
- Drought conditions have worsened across Ohio, Indiana, and Kentucky over the last eight weeks (Figure 3). These conditions have driven record low water levels on the Ohio River and subsequently the Lower Mississippi River. Records began to be broken at Cairo, IL starting October 8 and at Memphis, TN on October 10 (Figure 4). Recent precipitation has helped raise levels to just above record stages.
- The record low water levels are affecting navigation along the Mississippi River and lower Ohio River. Restrictions remain in place requiring barges to reduce loads, and up to 16 dredges are operating along the entire Mississippi River to maintain the 9-foot navigation channel.
- Beyond navigation, drought is impacting other sectors in the region. Negative drought impacts include poor pasture conditions forcing supplementary feeding for livestock and selling of herds in Missouri, corn toxin issues (aflatoxin) in central Missouri due to the drought, low surface water in streams and ponds/lakes, reduced municipal water supply and poor water quality in Iowa, Minnesota, and Missouri, and endangered mussel deaths in Wisconsin due to low water levels.
- Drought is likely to persist across some areas already in drought over the next month as soil moisture remains low across the region. Near-term precipitation could improve drought in some locations. The two week (October 26–November 1) precipitation outlook shows greater chances that a slightly wetter pattern will continue through the end of October (Figure 5). The monthly outlook for November 2023 shows equal chances for above-, near-, or below-normal precipitation for the majority of the region (Figure 6).
- Potential near-term impacts of persistent drought include the continuation of low water levels on major rivers and tributaries, which will likely continue to impact navigation. However, river levels typically rebound in the winter due to seasonal and climatological trends. Also, there is an increased risk for rural on-farm fires during harvest.
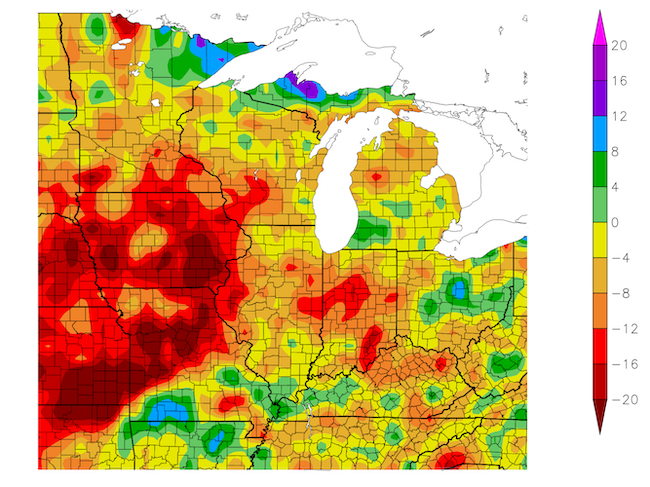
- Longer-term deficits of precipitation and soil moisture should also be monitored. In some areas (Iowa; Missouri; and portions of Indiana, Minnesota, and Illinois), 2-year precipitation deficits are on the order of 16-20 inches (Figure 7). Soil moisture is low across the region, particularly at deeper levels. Soil moisture recharge over the winter months is important for the 2024 growing season.
Report Your Local Impacts
As conditions evolve, accurate reports on conditions and drought impacts are critical. Whether your area is currently wet, close to normal, or dry, please consider reporting conditions and any drought impacts you see or hear via the Condition Monitoring Observer Reports (CMOR) from the National Drought Mitigation Center. If you are already a CoCoRaHS observer, we encourage you to submit a Condition Monitoring Report.
Current Conditions
Figure 1. U.S. Drought Monitor for the Midwest (Valid October 17, 2023)
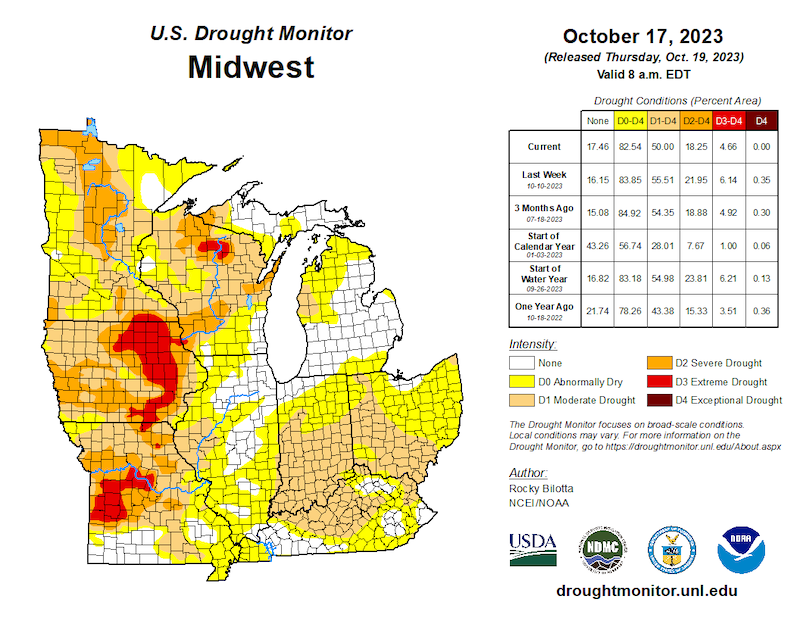
Figure 2. 60-Day Departure from Normal Precipitation (inches) (August 20–October 18, 2023)
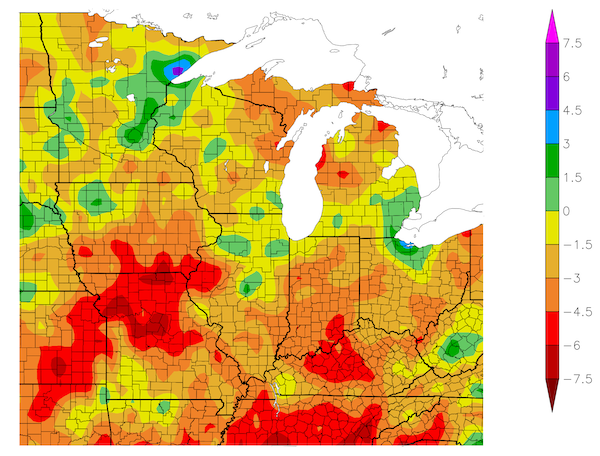
Figure 3. 8-Week U.S. Drought Monitor Change Map (Since August 22, 2023)
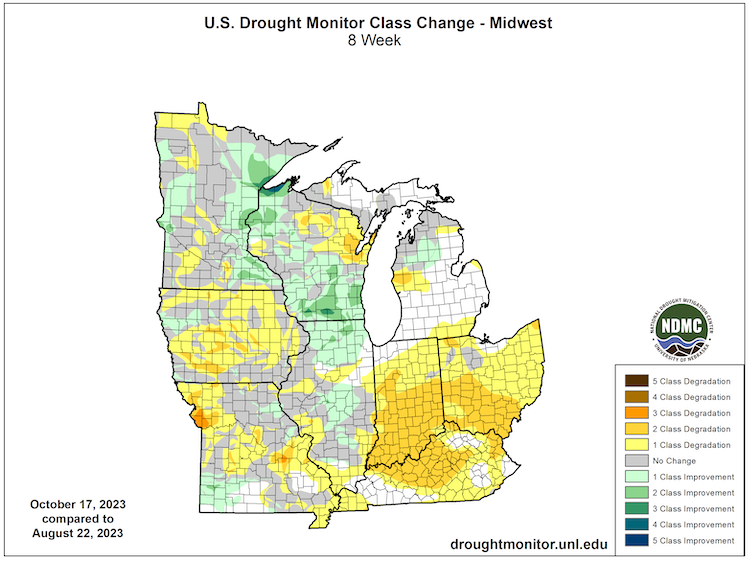
Figure 4. Recent and Historical Low Water Events on the Lower Mississippi River
Outlooks & Forecasts
Figure 5. 8–14 Day Precipitation Outlook (Valid October 26–November 1, 2023)
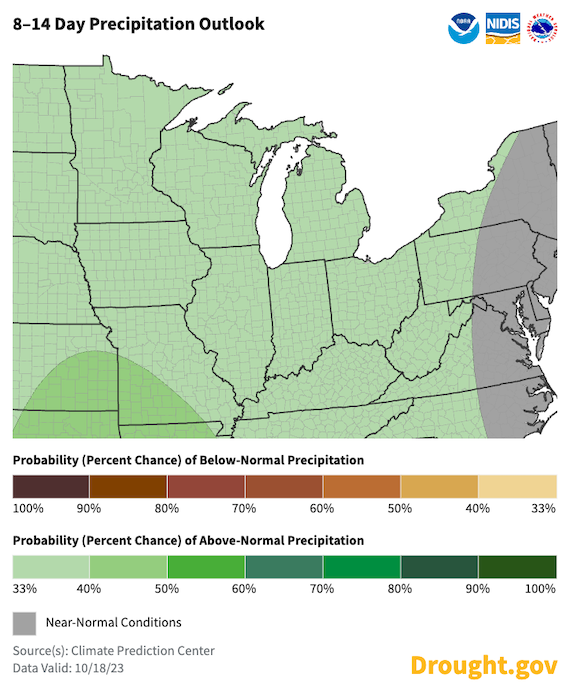
Figure 6. Monthly Precipitation Outlook (Valid November 2023)
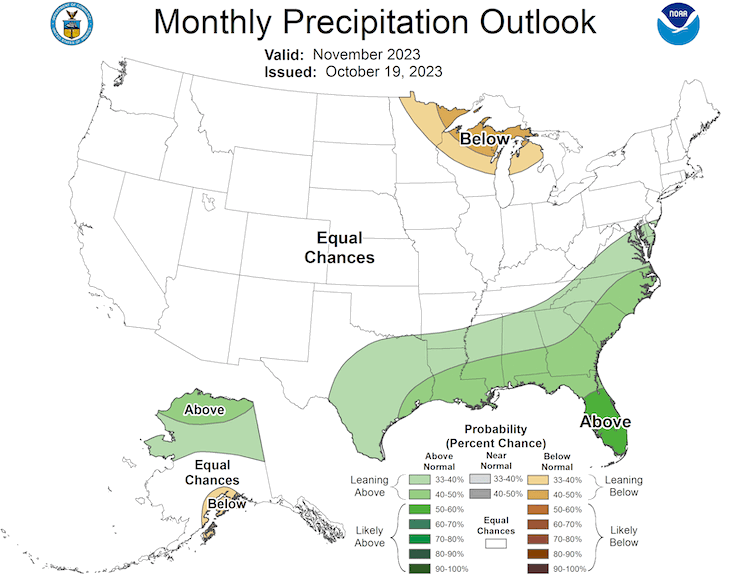
Figure 7. 24-Month Departure from Normal Precipitation (inches) (October 17, 2021-October 16, 2023)
Resources
For More Information
- NIDIS and its partners will issue future updates as conditions evolve.
- A special thank you to the state climate offices and National Weather Service offices in the Midwest for providing local information on drought conditions and impacts included in the webinar and on this report.
- More local information is available from the following resources:
- To report or view local drought impact information:
- Report your Drought Impacts through Condition Monitoring Observer Reports (CMOR).
- View CoCoRaHS Condition Monitoring reports.
- Register for today’s (October 19) North Central U.S. Climate and Drought Summary & Outlook Webinar, which will provide more information about conditions, impacts, and outlooks.
Prepared By
Molly Woloszyn
NOAA/National Integrated Drought Information System (NIDIS), CIRES/CU Boulder
Doug Kluck
NOAA/National Centers for Environmental Information
Dennis Todey & Laura Nowatske
USDA Midwest Climate Hub
Audra Bruschi
NOAA/National Weather Service Central Region
Jim Noel & Mike Welavert
NOAA/Ohio and North Central River Forecast Center
Anna Wolverton
U.S. Army Corps of Engineers Mississippi Valley Division/NOAA National Weather Service
Melissa Widhalm
Midwestern Regional Climate Center/Purdue University
Denise Gutzmer
National Drought Mitigation Center
This drought status update is issued in partnership between the National Oceanic and Atmospheric Administration (NOAA) and the U.S. Department of Agriculture (USDA) to communicate a potential area of concern for drought expansion and/or development within the Midwest based on recent conditions and the upcoming forecast. NIDIS and its partners will issue future drought status updates as conditions evolve.


