Summer monsoon improves but does not eliminate drought in the Southwest.
Key Points
- An active summer monsoon pattern has improved short-term drought conditions across the Intermountain West.
- The area in severe (D2) to exceptional (D4) drought drops to the lowest in two years.
- Post-monsoon, fall is expected to see a return to warm and dry conditions.
Current U.S. Drought Monitor map for the Intermountain West Drought Early Warning System (DEWS) region with data valid for August 23, 2022. The U.S. Drought Monitor is updated each Thursday to show the location and intensity of drought across the country.
14.55% of the Intermountain West DEWS region is experiencing extreme to exceptional drought (D3–D4).
U.S. Drought Monitor Categories
Current U.S. Drought Monitor map for the Intermountain West Drought Early Warning System (DEWS) region with data valid for August 23, 2022. The U.S. Drought Monitor is updated each Thursday to show the location and intensity of drought across the country.
14.55% of the Intermountain West DEWS region is experiencing extreme to exceptional drought (D3–D4).
Current Drought Conditions and Outlook
U.S. Drought Monitor Conditions
- An active summer monsoon pattern has improved short-term, drought conditions across the Intermountain West
- Exceptional (D4) drought persists in central Utah and northeast Colorado.
- 14.5% of the region is experiencing extreme (D3) drought or worse.
- Extreme (D3) drought conditions have been in place in this region since May 2020.
- Moderate (D1) or worse drought has been in the region since August 2009.
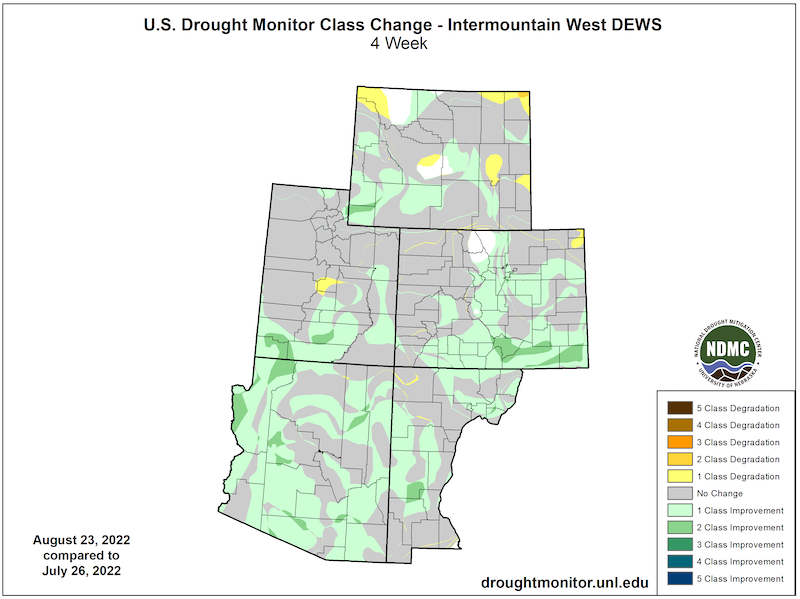
U.S. Drought Monitor 4-Week Change Map
Southwest Monsoon Season to Date
- High minimum temperatures in July:
- State-wide monthly mean daily minimum temperatures were:
- 3.9 ºF above average for New Mexico in July, a new July record for the state.
- 3.7 ºF above average for Colorado in July, a new July record for the state.
- 3.1 ºF above average for Arizona in July, tying the second warmest July minimums on record for the state.
- State-wide monthly mean daily minimum temperatures were:
- Rainfall totals for the Southwest have been mostly average to above average for the monsoon season so far.
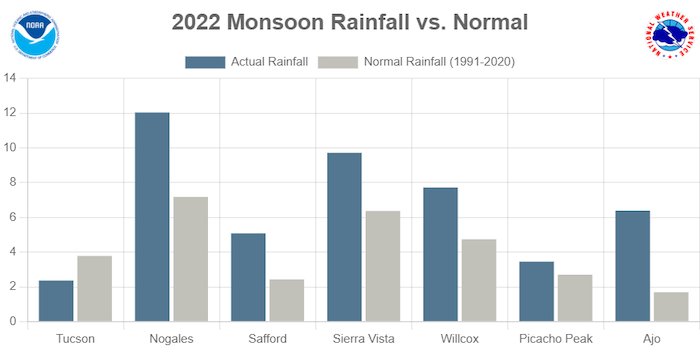
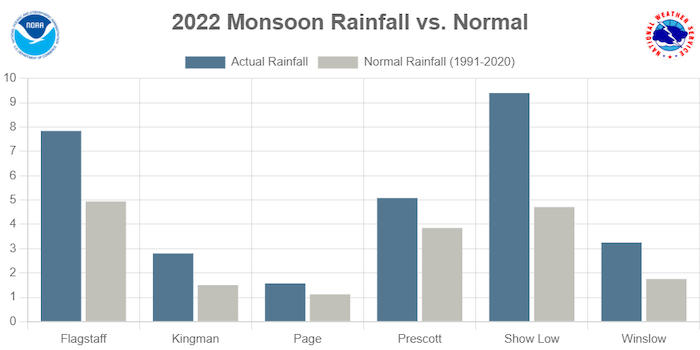
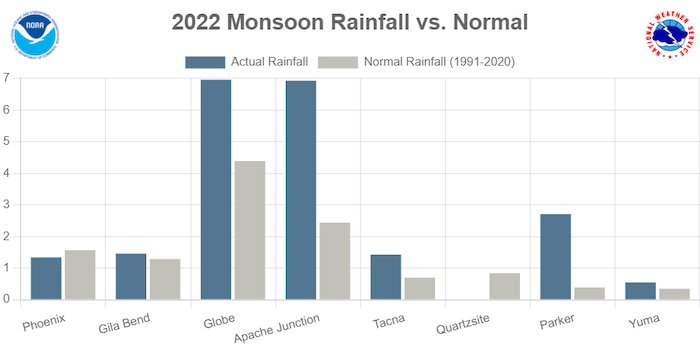
Arizona Monsoon Rainfall vs. Normal
Southeastern Arizona:
Northern Arizona:
Central Arizona:
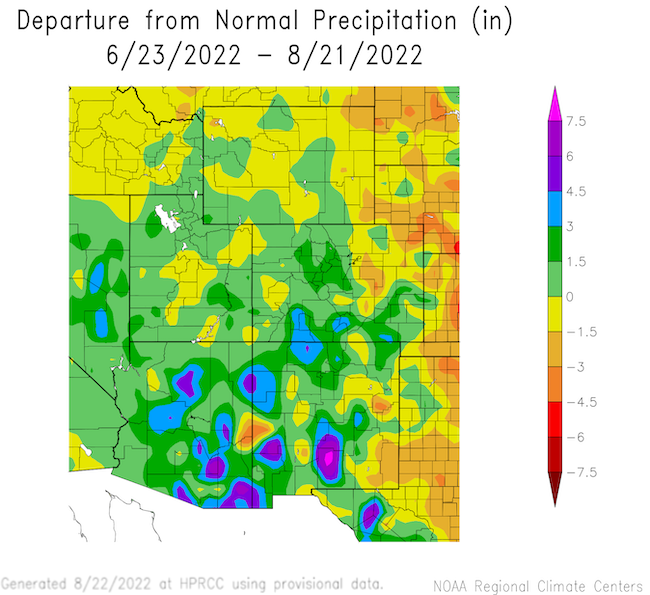
60-Day Departure from Normal Precipitation
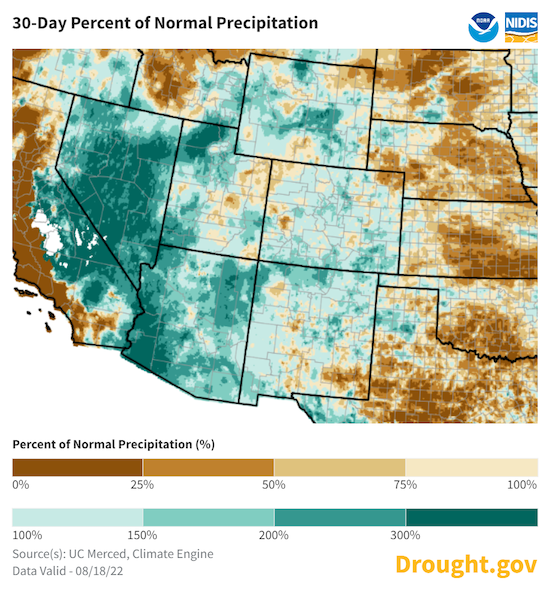
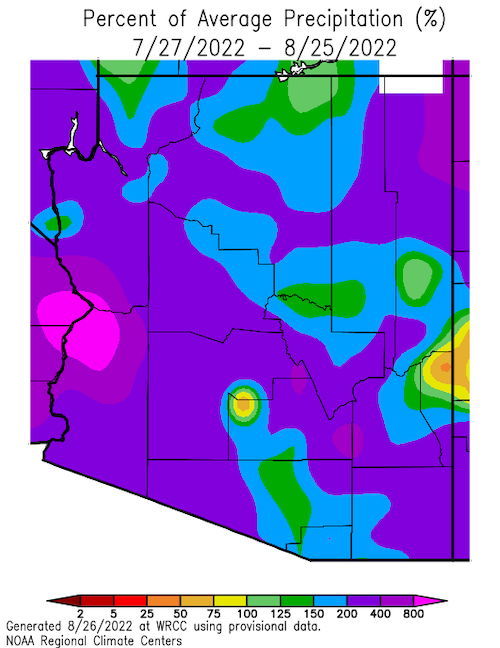
30-Day Percent of Normal Precipitation
Forecasts and Seasonal Outlooks
September 2022
The Climate Prediction Center's monthly outlook for September shows:
- Increased temperatures are highly likely across most of the Intermountain West region.
- The monthly outlook for September shows above-average precipitation is likely for southern Arizona and below-normal precipitation is likely for Wyoming, northern Utah, and northern Colorado.
September 2022 Temperature Outlook
September 2022 Precipitation Outlook
3-Month Outlook for September–November 2022
- Seasonal forecasts for September–November show a hotter-than-normal season ahead for the Intermountain West.
- Lower-than-normal precipitation is more likely for Utah and Colorado.
Three-Month Temperature Outlook: September–November 2022
Three-Month Precipitation Outlook: September–November 2022
Seasonal Drought Outlook
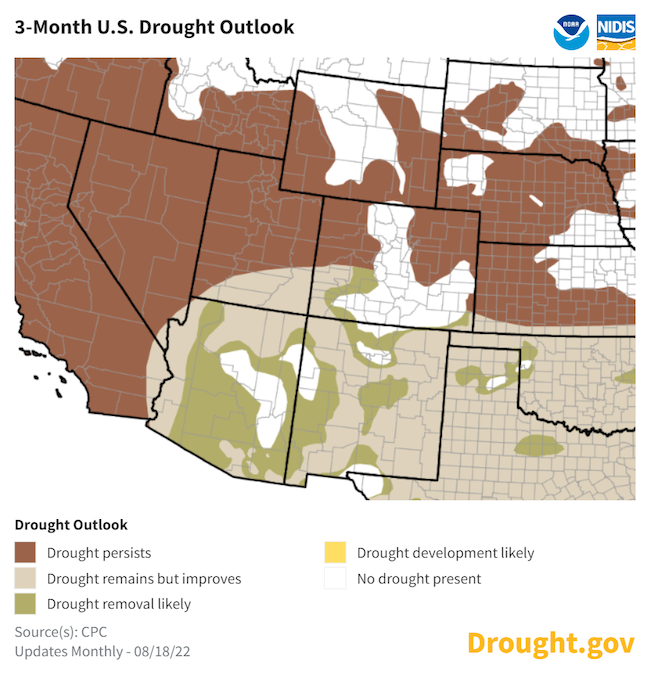
- Following an active monsoon season and looking ahead into fall, the Climate Prediction Center's seasonal drought outlook shows that short-term drought will likely improve for Arizona and New Mexico but will likely persist for Utah and parts of northern Colorado and Wyoming.
- Long-term drought will continue.
August 18–November 30 Drought Outlook
La Niña Persists and May Impact Winter Weather
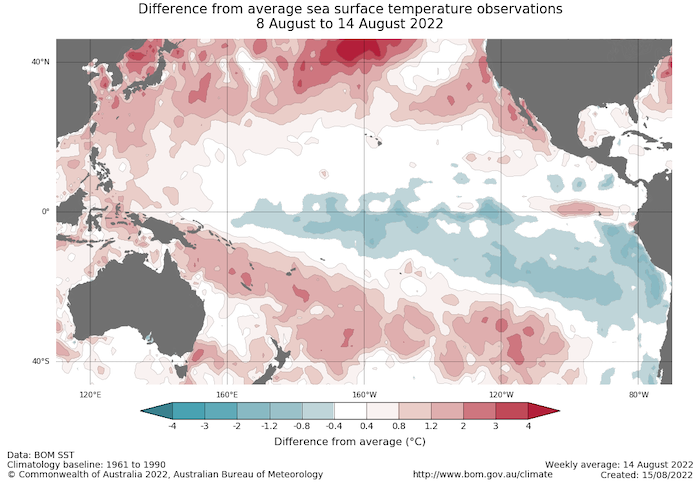
- One of the primary drivers of drought across the Southwest through winter and spring was a La Niña pattern in the Pacific.
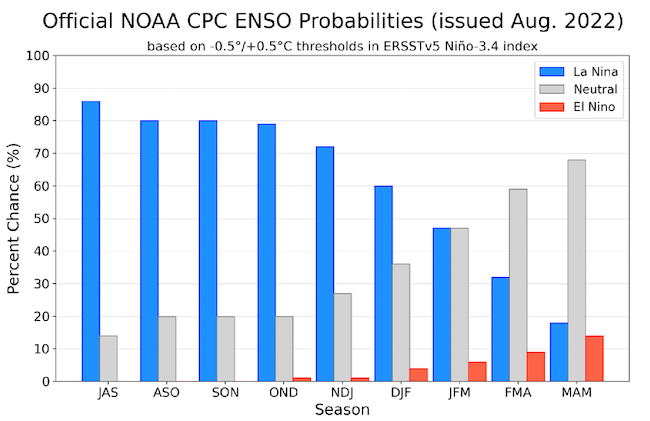
- The latest CPC ENSO discussion maintains a La Niña Advisory. La Niña is expected to continue, with chances for La Niña gradually decreasing from 86% in the coming season to 60% during December–February 2022–23. El Niño is unlikely.
- A third La Niña pattern in winter would favor another dry winter ahead for the Southern Plains and the Southwest U.S. (learn more).
- No two La Niña patterns are the same. For more information, please check out the NOAA El Niño–Southern Oscillation (ENSO) blog.
Sea Surface Temperature Anomalies (°C) for August 8–14, 2022
Probability of El Niño, La Niña, or Neutral Conditions
State-Based Conditions and Impacts
Arizona
- To date, the majority of the state has received at least 100% of monsoon precipitation (June 15 to August 26). More than half the state has received greater than 200% of monsoon precipitation.The largest outlier is the northeastern portion of Arizona, at roughly 50% of monsoon precipitation.
- Significant flooding has occurred in several portions of the state. The Gila River reached major flood stage in Duncan in eastern Arizona.
- Short-term drought has greatly improved, although the state has been in some measure of short-term drought or abnormally dry conditions since August 2020.
Colorado
- Colorado had the 5th warmest July monthly mean temperature on record and the warmest since 2012.
- While maximum temperatures were above average, the high mean temperature was strongly driven by a record high mean daily minimum temperature for the month: 55.9 ºF. This is 3.7 ºF above the long-term average for July and the highest monthly minimum of any month on record for Colorado.
- Except for the northwest corner of Colorado and large pockets of eastern Colorado, most of the state has had over one inch of precipitation for August, so far, including parts of Park, Teller, Summit, and Las Animas counties that have had over four inches in August 2022.
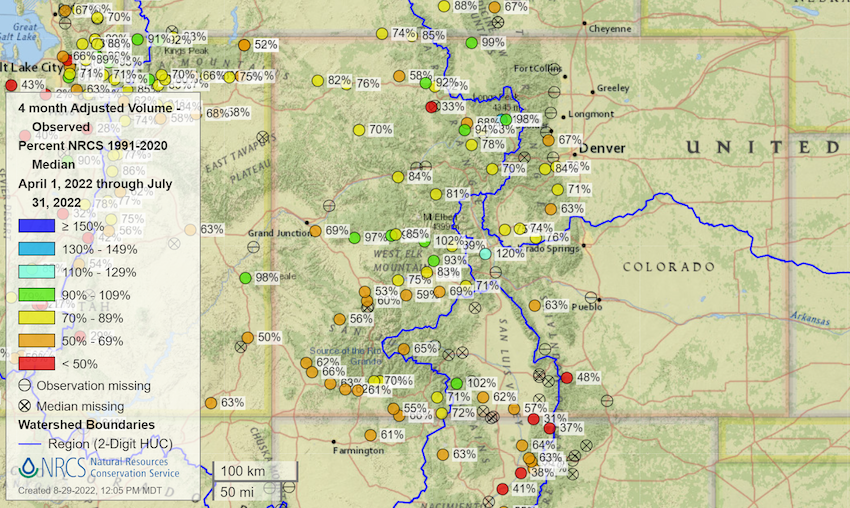
- Despite near-average water year to date precipitation, April–July streamflows were well below normal again. This is, in part, because the above-normal precipitation conditions occurred in summer when precipitation ultimately contributes much less to runoff.
New Mexico
- From May through mid-August, New Mexico, especially the western part of the state, has received 100% to 300% of normal rainfall for this period. At longer (6 to 12 month) timescales, long-term precipitation deficits remain.
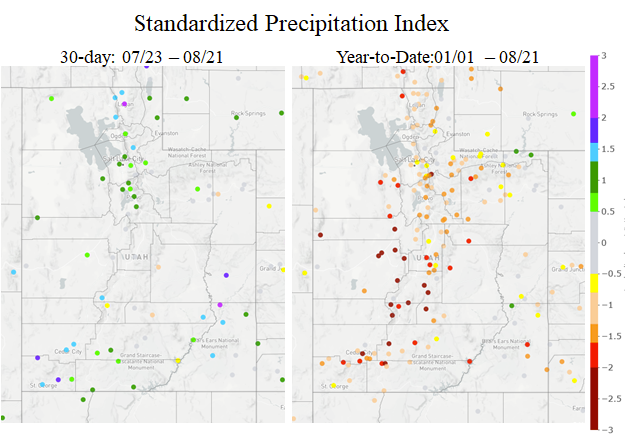
- Despite ample summer precipitation, the Standardized Precipitation Index for the water year-to-date (October 1, 2021—August 21, 2022) continues to show long-term drought.
- The Normalized Difference Vegetation Index (NDVI) shows a clear east/west divide in vegetative health with western New Mexico seeing a greenness response to the summer monsoon that eastern New Mexico has not.
Utah
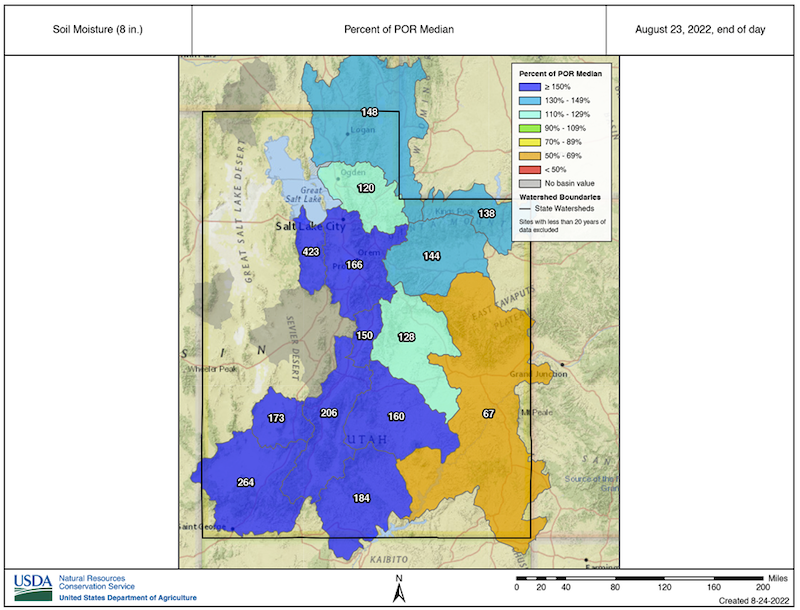
- A strong monsoon season extending all the way up to northern Utah has buffered short-term drought conditions for much of the state.
- Soil moisture conditions remain favorable heading into early Fall.
- Hydrologic, and to some degree, agricultural drought remains a significant concern, especially in southern and eastern Utah.
Wyoming
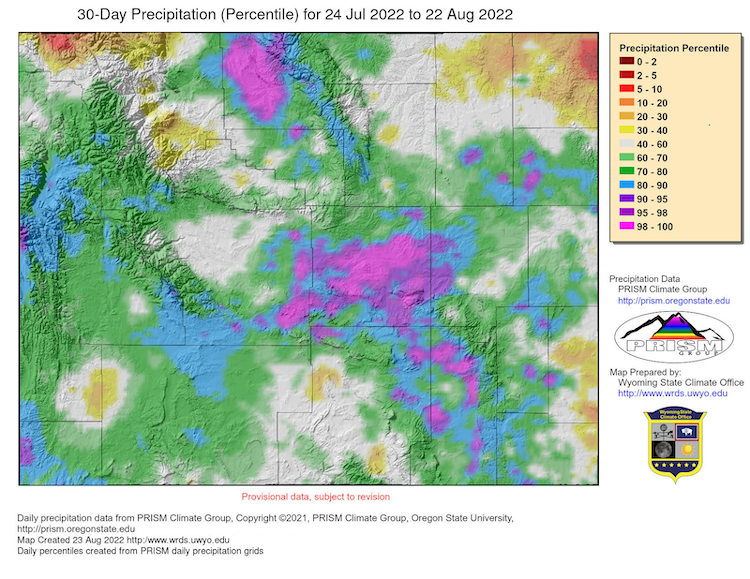
- Precipitation:
- Much of Wyoming has benefited from monsoonal moisture over the last 30 days.
- While some regions, especially the northwest and northeast, have missed out on the rains, the vast majority of the state received median or greater precipitation with some areas being at the 98th or better percentile over the 30-day period.
- A major storm in Laramie delivered as much as 2.73 inches in a 2-hour period, giving it, conservatively, a 1 in 400-year or greater return period. Wide-scale flooding was experienced in many parts of the city.
- Soil Moisture:
- Soil moisture has been worsening in the northeast. Southeastern Wyoming, especially, is of concern, where a large region has been below the 10th percentile since early June.
- Temperatures:
- Temperatures across the state of Wyoming have been mostly above average for the last 30 days.
- Small pockets at 0 to 3 degrees F below average occur in the far south and southwest as well as parts of the Wind River Range.
- Most of Wyoming was 0 to 3 degrees F above average for mean temperatures, with portions of the north at 3 to 6 degrees F above average.
- Drought:
- While drought has expanded in the north, the southern parts of Wyoming have seen some relief with many areas seeing improvements by one or more drought levels.
- At 1.59%, the level of D3 (Extreme Drought) is now the lowest since July 21, 2020, which was the first week that Wyoming experienced D3 conditions since October 2018.
For More Information
More local information is available from the following resources:
- Your state climatologist
- Your local National Weather Service office
- Western Water Assessment: Intermountain West Climate Dashboard
- Climate Assessment for the Southwest: Southwest Climate Outlook
In Case You Missed It
- July 21, 2022: 2022 Western Drought and Heat Webinar
Upcoming Events
- September 13, 2022, 1pm (MDT), Southwest Drought Briefing
Prepared By
Joel Lisonbee
NOAA/National Integrated Drought Information System (NIDIS)
Erin Saffell
Arizona State Climatologist/Arizona State University
Peter Goble
Colorado Climate Center/Colorado State University
Jon Meyer
Utah Climate Center/Utah State University
Tony Bergantino
Water Resources Data System – Wyoming State Climate Office
This drought status update is issued in partnership between the National Oceanic and Atmospheric Administration (NOAA), and the offices of the state climatologist for Arizona, Colorado, New Mexico, Utah and Wyoming. The purpose of the update is to communicate a potential area of concern for drought expansion and/or development within the Intermountain West based on recent conditions and the upcoming forecast. NIDIS and its partners will issue future drought status updates as conditions evolve.
