U.S. flag

An official website of the United States government

The U.S. government is closed. This site will not be updated; however, NOAA websites and social media channels necessary to protect lives and property will be maintained. To learn more, visit commerce.gov.

For the latest forecasts and critical weather information, visit weather.gov.

UC San Diego Scripps Institute of Oceanography Center for Western Weather and Water Extremes (CW3E) provides observation and forecast datasets, including integrated water transport, integrated water vapor, precipitation, snow, temperature, winds and height, isotherm, meteograms, and virtual RASS.

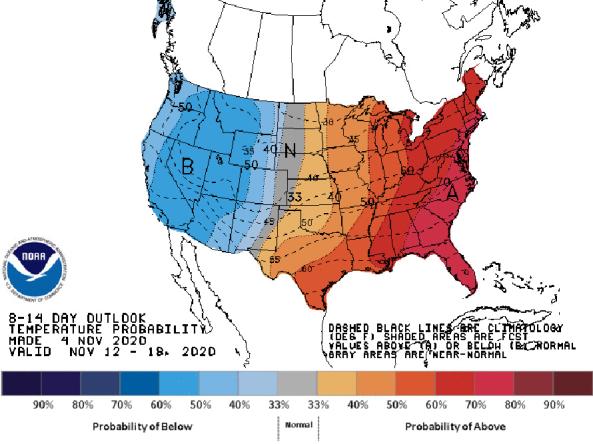
National Weather Service (NWS) Climate Prediction Center (CPC) generates outlooks that view probabilities of above- or below-normal temperature and precipitation maps at the 6-10 Day, 8-14 Day, Week 3-4, One Month, and Three Month timescales.

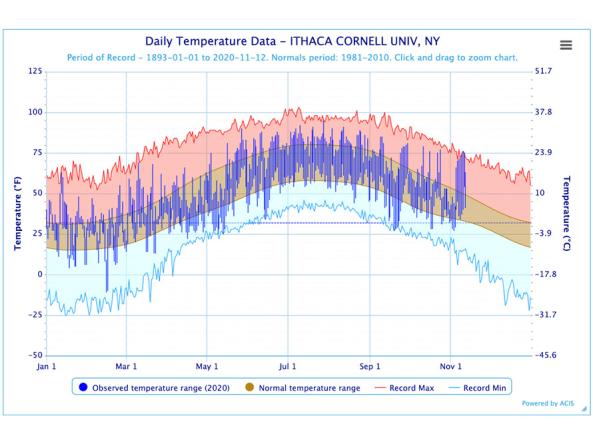
The Regional Climate Centers (RCC) Applied Climate Information System (ACIS) offers interactive temperature and precipitation charts with single- or multi-station capabilities.

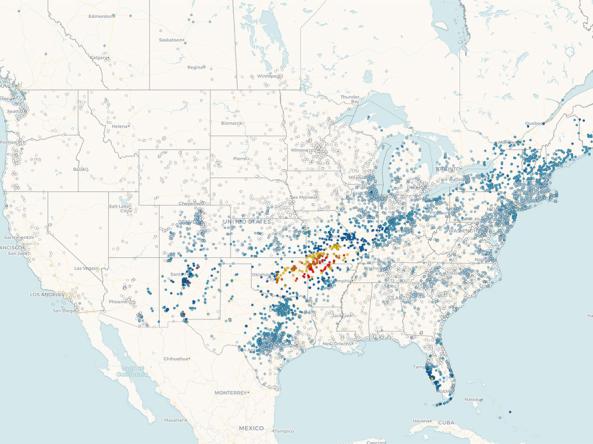
Precipitation data from CoCoRaHS: a non-profit, community-based network of volunteers of all ages and backgrounds working together to measure and map precipitation (rain, hail, and snow) across the U.S.

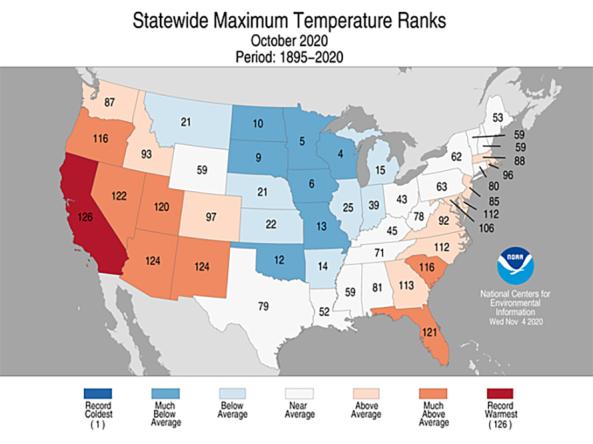
NCEI provides a variety of temperature and precipitation products available at the National and Global scale.

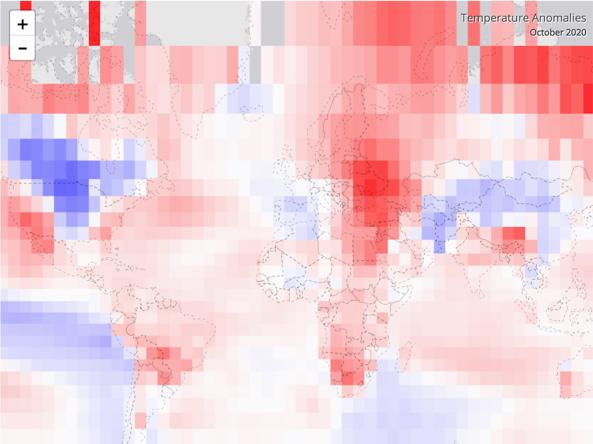
The NOAA NCEI Climate at a Glance (CAG) tool provides an analysis of monthly and annual temperatures for the globe and is intended for the study of climate variability and change.

Global Historical Climatology Network (GHCN): an integrated database of daily climate summaries from land surface stations across the globe, including a common suite of quality assurance reviews. 

The U.S. Drought Monitor (USDM) is a weekly map, released each Thursday, to show the location and intensity of drought across the country.

Published on

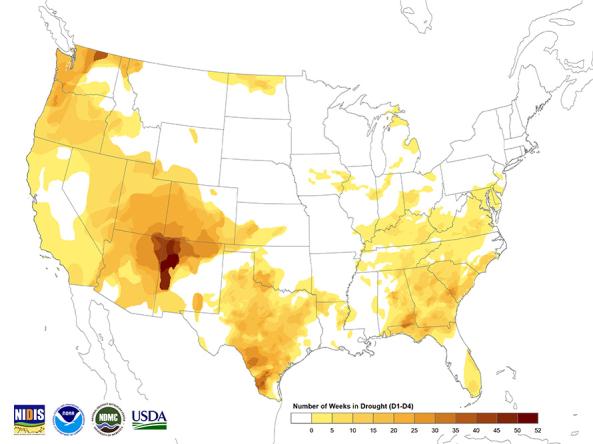
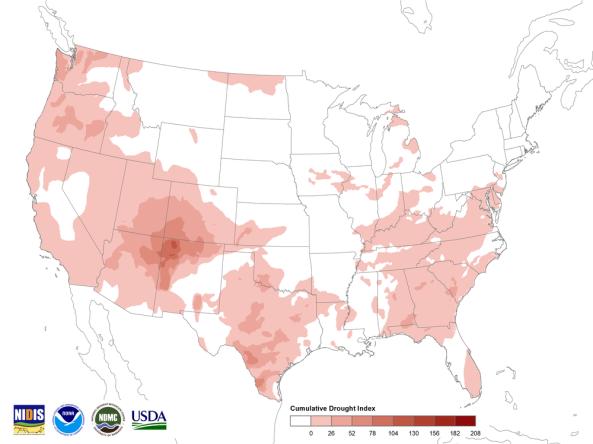
Including Weekly Maps from the U.S. Drought Monitor, the Most Intense Drought Map, the Weeks in Drought Map, the Cumulative Drought Index, the USDM 1 Year Change Map, the USDA Drought Designated Counties Map, the 12-Month SPI Map, the Annual Departure from Normal Precipitation Map, the Palmer Drought Severity Index, and the Soil Moisture Anomaly Monthly Maps.

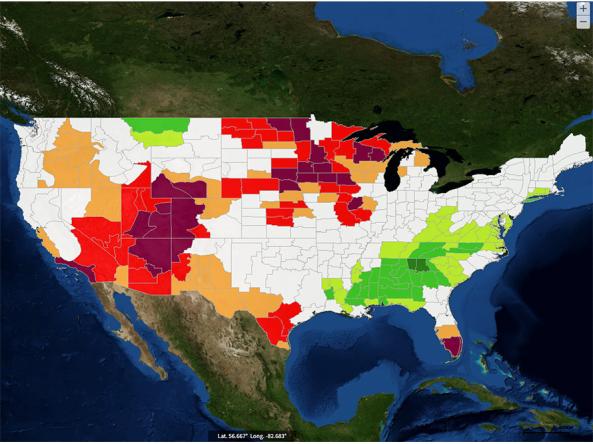
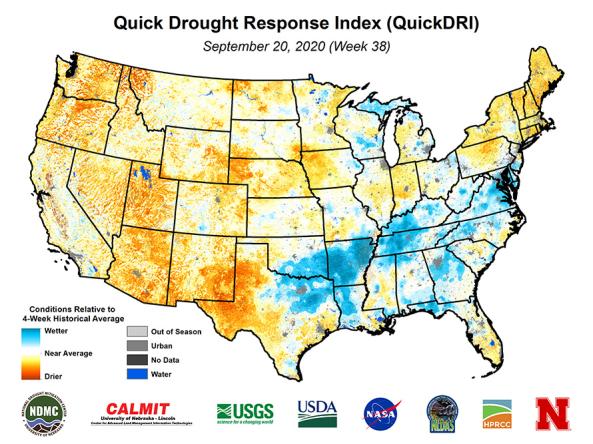
Quick Drought Response Index (QuickDRI): a geospatial tool that characterizes the intensification of short-term drought condition patterns on a weekly basis across the continental United States (CONUS) at a 1-km gridded spatial resolution.

Subscribe to Precipitation