U.S. flag

An official website of the United States government

The U.S. government is closed. This site will not be updated; however, NOAA websites and social media channels necessary to protect lives and property will be maintained. To learn more, visit commerce.gov.

For the latest forecasts and critical weather information, visit weather.gov.

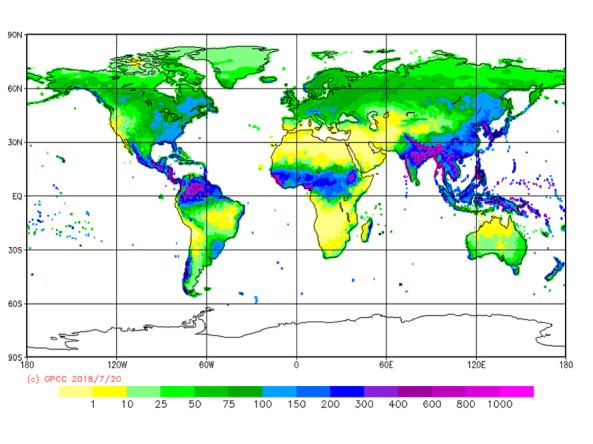
The GPCC provides unrestricted access to its monthly gridded precipitation data sets for climate monitoring purposes and related research.

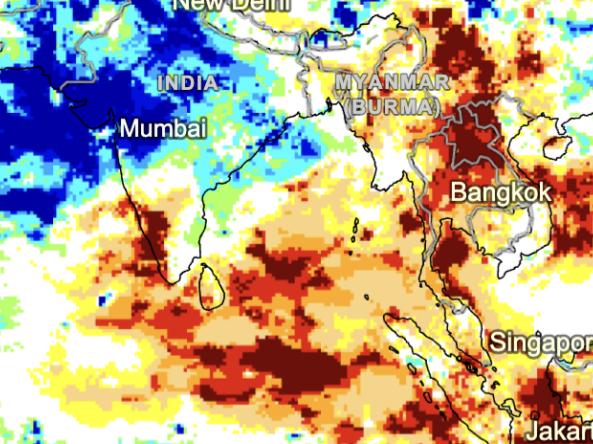
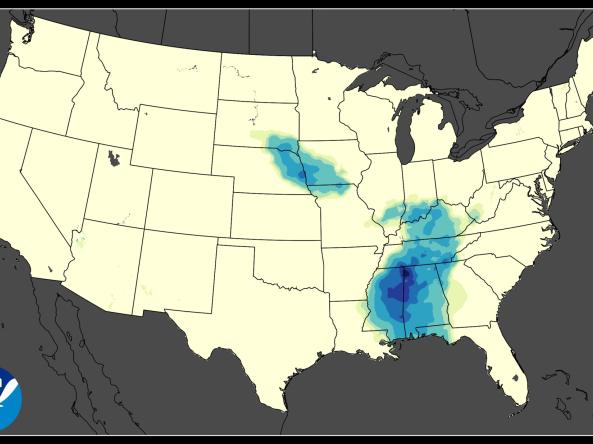
The NOAA Climate Prediction Center (CPC) Standardized Precipitation Index (SPI) a probabilistic index derived from North American Multi-Model Ensemble (NMME) precipitation data computed for several time scales, ranging from one month to 24 months. The Subseasonal Weekly Forecasts are based on the 3-month SPI and are produced at 1- 2- 3- and 4-week time scales.

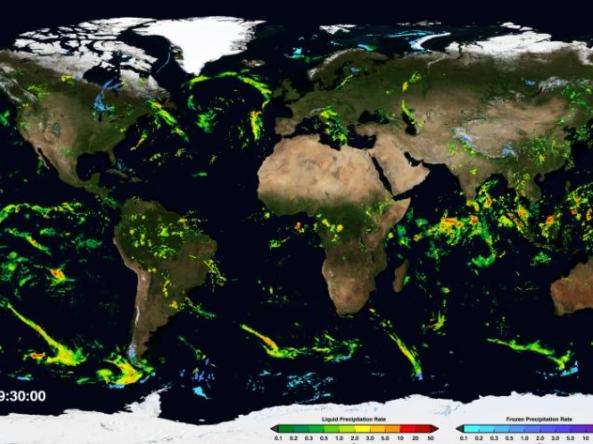
NASA GPM-IMERG: The Integrated Multi-satellitE Retrievals for GPM (IMERG) algorithm combines information from the GPM satellite constellation to estimate precipitation over the majority of the Earth's surface.  

ERA5 is the fifth generation ECMWF atmospheric reanalysis of the global climate covering the period from January 1940 to present. ERA5 is produced by the Copernicus Climate Change Service (C3S) at ECMWF.

Published on

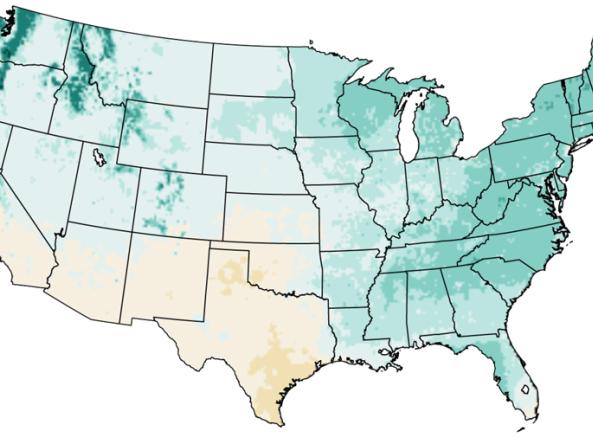
The Fifth National Climate Assessment (NCA5) is a resource to understand how drought will change as the climate changes, how we can adapt, and how future droughts might impact your region and livelihood. Check out these 10 maps and graphics to learn more about drought in a changing climate. 

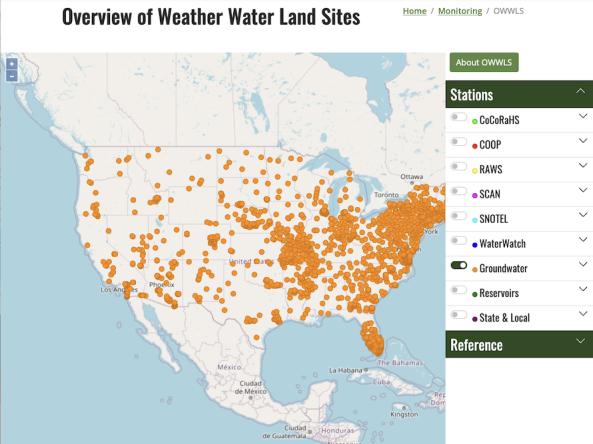
OWWLS, Overview of Weather Water Land Sites, maps the location of weather stations, streamgages, groundwater monitoring stations and reservoirs across the United States, Puerto Rico, and the U.S. Virgin Islands. 

Event Date
November 8, 2023

Louisiana, Mississippi, and Texas faced Exceptional Drought (D4) conditions for the past year. These have resulted in low river flows through the lower Mississippi River, record-setting fire conditions in Louisiana, and additional hardships for agriculture in the region. Watch the recap to learn more about current and forecasted drought conditions in the region.

Published on

When winter began, drought and dryness covered almost all of the Great Plains and West, and the snowfall in winter 2020-2021 didn’t do much to help conditions in the Western U.S. Explore drought conditions across the U.S. this winter in a series of 8 maps.

ACIS NRCC Interpolated (Grid 1) is a gridded dataset that includes area averages of daily maximum, minimum, and average temperatures and daily precipitation amounts for the contiguous United States from January 1, 1950 to the present.

Event Date
May 9, 2023

NOAA’s National Integrated Drought Information System (NIDIS), in partnership with NOAA’s National Centers for Environmental Information (NCEI) and National Weather Service’s Climate Prediction Center, hosted the 2023 Western Drought Webinar on May 9 to provide the latest information on current drought conditions and outlooks. Speakers from the U.S.

Subscribe to Precipitation