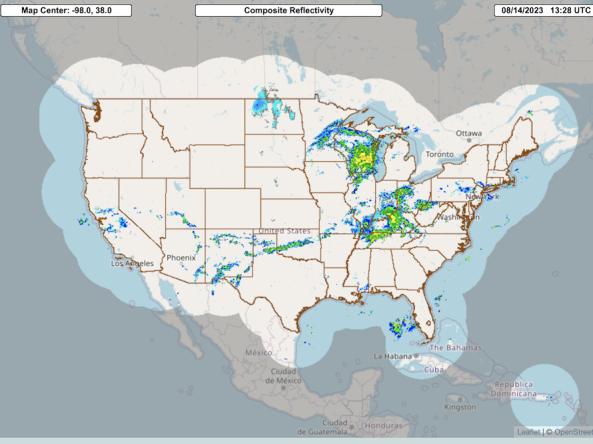
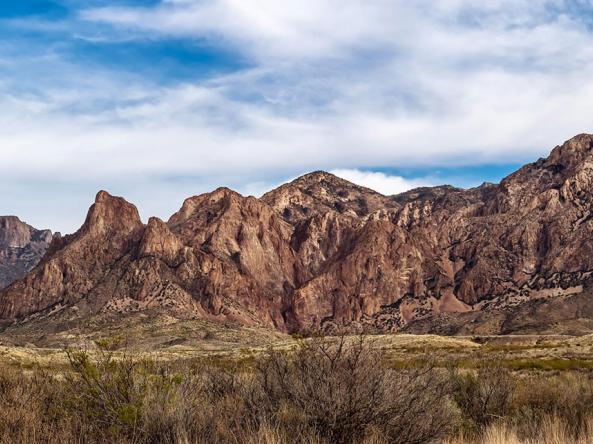
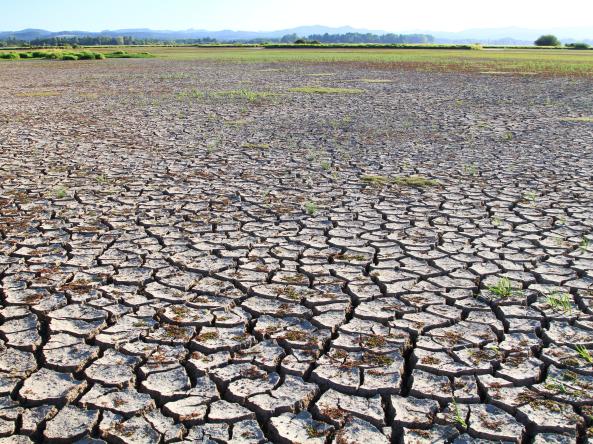
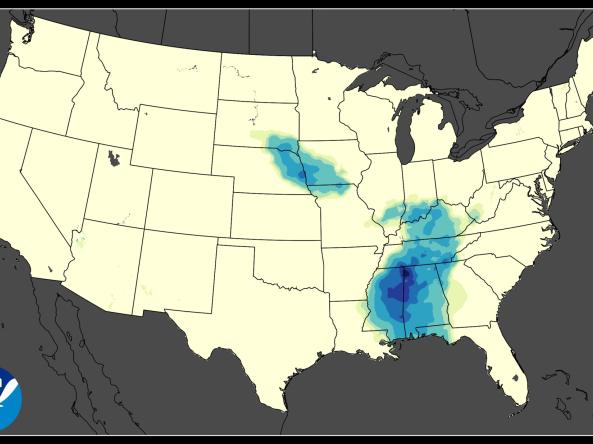
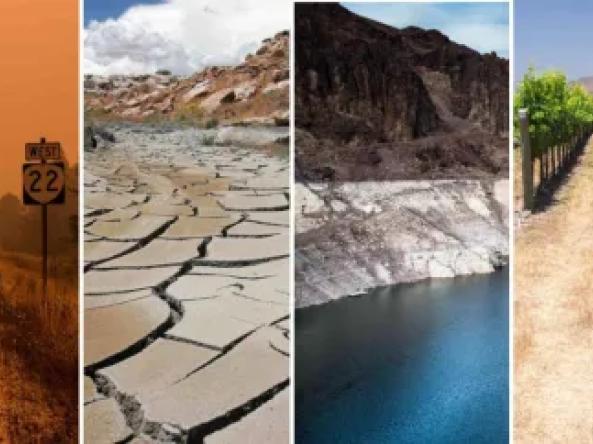
U.S. flag

An official website of the United States government

The U.S. government is closed. This site will not be updated; however, NOAA websites and social media channels necessary to protect lives and property will be maintained. To learn more, visit commerce.gov.

For the latest forecasts and critical weather information, visit weather.gov.

NASA GPM-IMERG: The Integrated Multi-satellitE Retrievals for GPM (IMERG) algorithm combines information from the GPM satellite constellation to estimate precipitation over the majority of the Earth's surface.  

The US Gridded Standardized Precipitation Index (SPI) is derived from the nClimGrid-Monthly dataset and includes timescales of 1, 2, 3, 6, 9, 12, 24, 36, 48, 60 and 72 months.

ERA5 is the fifth generation ECMWF atmospheric reanalysis of the global climate covering the period from January 1940 to present. ERA5 is produced by the Copernicus Climate Change Service (C3S) at ECMWF.

Event Date
May 9, 2023
12:00 pm - 1:30 pm
Location
Virtual

NOAA’s National Integrated Drought Information System (NIDIS), in partnership with NOAA’s National Centers for Environmental Information (NCEI) and National Weather Service’s Climate Prediction Center, is hosting the 2023 Western Drought Webinar on May 9 to provide the latest information on current drought conditions and outlooks. 

Event Date
November 14, 2022

From shipping to agriculture and fire, the current drought has caused major impacts across the South Central United States so far. The forecast of a third La Niña winter does not bode well for lingering drought across the southern U.S. 

The Multi-Radar Multi-Sensor System combines data streams from multiple radars, satellites, surface observations, upper air observations, lightning reports, rain gauges, and numerical weather prediction models to produce a suite of decision-support products every two minutes.

The Climate Prediction Center's Day 8–14 (Week 2) U.S. Hazards Outlook shows potential hazardous conditions related to temperature, precipitation, wind, snow, and rapid onset drought.

The US Gridded Standardized Precipitation Index (SPI) is derived from the nClimGrid-Daily dataset and and includes timescales of 1, 2, and 3 weeks, as well as 1, 2, 3, 4, 6, 9, and 12 months.

nClimGrid-Daily is a gridded dataset that includes area averages of daily maximum, minimum, and average temperatures and daily precipitation amounts for the contiguous United States from January 1, 1951 to the present.

Event Date
September 22, 2022
1:00 pm - 2:00 pm
Location
Virtual

This Midwest DEWS research webinar highlighted results from a NIDIS-funded research study that analyzed the rapid transitions in precipitation extremes in the Midwest. The goal of this research study, led by Dr. Trent Ford at the University of Illinois and Dr. Liang Chen at the University of Nebraska-Lincoln, was to improve our understanding of rapid transitions between precipitation extremes in the Midwest, their causes, and the future risk they pose to the region.

Subscribe to Precipitation