An official website of the United States government
Here’s how you know
The .gov means it’s official.
Federal government websites often end in .gov or .mil. Before sharing sensitive information, make sure you’re on a federal government site.
The site is secure.
The
https://
ensures that you are connecting to the official website and that any information you provide is encrypted and transmitted securely.
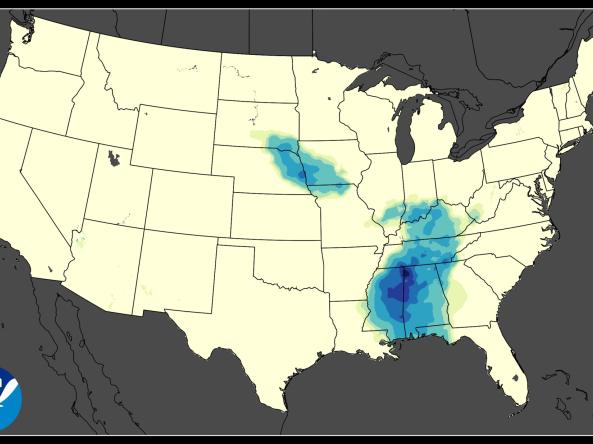
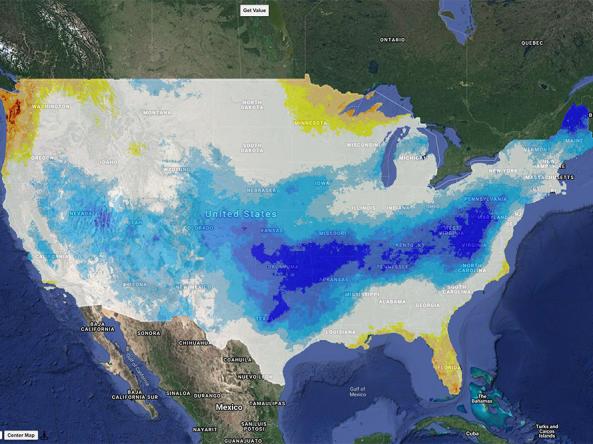
The NOAA Climate Prediction Center (CPC) Standardized Precipitation Index (SPI) a probabilistic index derived from North American Multi-Model Ensemble (NMME) precipitation data computed f
ACIS NRCC Interpolated (Grid 1) is a gridded dataset that includes area averages of daily maximum, minimum, and average temperatures and daily precipitation amounts for the contiguous Uni
The US Gridded Standardized Precipitation Index (SPI) is derived from the nClimGrid-Daily dataset and and includes timescales of 1, 2, and 3 weeks, as well as 1, 2, 3, 4, 6, 9, and 12 months.
nClimGrid-Daily is a gridded dataset that includes area averages of daily maximum, minimum, and average temperatures and daily precipitation amounts for the contiguous United States from Janua
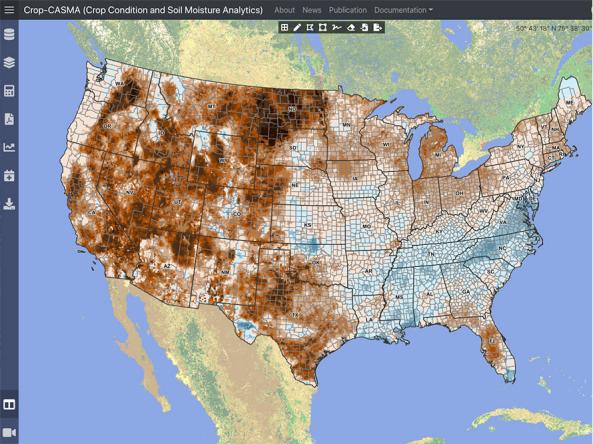
Crop-CASMA is a web-based geospatial application that provides access to high-resolution data from NASA SMAP and MODIS missions to map soil moisture and crop vegetation conditions a
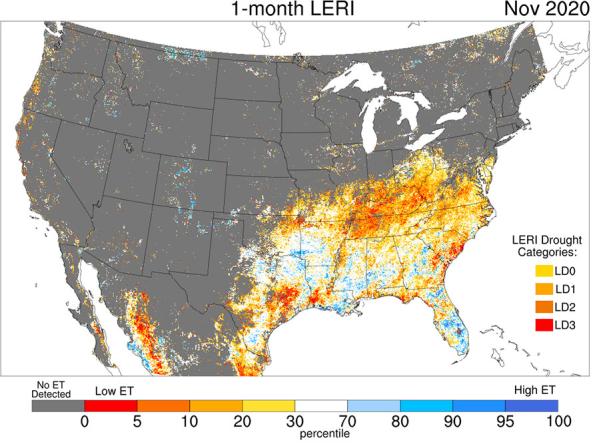
The Landscape Evaporative Response Index (LERI) is an experimental drought monitoring and early warning guidance tool that measures the anomaly in the actual evapotranspiration (ETa) from the
Evaporative Demand Drought Index (EDDI) subseasonal forecasts are available from the CFS-gridMET dataset at 4-km gridded resolution over the contiguous U.S.
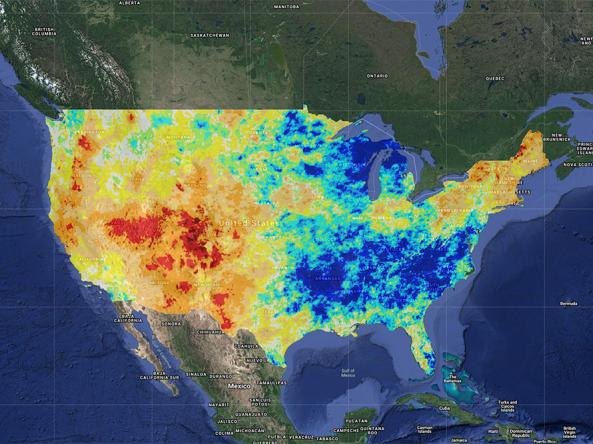
This new experimental implementation of the Palmer Drought Severity Index (PDSI) updates every 5 days using the high-resolution gridMET gridded research dataset and USDA STATSGO soil