Drought Expanded Across Portions of the Midwest in Fall
Long-Term Impacts to Streamflow Persist in Areas, Including the Mississippi River
Key Points
- Drought conditions expanded because of below-normal precipitation and above-normal temperatures this fall across portions of the Midwest. According to the U.S. Drought Monitor, 35% of the region is in Moderate to Extreme Drought (D1–D3), with Extreme Drought affecting parts of Illinois, Indiana, and Ohio.
- Drought impacts are typically less pronounced in the winter, but longer-term hydrologic impacts remain across portions of the Midwest. Streamflow is low across Missouri, Illinois, Indiana, northwest Ohio, and Michigan, including levels below the low-water threshold on the Mississippi River at Cairo, Illinois.
- Missouri livestock producers face poor pasture conditions and low pond levels, making them more reliant on supplemental feed and water.
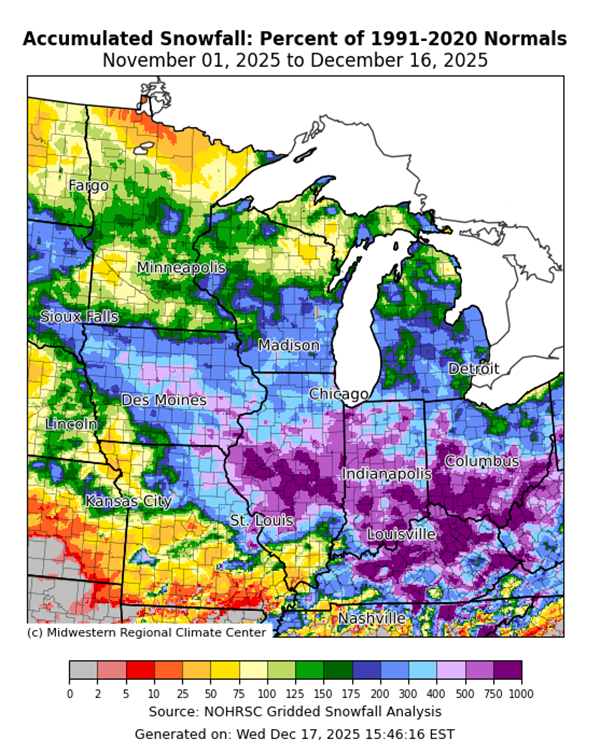
- Snowfall was above normal over the last 30 days across most of the region. However, the extreme cold can freeze water in place, which limits soil moisture and streamflow recovery until the snow melts.
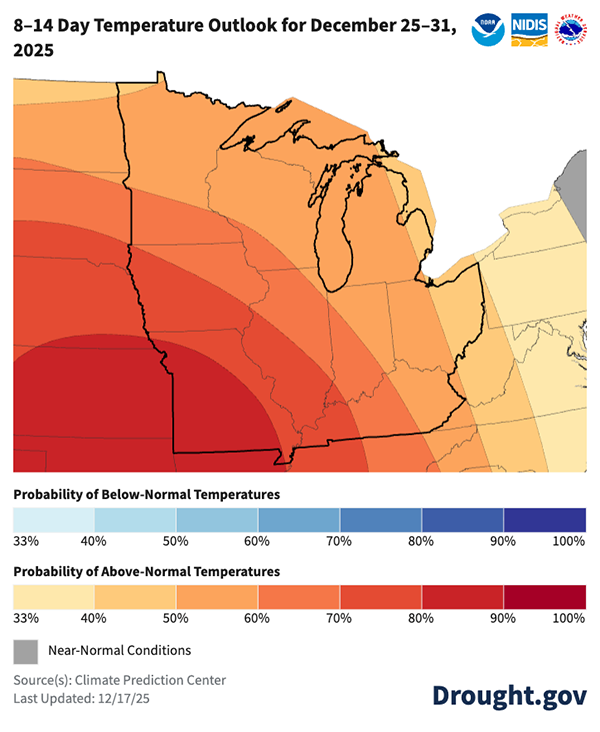
- Above-normal temperatures are expected through the end of December, which may allow snowmelt to replenish soil moisture and streamflow levels. However, sustained above-normal precipitation over the winter into spring is needed to eliminate lingering deficits. Winter precipitation is typically lower than in other seasons, and removing precipitation deficits during this season can be challenging.
This update is based on data available as of Thursday, December 18, 2025 at 8:00 a.m. CT. We acknowledge that conditions are evolving.
The U.S. Drought Monitor depicts the location and intensity of drought across the country. The map uses 5 classifications: Abnormally Dry (D0), showing areas that may be going into or are coming out of drought, and four levels of drought (D1–D4).
The U.S. Drought Monitor is a joint effort of the National Oceanic and Atmospheric Administration, U.S. Department of Agriculture, and National Drought Mitigation Center.
A drought index combines multiple drought indicators (e.g., precipitation, temperature, soil moisture) to depict drought conditions. For some products, like the U.S. Drought Monitor, authors combine their analysis of drought indicators with input from local observers. Other drought indices, like the Standardized Precipitation Index (SPI), use an objective calculation to describe the severity, location, timing, and/or duration of drought.
Learn MorePeriods of drought can lead to inadequate water supply, threatening the health, safety, and welfare of communities. Streamflow, groundwater, reservoir, and snowpack data are key to monitoring and forecasting water supply.
Learn MoreDrought can reduce the water availability and water quality necessary for productive farms, ranches, and grazing lands, resulting in significant negative direct and indirect economic impacts to the agricultural sector. Monitoring agricultural drought typically focuses on examining levels of precipitation, evaporative demand, soil moisture, and surface/groundwater quantity and quality.
Learn MoreU.S. Drought Monitor Categories
D0 - Abnormally Dry
Abnormally Dry (D0) indicates a region that is going into or coming out of drought. View typical impacts by state.
D1 - Moderate Drought
Moderate Drought (D1) is the first of four drought categories (D1–D4), according to the U.S. Drought Monitor. View typical impacts by state.
D2 - Severe Drought
Severe Drought (D2) is the second of four drought categories (D1–D4), according to the U.S. Drought Monitor. View typical impacts by state.
D3 - Extreme Drought
Extreme Drought (D3) is the third of four drought categories (D1–D4), according to the U.S. Drought Monitor. View typical impacts by state.
D4 - Exceptional Drought
Exceptional Drought (D4) is the most intense drought category, according to the U.S. Drought Monitor. View typical impacts by state.
Total Area in Drought (D1–D4)
Percent area of the Midwest that is currently in drought (D1–D4), according to the U.S. Drought Monitor.
The U.S. Drought Monitor depicts the location and intensity of drought across the country. The map uses 5 classifications: Abnormally Dry (D0), showing areas that may be going into or are coming out of drought, and four levels of drought (D1–D4).
The U.S. Drought Monitor is a joint effort of the National Oceanic and Atmospheric Administration, U.S. Department of Agriculture, and National Drought Mitigation Center.
The U.S. Drought Monitor is released every Thursday morning, with data valid through the previous Tuesday at 7 a.m. ET.
A drought index combines multiple drought indicators (e.g., precipitation, temperature, soil moisture) to depict drought conditions. For some products, like the U.S. Drought Monitor, authors combine their analysis of drought indicators with input from local observers. Other drought indices, like the Standardized Precipitation Index (SPI), use an objective calculation to describe the severity, location, timing, and/or duration of drought.
Learn MorePeriods of drought can lead to inadequate water supply, threatening the health, safety, and welfare of communities. Streamflow, groundwater, reservoir, and snowpack data are key to monitoring and forecasting water supply.
Learn MoreDrought can reduce the water availability and water quality necessary for productive farms, ranches, and grazing lands, resulting in significant negative direct and indirect economic impacts to the agricultural sector. Monitoring agricultural drought typically focuses on examining levels of precipitation, evaporative demand, soil moisture, and surface/groundwater quantity and quality.
Learn MoreCurrent Conditions and Impacts for the Midwest
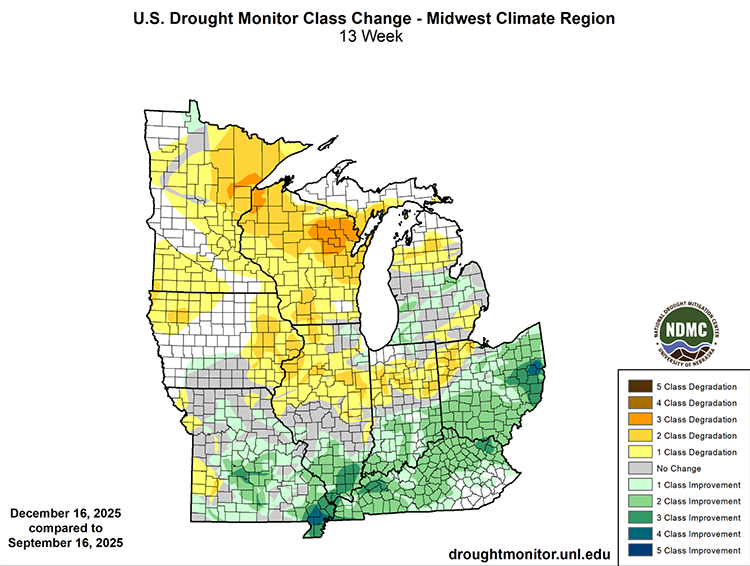
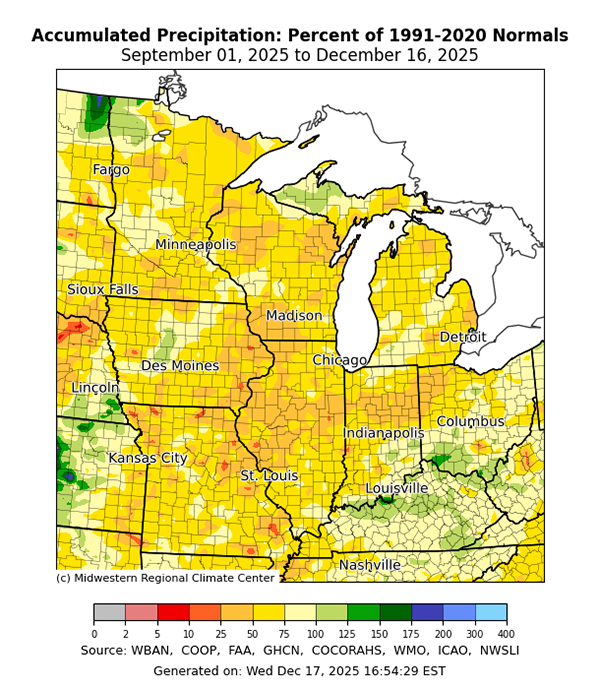
- Drought conditions worsened September–November across central and northern portions of the Midwest, driven by widespread below-normal precipitation. Precipitation was only 25-50% of normal in some areas.
- According to the U.S. Drought Monitor, 35% of the region is currently experiencing Moderate to Extreme Drought (D1-D3), which is 21% more than in early September.
- The most intense conditions in the Midwest are Extreme Drought (D3) across northwest Ohio, northern Indiana, and east-central Illinois, which has persisted since early October.
- Extreme cold has encapsulated the region so far this December. These cold temperatures can freeze water in place. Because much of the precipitation fell as snow, the freezing conditions limited its ability to improve soil moisture or streamflow until the snow melts.
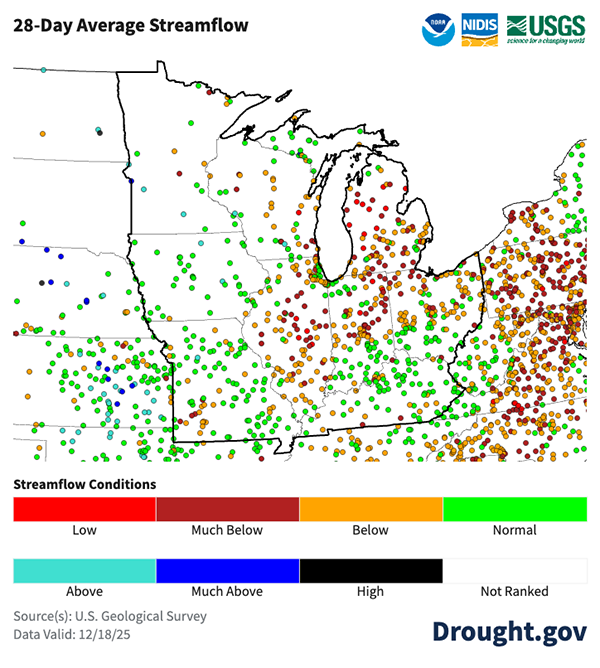
- Drought impacts are typically less pronounced during the winter, but some significant impacts remain across the region, including longer-term hydrologic problems like low streamflow. Streamflows are low across Illinois, Indiana, northern Ohio, Michigan, and southwest Missouri.
- The Mississippi River at Cairo, Illinois is low and expected to see a brief return to normal around Christmas Day before again dropping to low water thresholds. The River is currently below its 10.3-foot low-water threshold, expected to rise to 14.5 feet near December 25, then drop to 6.4 feet by mid-January. The record-low level at Cairo is 4.5 feet (in 2023). Low water caused navigational issues on the Mississippi River near Hickman and Memphis earlier this month.
- Conditions are difficult for Missouri livestock producers. Surface ponds are very low, and pasture and range conditions are very poor. Producers have been using supplemental water and feed for livestock for over a month.
- In Missouri, the governor extended Missouri’s drought alert through April 1, 2026. It was previously set to expire on December 1. The drought alert now covers 106 counties across most of the state. This executive order allows state agencies to direct resources to those struggling with drought impacts across Missouri.
- Decatur, Illinois implemented Stage 1 Water Restrictions in mid-November for the first time since 2012. Stage 1 Water Restrictions include limits to pumping water for irrigation, filling swimming pools, washing vehicles, and vegetation watering restrictions on certain days of the week.
- This fall, drier conditions across the Great Lakes Basin led to below-average water levels on all lakes by the end of November. Although seasonal declines are typical, water levels fell faster than normal. Lake Michigan–Huron was about 11 inches below normal and saw its 8th largest fall decline on record since 1900. Lake Erie experienced its 13th largest fall decline.
Drought Expanded Across Upper Midwest this Fall, Improved in the South
Below-Normal Precipitation Across Majority of Midwest this Fall
Low Streamflow Across Portions of the Midwest Moving into Winter
Above-Normal Snowfall to Start the Winter Season
Outlooks and Potential Impacts in the Midwest
- The 8-14 Day Outlook for December 25–31 shows increased chances of above-normal temperatures, which will lead to snowmelt and likely some recharge to soil moisture and streamflow levels. Precipitation during this time will likely be below- to near-normal across much of the Midwest.
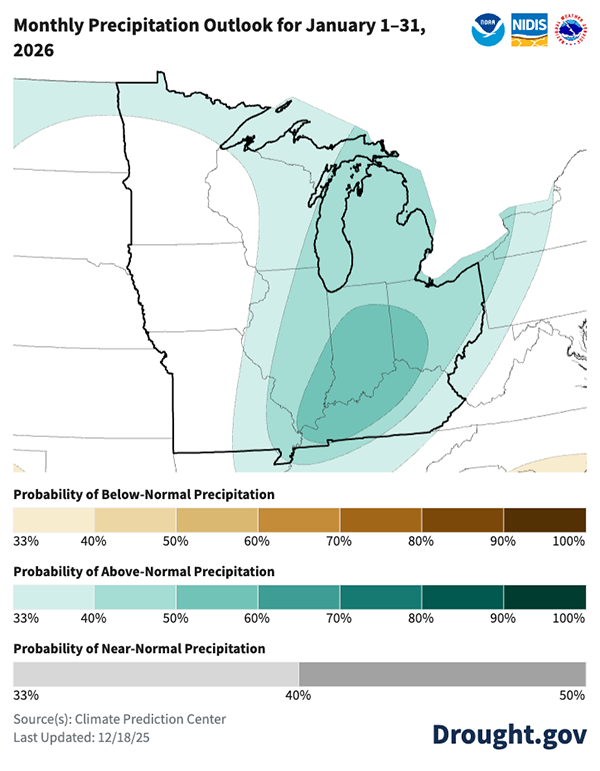
- The precipitation outlook for January 2026 shows increased chances for above-normal precipitation across a majority of the region, particularly over the Ohio River Basin. Far western portions of the region (Missouri, Iowa, and Minnesota) have equal chances for above-, near-, or below-normal precipitation.
- Even in areas that receive near- to above-normal precipitation this winter, winter precipitation across the region is typically low. This can make it difficult to remove drought deficits in the winter. For areas across the Upper Midwest with persistent frozen ground in the winter months, the moisture benefits from snow will not be realized until the spring snowmelt.
Above-Normal Temperatures Through End of the Year
Near to Above-Normal Precipitation Likely in January
Resources
- More local information is available from the following resources:
- To report or view local drought impact information:
Prepared By
Molly Woloszyn
Cooperative Institute for Research in Environmental Sciences/NOAA National Integrated Drought Information System (NIDIS)
Melissa Widhalm
Midwestern Regional Climate Center/Purdue University
Emilie Nipper
NOAA National Weather Service/U.S. Army Corps of Engineers Mississippi Valley Division
Ketzel Levens
NOAA National Weather Service Duluth Weather Forecast Office
Denise Gutzmer
National Drought Mitigation Center
The following people also contributed to the development of this report: Austin Pearson (Midwestern Regional Climate Center/Purdue University), Jim Noel and Molly Peters (NOAA National Weather Service Ohio and North Central River Forecast Centers), Trent Ford (University of Illinois) and Dennis Todey (U.S. Department of Agriculture Midwest Climate Hub).
A special thank you to the state climate offices and National Weather Service offices in the Midwest region for providing local information on drought conditions and impacts included in this Drought Status Update.
This Drought Status Update is issued in partnership between the National Oceanic and Atmospheric Administration (NOAA), U.S. Department of Agriculture (USDA), U.S. Army Corps of Engineers (USACE), and the National Drought Mitigation Center to communicate a potential area of concern for drought expansion and/or development within the Midwest region based on recent conditions and the upcoming forecast. NIDIS and its partners will issue future Drought Status Updates as conditions evolve. NIDIS is an interagency program within the Climate Program Office, which is part of NOAA's Office of Oceanic and Atmospheric Research.


