Drought – and Its Impacts – Intensify Across the Midwest and May Persist.
Due to the rapidly drying conditions across the Midwest and consequent impacts, we will hold a special North Central U.S. Drought and Climate Outlook webinar on Thursday, July 6th at 1pm Central. Register here.
Key Points
- Drought has rapidly intensified across the Midwest region over the last five weeks. According to the U.S. Drought Monitor, 58% of the Midwest is now in moderate to extreme drought (D1-D3), compared to just 8% five weeks ago. Areas with the most rapid deterioration in conditions include central/northern Illinois, western Indiana, eastern Iowa, central Michigan, central Minnesota, and east-central Wisconsin.
- Significantly below-normal precipitation has been the main driver for the rapid intensification of drought conditions. Some areas have had multiple days of hot temperatures as well, which allows for more moisture to be extracted from the surface through evapotranspiration.
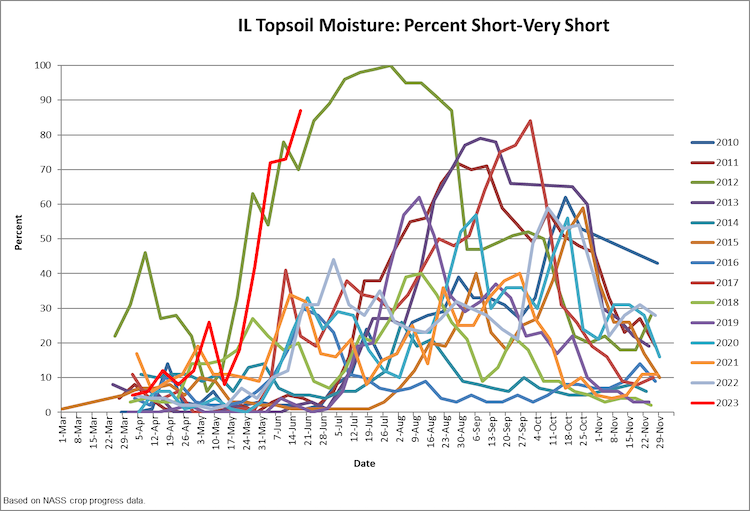
- Soil moisture is reported to be very low across much of the Midwest. According to the USDA National Agricultural Statistics Service, the percent of topsoil in Illinois that is rated as short to very short currently surpasses levels at this time in 2012, during the last major regional drought.
- Drought impacts continue to multiply across various sectors in the region including significant impacts to vegetation, agriculture, water supply, forestry and fire. Many people, agencies and sectors are taking action to address the impacts being felt.
- Dry conditions across the entire Mississippi River Basin (including the Missouri and Ohio basins) are driving well below average (15+ feet) river stages throughout the Lower Mississippi River from St. Louis, Missouri all the way to the Gulf of Mexico, where low river stages are already causing issues and increased concerns for shipping.
- Long-range river forecasts from the NOAA River Forecast Centers indicate that the Mississippi River will reach low water stages just downstream of the Ohio/Mississippi confluence area as early as 1-2 weeks from now.
- Rainfall is crucial to alleviate drought concerns and impacts across the Midwest, particularly as corn pollination begins in early July. If corn-growing areas do not start receiving rainfall now, there will likely be impacts to corn yields, and potentially other crops as well. Water supply for livestock and municipalities in some areas is also a major concern if drought conditions persist.
- There is uncertainty in the summer outlook on whether precipitation will be above, near, or below normal. The U.S. seasonal drought outlook for June 15-September 30 shows that drought is likely to persist and potentially expand across the Midwest this summer.
As conditions evolve, accurate reports on conditions and drought impacts are critical. Whether your area is currently wet, close to normal, or dry, please consider reporting conditions and any drought impacts you see or hear via the Condition Monitoring Observer Reports (CMOR) from the National Drought Mitigation Center. If you are already a CoCoRaHS observer, we encourage you to submit a Condition Monitoring Report.
The U.S. Drought Monitor depicts the location and intensity of drought across the country using 5 classifications: Abnormally Dry (D0), showing areas that may be going into or are coming out of drought, and four levels of drought (D1–D4).
The U.S. Drought Monitor is a joint effort of the National Drought Mitigation Center, U.S. Department of Agriculture, and National Oceanic and Atmospheric Administration.
This map depicts drought conditions across the Midwest U.S. as of June 20, 2023.
U.S. Drought Monitor Categories
Abnormally Dry (D0)
Abnormally Dry (D0) indicates a region that is going into or coming out of drought. View typical impacts by state.
Moderate Drought (D1)
Moderate Drought (D1) is the first of four drought categories (D1–D4), according to the U.S. Drought Monitor. View typical impacts by state.
Severe Drought (D2)
Severe Drought (D2) is the second of four drought categories (D1–D4), according to the U.S. Drought Monitor. View typical impacts by state.
Extreme Drought (D3)
Extreme Drought (D3) is the third of four drought categories (D1–D4), according to the U.S. Drought Monitor. View typical impacts by state.
Exceptional Drought (D4)
Exceptional Drought (D4) is the most intense drought category, according to the U.S. Drought Monitor. View typical impacts by state.
The U.S. Drought Monitor depicts the location and intensity of drought across the country using 5 classifications: Abnormally Dry (D0), showing areas that may be going into or are coming out of drought, and four levels of drought (D1–D4).
The U.S. Drought Monitor is a joint effort of the National Drought Mitigation Center, U.S. Department of Agriculture, and National Oceanic and Atmospheric Administration.
This map depicts drought conditions across the Midwest U.S. as of June 20, 2023.
The U.S. Drought Monitor is updated weekly on Thursdays, with data valid through the previous Tuesday at 7 a.m. Eastern.
Current Conditions
- Drought has rapidly intensified across the Midwest region over the last five weeks (Figure 1). According to the U.S. Drought Monitor, 58% of the Midwest is now in moderate to extreme drought (D1–D3), compared to just 8% five weeks ago.
- Drought is most intense across Missouri and southern/western Iowa, where there are patches of extreme drought (D3). Severe drought (D2) has developed rapidly across central/northern Illinois, western Indiana, central Michigan, central Wisconsin, eastern Iowa, and east-central Minnesota over the last four weeks. Many of these locations were not even considered abnormally dry in the May 23 U.S. Drought Monitor, showing how quickly conditions have deteriorated.
- Significantly below-normal precipitation has been the main driver for the rapid intensification of drought conditions. Some areas have had multiple days of hot temperatures as well, which allows for more moisture to be extracted from the surface through evapotranspiration. In the absence of additional rainfall, conditions can dry out very quickly.
- Portions of the central Midwest (Illinois, Michigan, Minnesota, Wisconsin) have only received 0.1–0.5 inches of precipitation in the last 30 days (Figure 2), which is 2–4 inches below normal for this time of year (Figure 3). Figure 3 also shows that below-normal precipitation was widespread across the region over the last 30 days.
- Average temperatures over the last 30 days have been a mix of above normal (Minnesota, Wisconsin, Iowa), near normal (Illinois, Missouri, Michigan, Indiana), and below normal (Kentucky, Ohio) (Figure 4). The seasonal to seasonably cool temperatures have eased some crop stress. However, the air has also been very dry, leading to increased crop water use/evaporation.
- Soil moisture is reported to be very low across much of the Midwest. According to reports from the USDA, topsoil moisture is short to very short across 89% of agricultural land in Michigan, 87% of Illinois, 71% of Wisconsin, and 70% of Iowa (Figure 5). Figure 6 shows that in Illinois, the percent of topsoil rated as short to very short currently surpasses levels in 2012, when the last major drought affected the region.
Figure 1. 5-Week U.S. Drought Monitor Change Map (since May 16, 2023)
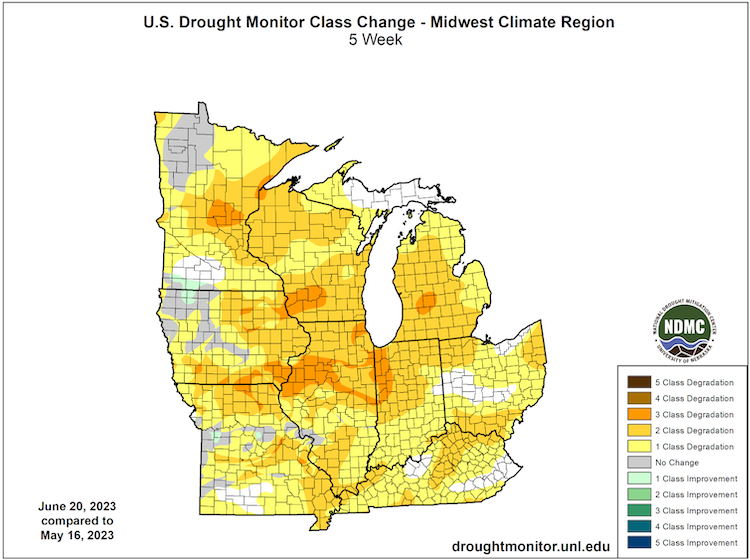
Figure 2. 30-Day Accumulated Precipitation (inches) (May 24–June 22, 2023)
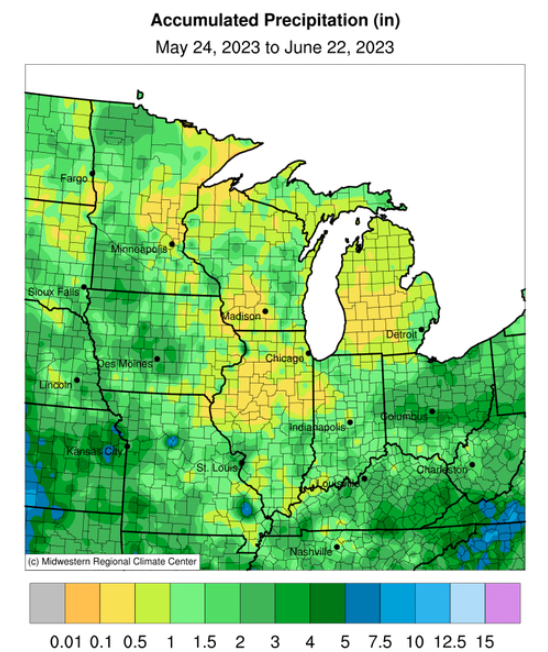
Figure 3. 30-Day Departure from Normal Precipitation (inches) (May 24–June 22, 2023)
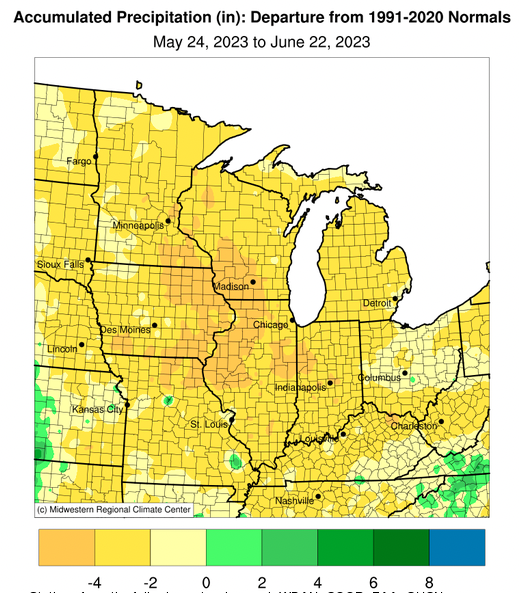
Figure 4. 30-Day Departure from Normal Temperature (May 24-June 22, 2023
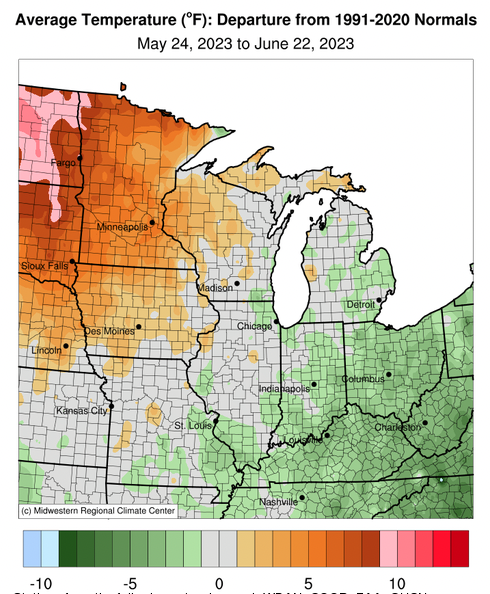
Figure 5. Topsoil Moisture (Percent Rated Short to Very Short) – Week ending June 18, 2023
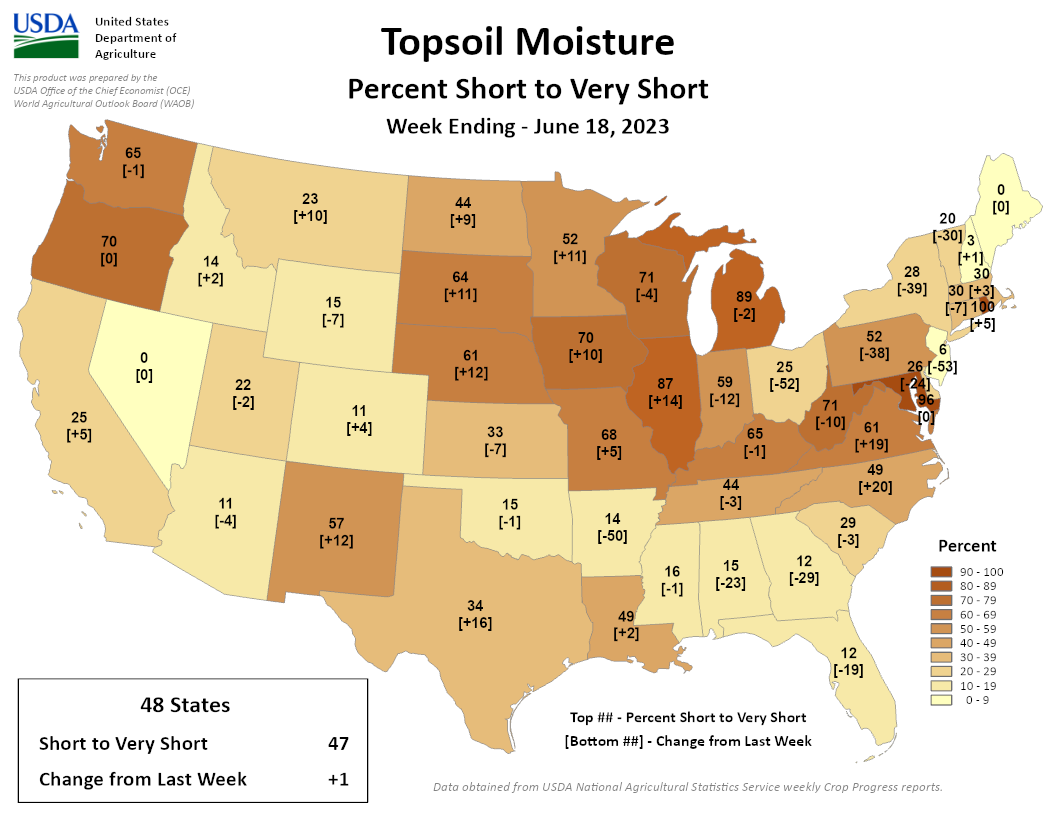
Figure 6. Illinois Topsoil Moisture (Percent Rated Short to Very Short) from 2010-2023
Hydrological Conditions and Impacts
- Dry conditions across the entire Mississippi River Basin (including the Missouri and Ohio basins) are driving well below average (15+ feet) river stages throughout the Lower Mississippi River from St. Louis, Missouri all the way to the Gulf of Mexico, where low river stages are becoming increasingly concerning.
- There have been multiple reports of groundings of barge traffic on the Lower Mississippi River, below Cairo, Illinois. Barge companies are now mandating reductions on loads, implementing draft restrictions and are reducing tow sizes (10%–20% reduction in tow capacity for barges).
- The U.S. Army Corps of Engineers is working to maintain the 9-foot navigation channel on the river below St. Louis. Dredge boats and crews are prioritizing the trouble spots and addressing those first. There are one-way traffic restrictions just above St. Louis due to low water conditions, and surveying is being done at potential trouble areas.
- While conditions on the Lower Mississippi River are not as bad as they were last fall, the low water season does not usually begin until late July into August, which is concerning as the climatological low-flow season is still yet to come.
Agriculture and Other Impacts
- Drought impacts continue to multiply across various sectors in the region including significant impacts to vegetation, agriculture, water supply, forestry, and increasing fire risk. Many people, agencies, and sectors are taking action to address the impacts being felt.
- Intensifying dryness is affecting crops as drought covers 64% of corn production (nationally), 57% of soybean production, and 55% of sorghum production. According to the USDA National Agricultural Statistics Service, corn rated as poor to very poor has increased over the last week by 11% in Illinois and 8% in Michigan and Wisconsin (Figure 7). Corn leaves are curling in many areas, which is a sign that the plant is stressed and trying to conserve moisture.
- In mid-June, Missouri Governor Mike Parson announced emergency access to water and hay for farmers amid drought conditions in the state. Farmers in need of hay and water may get water from 25 state parks and 36 Missouri Department of Conservation areas, and access hay from 17 state parks. A producer in northwest Missouri, who has been farming there since 1974, said that the last time he saw drought conditions this intense was in the drought of 1988. Producers in Missouri and other Midwest states are selling livestock in response to the lack of water and feed.
- Specialty crop farmers in Indiana, Michigan, Wisconsin, and Minnesota are having to use irrigation to keep specialty crops alive, including strawberries, apple trees, and raspberries. Planted pumpkins on farms near Duluth are not growing due to drought conditions.
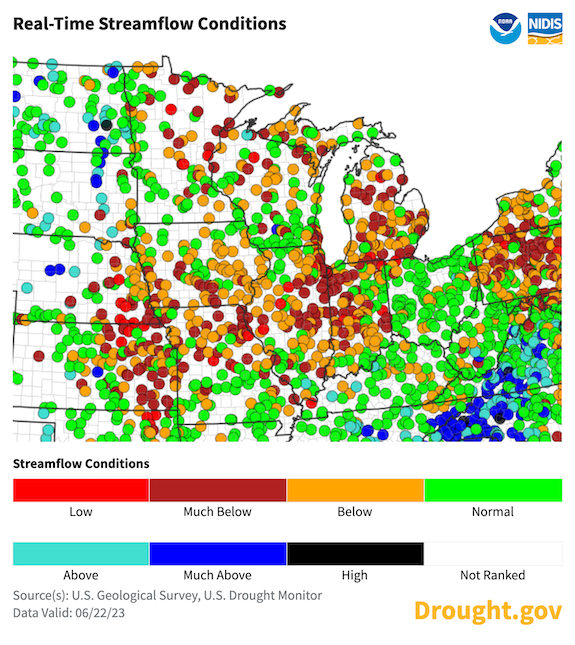
- Water supply and access has become an increasing issue in many areas. Many ponds, streams, and rivers are very low for this time of year (Figure 8 shows streamflow). Groundwater is being impacted in some areas as there are reports of wells going dry (Wisconsin, Iowa, Missouri). Some cities in Iowa, Missouri, Illinois, Indiana, and Michigan are implementing water conservation measures.
- Burn bans have been issued across portions of Illinois, Indiana, Iowa, Michigan, Minnesota, and Ohio in response to the drought conditions and increased fire risk. In early June, a wildfire was fueled by the drought conditions in northern Michigan and burned over 2,400 acres.
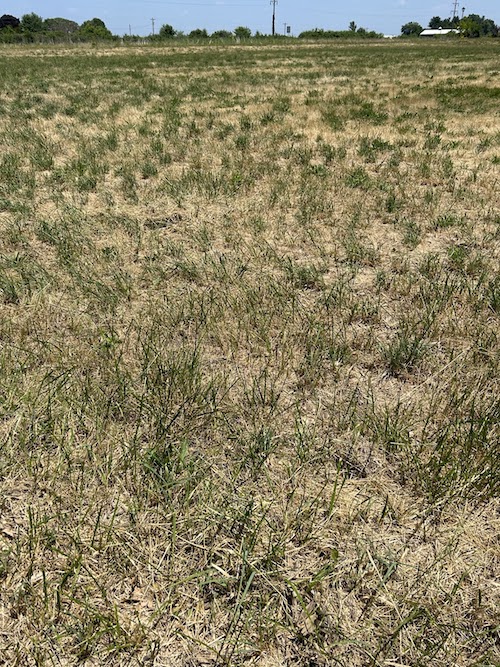
- Lawns across the region are browning or fully dormant, gardens are stressed, and lawn care companies are experiencing reduced income from lack of mowing needs. Newly planted trees and even some well-established trees are showing signs of drought stress as well (reports from Illinois and Indiana).
Figure 7. Corn Conditions (Percent Poor to Very Poor) – As of June 18, 2023
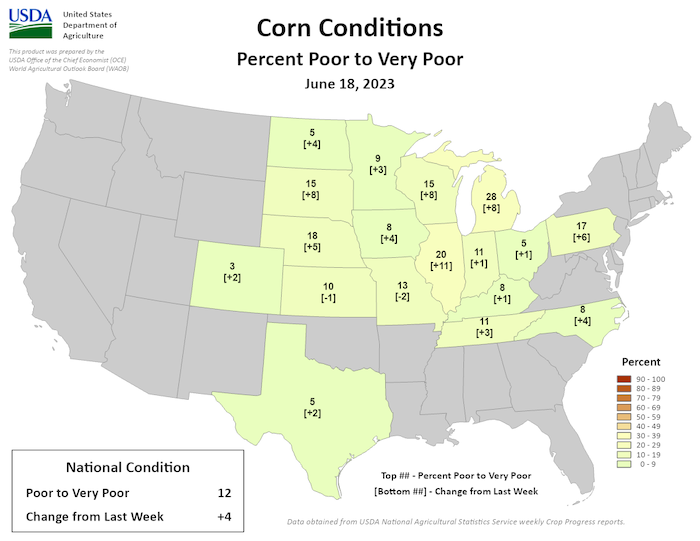
Figure 8. Streamflow Conditions (Valid June 22, 2023)
Outlook and Potential Impacts
- The short-term 8–14 day outlook for June 30-July 6 shows the chance for above-normal and near-normal precipitation across the Midwest (Figure 9). However, much of Illinois, Michigan, and Wisconsin are only expected to get near-normal precipitation, which would be helpful to alleviate some negative impacts, but not all (e.g., some rain might help corn, but likely will not increase streamflows because of the dry soils).
- Temperatures from June 30–July 6 will likely be a mix of above, near, and below normal across the region. Below-normal temperatures would be helpful to reduce surface moisture loss to the atmosphere and ease crop stress slightly.
- The July 2023 outlook shows an increased chance for above-normal temperatures across the region (Figure 10). Unfortunately, the precipitation signal is not clear with equal chances for above-, near-, or below-normal precipitation across much of the region (Figure 11). There will likely be some areas that receive enough rainfall to ease some drought impacts (e.g., reduce yield loss); however, others will likely continue to be dry as summer precipitation tends to be more convective (i.e., spotty) and not as widespread.
- The Significant Wildland Fire Potential Outlook shows the potential for above-normal fire potential in the Upper Midwest (northern Minnesota, northern Wisconsin, and Michigan) in July (Figure 12).
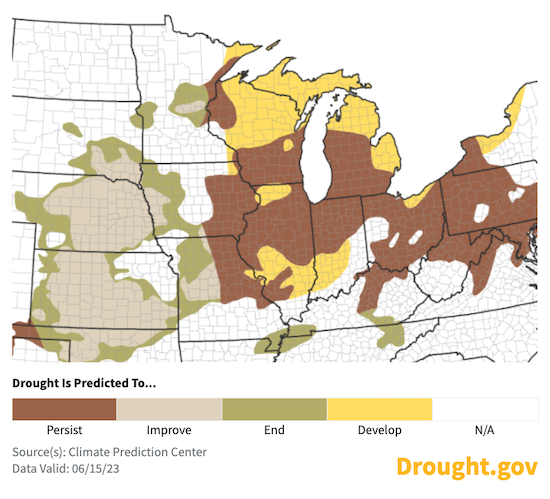
- The seasonal drought outlook for June 15–September 30, 2023 shows that drought is likely to persist and possibly expand across the region (Figure 13). Therefore, drought impacts are likely to persist and worsen across the region.
Figure 9. 8–14 Day Precipitation Outlook (Valid June 30–July 6, 2023)
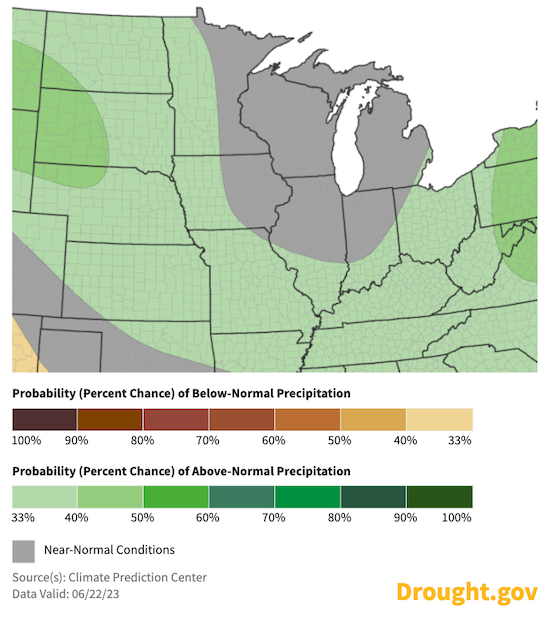
Figure 10. Monthly Temperature Outlook for July 2023
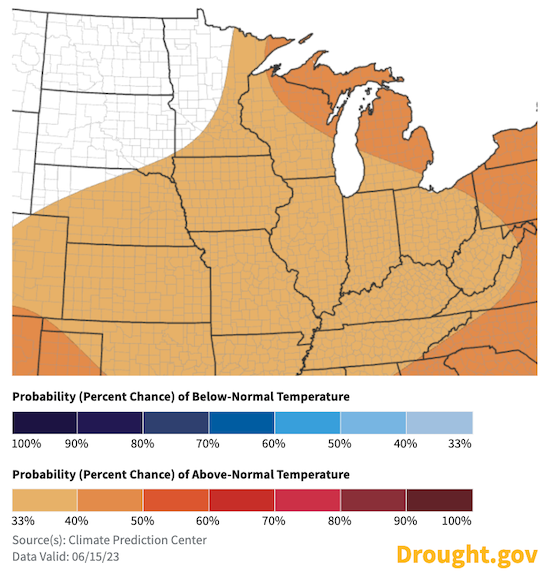
Figure 11. Monthly Precipitation Outlook for July 2023
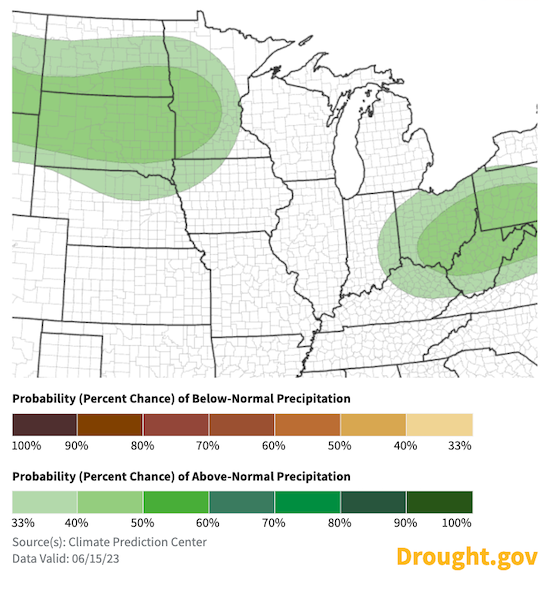
Figure 12. Significant Wildland Fire Potential Outlook (July 2023)
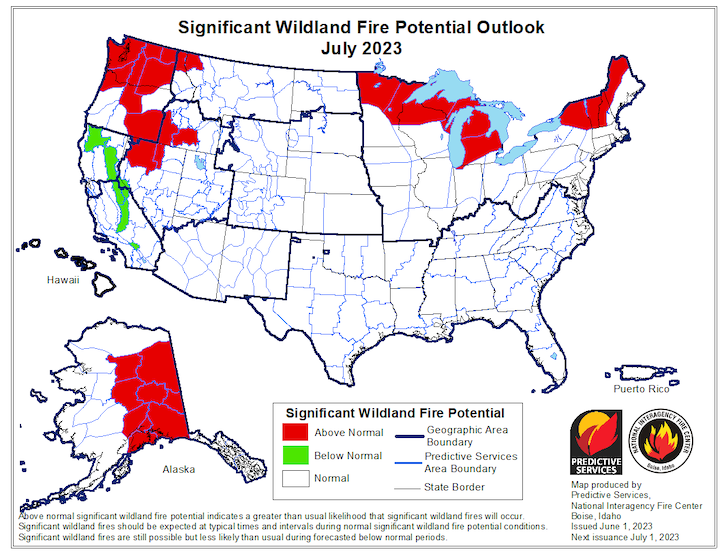
Figure 13. Seasonal Drought Outlook for June 15-September 30, 2023
For More Information
- NIDIS and its partners will issue future updates as conditions evolve.
- A special thank you to the state climate offices and National Weather Service offices in the Midwest for providing local information on drought conditions and impacts included in the webinar and on this report.
- More local information is available from the following resources:
- To report or view local drought impact information:
- Report your Drought Impacts through Condition Monitoring Observer Reports (CMOR).
- View CoCoRaHS Condition Monitoring reports.
- Special Drought Webinar Announcement: Thursday, July 6, 2023 at 1pm Central
- Due to the rapidly drying conditions across the Midwest and consequent impacts, we will hold a special North Central U.S. Drought and Climate Outlook webinar on Thursday, July 6 at 1pm Central. Register here.
Prepared By
Molly Woloszyn
NOAA/National Integrated Drought Information System (NIDIS), CIRES/CU Boulder
Doug Kluck
NOAA/National Centers for Environmental Information
Dennis Todey & Laura Nowatske
USDA Midwest Climate Hub
Audra Bruschi & Victor Murphy
NOAA/National Weather Service Central and Southern Region
Jim Noel & Mike Welvaert
NOAA/Ohio and North Central River Forecast Center
Melissa Widhalm
Midwestern Regional Climate Center/Purdue University
Anna Wolverton
U.S. Army Corps of Engineers Mississippi Valley Division/NOAA National Weather Service
This drought status update is issued in partnership between the National Oceanic and Atmospheric Administration (NOAA) and the U.S. Department of Agriculture (USDA) to communicate a potential area of concern for drought expansion and/or development within the Midwest based on recent conditions and the upcoming forecast. NIDIS and its partners will issue future drought status updates as conditions evolve.


